

Abstract
The fluorescent nucleic acid binding dyes hexidium iodide (HI) and SYTO 13 were used in combination as a Gram stain for unfixed organisms in suspension. HI penetrated gram-positive but not gram-negative organisms, whereas SYTO 13 penetrated both. When the dyes were used together, gram-negative organisms were rendered green fluorescent by SYTO 13; conversely, gram-positive organisms were rendered red-orange fluorescent by HI, which simultaneously quenched SYTO 13 green fluorescence. The technique correctly predicted the Gram status of 45 strains of clinically relevant organisms, including several known to be gram variable. In addition, representative strains of gram-positive anaerobic organisms, normally decolorized during the traditional Gram stain procedure, were classified correctly by this method.
Gram’s staining method is considered fundamental in bacterial taxonomy. The outcome of the Gram reaction reflects major differences in the chemical composition and ultrastructure of bacterial cell walls. The Gram stain involves staining a heat-fixed smear of cells with a rosaniline dye such as crystal or methyl violet in the presence of iodine, with subsequent exposure to alcohol or acetone. Organisms that are decolorized by the alcohol or acetone are designated gram negative.
Alternative Gram staining techniques have recently been proposed. Sizemore et al. (19) reported on the use of fluorescently labeled wheat germ agglutinin. This lectin binds specifically to N-acetylglucosamine in the peptidoglycan layer of gram-positive bacteria, whereas gram-negative organisms contain an outer membrane that prevents lectin binding. Although simpler and faster than the traditional Gram stain, this method requires heat fixation of organisms.
Other Gram stain techniques suitable for live bacteria in suspension have been described. Allman et al. (1) demonstrated that rhodamine 123 (a lipophilic cationic dye) rendered gram-positive bacteria fluorescent, but its uptake by gram-negative organisms was poor. This reduced uptake by gram-negative bacteria was attributed to their outer membranes. The outer membrane can be made more permeable to lipophilic cations by exposure to the chelator EDTA (4). Shapiro (18) took advantage of this fact to form the basis of another Gram stain, one which involved comparing the uptake of a carbocyanine dye before and after permeabilizing organisms with EDTA. All of these methods, however, rely on one-color fluorescence, making analysis of mixed bacterial populations difficult.
An alternative to the use of stains is the potassium hydroxide (KOH) test. The method categorizes organisms on the basis of differences in KOH solubility. After exposure to KOH, gram-negative bacteria are more easily disrupted than gram-positive organisms. This technique has been used to classify both aerobic and facultatively anaerobic bacteria, including gram-variable organisms (8). In a study by Halebian et al. (9), however, this technique incorrectly classified several anaerobic strains, giving rise to the recommendation that the method should only be used in conjunction with the traditional Gram stain.
In this study we demonstrate a Gram staining technique for unfixed organisms in suspension, by using clinically relevant bacterial strains and organisms notorious for their gram variability. The method uses two fluorescent nucleic acid binding dyes, hexidium iodide (HI) and SYTO 13. Sales literature (11) published by the manufacturers of HI (Molecular Probes, Inc., Eugene, Oreg.), which displays a red fluorescence, suggests that the dye selectively stains gram-positive bacteria. SYTO 13 is one of a group of cell-permeating nucleic acid stains and fluoresces green (11). These dyes have been found to stain DNA and RNA in live or dead eukaryotic cells (16). Both dyes are excited at 490 nm, permitting their use in fluorescence instruments equipped with the most commonly available light sources. We reasoned that a combination of these two dyes applied to mixed bacterial populations would result in all bacteria being labeled, with differential labeling of gram-positive bacteria (HI and SYTO 13) and gram-negative bacteria (SYTO 13 only). The different fluorescence emission wavelengths of the two dyes would ensure differentiation of gram-positive from gram-negative bacteria by either epifluorescence microscopy or flow cytometry when equipped with the appropriate excitation and emission filters. While a commercial Gram stain kit produced by Molecular Probes includes HI and an alternative SYTO dye, SYTO 9, we are unaware of any peer-reviewed publications regarding either its use or its effectiveness with traditionally gram-variable organisms.
MATERIALS AND METHODS
Bacterial strains and media.
We examined a range of bacterial strains supplied as fresh isolates from clinical specimens by the Department of Microbiology, St. Thomas’s Hospital, London, United Kingdom, including Bacillus spp., Staphylococcus aureus (n = 8), Staphylococcus saprophyticus (n = 3), Enterococcus spp. (n = 6), Enterococcus faecalis (n = 5), Acinetobacter spp., Escherichia coli (n = 10), Pseudomonas aeruginosa (n = 4), Proteus spp. (n = 4), and Klebsiella spp. (n = 5). We also studied several anaerobic organisms, including Clostridium ramosum NCTC 11812 and Proprionibacterium acnes NCTC 0737, which were obtained directly from the National Collection of Type Cultures, London, United Kingdom. In addition, William Wade of the Department of Oral Medicine and Pathology, Guy’s Hospital, London, United Kingdom, kindly supplied the following anaerobic strains: Eubacterium brachy ATCC 33089, Eubacterium infirmum NCTC 12940, Eubacterium timidum ATCC 33093, and Fusobacterium nucleatum NCTC 11326.
Clinical isolates were maintained on Columbia blood agar or cysteine lactose electrolyte-deficient medium (Unipath). Anaerobic strains were cultured on fastidious anaerobe agar (LabM). Plates were incubated under anaerobic conditions generated with an AnaeroGen (Oxoid) AN25 sachet in a 2.5-liter sealed gas jar.
Experimental procedure.
All isolates were cultured overnight at 37°C in Iso-Sensitest broth (ISO-B) (Unipath) which had been passed through a 0.2-μm (pore size) filter. Then 1 ml of each bacterial suspension was removed, pelleted by spinning at 15,000 × g for 1 min, washed once in ISO-B, and finally resuspended in fresh medium. Mixed bacterial populations were prepared by combining equal volumes of E. coli and S. aureus suspensions. Alcohol-fixed organisms were prepared from cultures of E. coli, Proteus spp., and Klebsiella spp. by removing an additional 1-ml aliquot from each of these cultures and centrifuging as before. The pellets were resuspended in 70% ethanol in distilled water for 10 min before being washed and resuspended in ISO-B. The effect of EDTA on HI uptake by E. coli was investigated by adding 1 mM EDTA during the staining procedure outlined below.
In the case of anaerobic organisms, single colonies were removed from culture plates and resuspended in 1 ml of phosphate-buffered saline (pH 7.4) that had been passed through a 0.2-μm (pore size) filter. These suspensions were incubated with the dyes as described below.
Dyes and staining protocols.
HI (5 mg) was dissolved in 1 ml of dimethyl sulfoxide to give a stock solution of 5 mg/ml, which was further diluted 1:50 (vol/vol) in 10 mM Tris-HCl (pH 7.4) to give a working solution of 100 μg/ml. SYTO 13 (Molecular Probes, Inc.) was supplied by the manufacturer as a 5 mM solution in dimethyl sulfoxide, which was diluted 1:10 (vol/vol) in 10 mM Tris-HCl to give a working solution of 0.5 mM. Bacterial suspensions were incubated at room temperature with a 1:25 (vol/vol) addition of the SYTO 13 working solution (to give a final concentration of 20 μM) or with a 1:10 (vol/vol) addition of the HI working solution (to give a final concentration of 10 μg/ml) for 2 or 15 min, respectively. Mixed bacterial suspensions of E. coli and S. aureus were incubated with both HI and SYTO 13 in the ratios indicated above for 15 min at room temperature.
Traditional Gram stains were carried out with a Gram stain kit (Sigma) according to the manufacturer’s instructions.
Microscopy.
Aliquots (10 μl) of stained bacterial suspensions were placed on glass slides under cover slips and observed with a Nikon Diaphot (Kingston) inverted epifluorescence microscope fitted with a 100-W mercury arc lamp, Nikon B-2A filter (excitation, 450 to 490 nm; emission, >520 nm) and a ×90 oil immersion objective lens. Traditional Gram stains were viewed by bright-field transillumination.
Photomicrographs were obtained with a Nikon FE camera and Kodak Ektachrome ISO 400 color slide film.
Flow cytometry.
Stained suspensions were also analyzed with an enhanced Bryte HS (Bio-Rad) xenon arc lamp-based flow cytometer. The instrument is equipped with two light scatter detectors (one each for light scattered <15° and >15°) and three fluorescence detectors fitted with filter blocks that deliver wavelengths with the following specifications, as designated: FL1, 515 to 565 nm; FL2, 565 to 605 nm; and FL3, >605 nm. Excitation wavelength was restricted to 470 to 490 nm by using the standard fluorescein isothiocyanate filter block, which also allowed emission from 520 to 560 nm, with a beam splitter at 510 nm. SYTO 13 (maximum emission at 509 nm) green fluorescence was detected on FL1. HI (maximum emission at 605 nm) orange-red fluorescence was detected primarily on FL2, with some spectral overlap into FL3. Logarithmic amplification was used throughout, and fluorescence acquisition was gated by light scatter parameters. Electronic compensation for spectral overlap of the dyes was set in the instrument software, the sample flow rate was set to 2 μl/min, and at least 5,000 organisms were acquired for analysis.
RESULTS
Microscopy.
All clinical isolates (with the exception of Acinetobacter spp.) were stained correctly as defined by cell wall structure by the traditional Gram stain technique. The Acinetobacter spp. gave a gram-positive result. In addition, C. ramosum, E. infirmum, E. timidum, and P. acnes had a “washed out” appearance that precluded classification.
Fluorescence microscopy revealed that all of the gram-positive organisms and the traditionally gram-negative organism F. nucleatum fluoresced bright orange-red when stained with HI, whereas no fluorescence was observed with other unfixed gram-negative organisms with this dye. In contrast, all strains fluoresced bright green in the presence of SYTO 13. When gram-positive organisms and F. nucleatum were stained simultaneously with SYTO 13 and HI, however, the green fluorescence emission of SYTO 13 was quenched by that of HI (Fig. 1). In contrast, the SYTO 13-associated fluorescence seen in other gram-negative organisms persisted in the presence of HI, presumably reflecting the ability of these unfixed organisms to exclude this dye. Finally, fixation of gram-negative organisms with ethanol rendered them permeable to and fluorescent with HI.
FIG. 1.
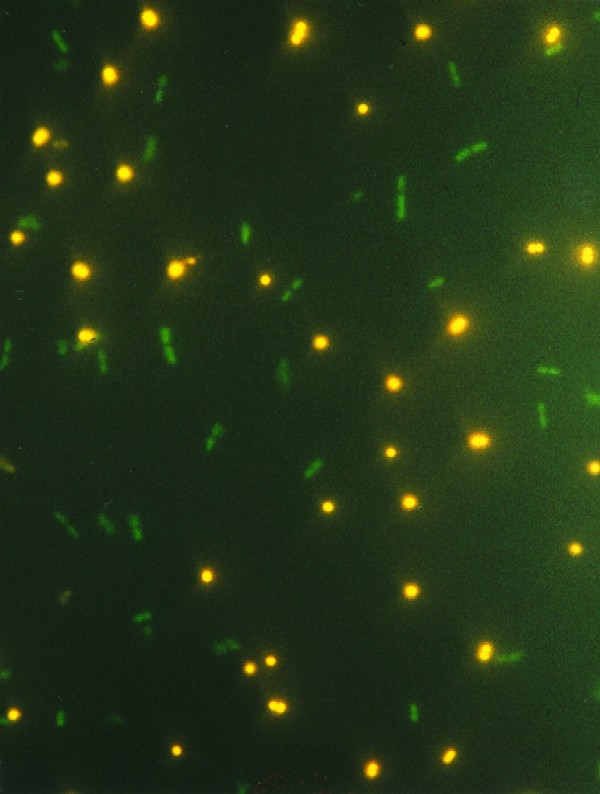
Photomicrograph of a mixed microbial population after staining with HI (10 μg/ml) and SYTO 13 (20 μM). Gram-negative bacteria (E. coli) and gram-positive bacteria (S. aureus) fluorescing green and orange-red, respectively, are shown.
Flow cytometry.
Flow cytometric analysis of organisms stained with HI or SYTO 13 confirmed microscopy results and allowed quantitative assessment of staining intensity and percentage. The intensity of HI-associated fluorescence from gram-positive strains and F. nucleatum was at least one log order greater than that from other unfixed gram-negative organisms (Fig. 2). Table 1 summarizes flow cytometric results obtained from all strains following incubation with HI. All strains tested were rendered fluorescent by SYTO 13, in contrast to HI, irrespective of Gram staining status (Fig. 3). Data obtained from a mixed bacterial population (S. aureus and E. coli in a ratio of 1:1) stained with both SYTO 13 and HI are shown in Fig. 4. Figure 4 shows that while distinguishing between these two bacterial species by light scatter parameters alone is difficult if not impossible (Fig. 4A), the two microbial populations can be clearly separated on the basis of differential fluorescence wavelength (Fig. 4B).
FIG. 2.

Comparison of a gram-negative culture and a gram-positive culture stained with HI (10 μg/ml). Data are displayed as flow cytometric histograms of 5,000 bacterial events in which the axes represent the relative number of cells (y axis) and the cell-associated fluorescence on a logarithmic scale (x axis). □, Gram-negative culture (Proteus spp.); ▪, gram-positive culture (Enterococcus spp.). The marked region represents stained organisms, i.e., those with a fluorescence intensity above the first decade. These histograms are typical of all of the gram-negative and gram-positive strains tested.
TABLE 1.
Data obtained from flow cytometric analysis of all bacterial strains after incubation with HI
| Gram-positive strain (sample no.) | % Staineda | Gram-negative strain (sample no.) | % Staineda | |
|---|---|---|---|---|
| Bacillus spp. | 90.0 | Acinetobacter spp. | 1.2 | |
| C. ramosum NCTC 11812 | 93.6 | E. coli (1) | 9.7 | |
| Enterococcus spp. (1) | 95.8 | E. coli (2) | 13.3 | |
| Enterococcus spp. (2) | 87.0 | E. coli (3) | 14.6 | |
| Enterococcus spp. (3) | 98.3 | E. coli (4) | 10.5 | |
| Enterococcus spp. (4) | 95.1 | E. coli (5) | 6.9 | |
| Enterococcus spp. (5) | 94.0 | E. coli (6) | 14.4 | |
| Enterococcus spp. (6) | 92.7 | E. coli (7) | 4.9 | |
| E. faecalis (1) | 99.1 | E. coli (8) | 8.3 | |
| E. faecalis (2) | 98.4 | E. coli (9) | 14.5 | |
| E. faecalis (3) | 99.7 | E. coli (10) | 13.0 | |
| E. faecalis (4) | 86.4 | F. nucleatum | 89.0 | |
| E. faecalis (5) | 99.8 | Klebsiella spp. (1) | 2.1 | |
| E. infirmum NCTC 12940 | 86.8 | Klebsiella spp. (2) | 8.8 | |
| E. brachy ATCC 33089 | 89.7 | Klebsiella spp. (3) | 6.1 | |
| E. timidum ATCC 33093 | 97.2 | Klebsiella spp. (4) | 3.0 | |
| P. acnes NCTC 0737 | 97.4 | Klebsiella spp. (5) | 4.8 | |
| S. aureus (1) | 85.4 | Proteus spp. (1) | 7.4 | |
| S. aureus (2) | 95.5 | Proteus spp. (2) | 1.0 | |
| S. aureus (3) | 80.0 | Proteus spp. (3) | 2.1 | |
| S. aureus (4) | 93.1 | Proteus spp. (4) | 2.7 | |
| S. aureus (5) | 87.9 | P. aeruginosa (1) | 7.2 | |
| S. aureus (6) | 97.7 | P. aeruginosa (2) | 13.0 | |
| S. aureus (7) | 93.8 | P. aeruginosa (3) | 15.2 | |
| S. aureus (8) | 96.0 | P. aeruginosa (4) | 17.9 | |
| S. saprophyticus (1) | 90.4 | |||
| S. saprophyticus (2) | 95.4 | |||
| S. saprophyticus (3) | 70.0 |
The percentage of stained organisms refers to the proportion of bacterial cells with a fluorescence intensity above the first decade (see Fig. 2).
FIG. 3.

Comparison of stained and unstained cultures of S. aureus. The dye used was SYTO 13 (20 μM). The data are displayed as flow cytometric histograms of 5,000 bacterial events in which the axes represent the relative number of cells (y axis) and the cell-associated fluorescence on a logarithmic scale (x axis). □, Unstained culture; ▪, stained culture. These histograms are typical of all of the strains tested.
FIG. 4.

Dual-parameter histograms of 5,000 bacterial events acquired from a mixed population of gram-negative (E. coli) and gram-positive (S. aureus) bacteria stained with HI (10 μg/ml) and SYTO 13 (20 μM). (A) Data accumulated from light scatter parameters, where the axes represent side-angle scatter (y axis) and forward-angle scatter (x axis). (B) Data accumulated from fluorescence parameters, where the axes represent cell-associated HI fluorescence (y axis) and cell-associated SYTO 13 fluorescence (x axis). The percentages relate to the proportion of particles found in each quadrant.
Ethanol-fixed gram-negative bacteria fluoresced with HI to an intensity equivalent to that of unfixed gram-positive organisms. Exposure of E. coli to EDTA (1 mM) induced the uptake of HI in some (58%) organisms.
DISCUSSION
We have found the HI-SYTO 13 dye combination to be effective, allowing the rapid identification and enumeration of gram-negative and gram-positive bacteria in suspension. Furthermore, a washing step following labeling is not necessary, and the technique is equally applicable to flow cytometry and epifluorescence microscopy. Our technique also correctly classified those organisms that were either incorrectly or poorly stained by the traditional Gram stain technique. Thus, Acinetobacter spp. were incorrectly characterized as gram-positive organisms by the traditional method due to incomplete decolorization. This phenomenon has been related to the use of “stabilized” polyvinylpyrrolidone iodine as a mordant rather than iodine in potassium iodide solution (10). The mordant used in our Gram stain kit, however, consisted of iodine (0.33% [wt/vol]) in potassium iodide (0.66% [wt/vol]). False-gram-positive staining of Acinetobacter spp. has been associated with delayed diagnosis and inappropriate antibiotic therapy (7, 20). All of the anaerobic gram-positive organisms in this study were characteristically decolorized (5, 12) during the traditional Gram stain procedure. Using a modified Gram stain to study the staining reaction by electron microscopy, Beveridge (2) demonstrated that cytoplasmic voids were formed close to the cell wall and septation sites in P. acnes, causing the cells to lyse and appear gram negative. Clostridium spp., on the other hand, were found to alter their conformation with time, with thinning of the peptidoglycan cell wall towards late-exponential-growth phase, presumably explaining their inability to retain the crystal violet.
Exposure of gram-negative bacteria to EDTA destabilizes bacterial lipopolysaccharides (LPS) after removal of essential cations (13–14). Such events may account for the HI uptake observed in EDTA-treated E. coli, suggesting that the LPS-rich outer membrane may play a part in the exclusion of the dye from these organisms. Alcohol fixation similarly abolishes the ability of gram-negative organisms to exclude HI, suggesting that this dye provides an indication of outer membrane integrity in gram-negative organisms. Such properties have also been noted for propidium iodide (6) and SYTOX green (17). We believe that the HI staining of the traditionally gram-negative organism F. nucleatum reflects its recent classification to a cluster of low-GC gram-positive organisms (15). This discrepant finding between Gram and HI staining suggests that quite different mechanisms are responsible for the interaction of either crystal violet or HI with bacteria. Unlike Gram staining, staining with HI may be reflecting the “true” Gram status as determined by sequence relatedness studies, and this occurs irrespective of the close structural relationship of the lipid A fragment of F. nucleatum LPS to that of the Enterobacteriaceae (3).
This staining technique has potential for widespread application in clinical and environmental microbiology. Its usefulness will depend on whether this dye combination performs equally well with other organisms of clinical or environmental relevance, which still needs to be determined before its unrestricted application. Once this reservation has been addressed and overcome, the method could conceivably be adapted for the rapid and possibly automated detection and assessment of gram reactivity of bacteria present in liquid samples from industrial, environmental, and clinical sources.
ACKNOWLEDGMENTS
We thank Gary French for his financial support and without whom we would have had no ultrapure water and UMDS for the laboratory space. This work was not supported by any charitable organization.
REFERENCES
- 1.Allman R, Manchee R, Lloyd D. Flow cytometric analysis of heterogeneous bacterial populations. In: Lloyd D, editor. Flow cytometry in microbiology. London, England: Springer-Verlag; 1993. pp. 27–47. [Google Scholar]
- 2.Beveridge T J. Mechanism of Gram variability in select bacteria. J Bacteriol. 1990;172:1609–1620. doi: 10.1128/jb.172.3.1609-1620.1990. [DOI] [PMC free article] [PubMed] [Google Scholar]
- 3.Dahlen G, Mattsby-Baltzer I. Lipid A in anaerobic bacteria. Infect Immun. 1983;39:466–468. doi: 10.1128/iai.39.1.466-468.1983. [DOI] [PMC free article] [PubMed] [Google Scholar]
- 4.Davey H M, Kell D B. Flow cytometry and cell sorting of heterogeneous microbial populations: the importance of single cell analyses. Microbiol Rev. 1996;60:641–696. doi: 10.1128/mr.60.4.641-696.1996. [DOI] [PMC free article] [PubMed] [Google Scholar]
- 5.Esteban J, García-Calvo G, Jiménez-Castillo P, Soriano F. Failure of Gram stain to detect Propionibacterium acnes in specimens from clinically significant infections. J Clin Microbiol. 1996;34:2051. doi: 10.1128/jcm.34.8.2051-2051.1996. [DOI] [PMC free article] [PubMed] [Google Scholar]
- 6.Gant V A, Warnes G, Phillips I, Savidge G F. The application of flow cytometry to the study of bacterial responses to antibiotics. J Med Microbiol. 1993;39:147–154. doi: 10.1099/00222615-39-2-147. [DOI] [PubMed] [Google Scholar]
- 7.Goodhart G L, Abrutyn E, Watson R, Root R K, Egert J. Community-acquired Acinetobacter calcoaceticus var. anitratus pneumonia. JAMA. 1977;238:1516–1518. [PubMed] [Google Scholar]
- 8.Gregerson T. Rapid method for distinction of gram-negative from gram-positive bacteria. Eur J Appl Microbiol Biotechnol. 1978;5:123–127. [Google Scholar]
- 9.Halebian S, Harris B, Finegold S M, Rolfe R D. Rapid method that aids in distinguishing gram-positive from gram-negative anaerobic bacteria. J Clin Microbiol. 1981;13:444–448. doi: 10.1128/jcm.13.3.444-448.1981. [DOI] [PMC free article] [PubMed] [Google Scholar]
- 10.Harrington B J. Letter. Clin Microbiol Newsl. 1997;19:191. [Google Scholar]
- 11.Haughland R P. Nucleic acid detection. In: Spence M T Z, editor. Handbook of fluorescent probes and research chemicals. Eugene, Oreg: Molecular Probes, Inc.; 1996. pp. 143–168. [Google Scholar]
- 12.Johnson M J, Thatcher E, Cox M E. Techniques for controlling variability in Gram staining of obligate anaerobes. J Clin Microbiol. 1995;33:755–758. doi: 10.1128/jcm.33.3.755-758.1995. [DOI] [PMC free article] [PubMed] [Google Scholar]
- 13.Nikaido H, Vaara M. Molecular basis of outer membrane permeability. Microbiol Rev. 1985;49:1–32. doi: 10.1128/mr.49.1.1-32.1985. [DOI] [PMC free article] [PubMed] [Google Scholar]
- 14.Nikaido H, Vaara M. Outer membrane. In: Neidhardt F, Ingraham J, Low K B, Magasanik B, Schaechter M, Umbarger H E, editors. Escherichia coli and Salmonella typhimurium: cellular and molecular biology. Washington, D.C: American Society for Microbiology; 1987. pp. 7–22. [Google Scholar]
- 15.Olsen G J, Woese C R, Overbeek R. The winds of (evolutionary) change: breathing new life into microbiology. J Bacteriol. 1994;176:1–6. doi: 10.1128/jb.176.1.1-6.1994. [DOI] [PMC free article] [PubMed] [Google Scholar]
- 16.Poot M, Gibson L L, Singer V L. Detection of apoptosis in live cells by MitoTracker red CMXRos and SYTO dye flow cytometry. Cytometry. 1997;27:358–364. [PubMed] [Google Scholar]
- 17.Roth B L, Poot M, Yue S T, Millard P J. Bacterial viability and antibiotic susceptibility testing with SYTOX green nucleic acid stain. Appl Environ Microbiol. 1997;63:2421–2431. doi: 10.1128/aem.63.6.2421-2431.1997. [DOI] [PMC free article] [PubMed] [Google Scholar]
- 18.Shapiro H M. Practical flow cytometry. 3rd ed. New York, N.Y: Alan R. Liss, Inc.; 1995. pp. 367–425. [Google Scholar]
- 19.Sizemore R K, Caldwell J J, Kendrick A S. Alternate Gram staining technique using a fluorescent lectin. Appl Environ Microbiol. 1990;56:2245–2247. doi: 10.1128/aem.56.7.2245-2247.1990. [DOI] [PMC free article] [PubMed] [Google Scholar]
- 20.Verghese A, Berk S L. Bacterial pneumonia in the elderly. Medicine. 1983;62:271–285. doi: 10.1097/00005792-198309000-00002. [DOI] [PubMed] [Google Scholar]