

Abstract
In 1971, the first patient CT exam by Ambrose and Hounsfield paved the way for not only volumetric imaging of the brain but of the entire body. From the initial 5-minute scan for a 180-degree rotation to today’s 0.24 second scan for a 360-degree rotation, CT technology continues to reinvent itself. This article describes key historical milestones in CT technology from the earliest days of CT to the present, with a look toward the future of this essential imaging modality. After a review of the beginnings of CT and its early adoption, the technical steps taken to decrease scan times – both per image and per exam – are reviewed. Novel geometries such as electron beam CT and dual-source CT have also been developed in the quest for ever faster scans and better in-plane temporal resolution. The focus of the past two decades on radiation dose optimization and management led to changes in how exposure parameters such as tube current and tube potential are prescribed such that today, exams are more customized to the specific patient and diagnostic task than ever before. In the mid-2000s, CT expanded its reach from greyscale to color with the clinical introduction of dual-energy CT. Today’s most recent technical innovation – photon counting CT – offers greater capabilities in multi-energy CT as well spatial resolution as good as 125 microns. Finally, artificial intelligence is poised to impact both the creation and processing of CT images, as well as automating many tasks to provide greater accuracy and reproducibility in quantitative applications.
Introduction
The October 1971 issue of the journal Radiology (1) includes articles representative of the field of radiology at that time. Notably absent, is anything related to cross-sectional imaging. That would soon change, as outside of London, UK, Godfrey Hounsfield was working with radiologist James Ambrose to acquire the first computerized axial tomographic scan. Today, known as CT imaging, it is the workhorse of a modern radiology department that few could envision practicing medicine without. In a study of primary care physicians regarding technical advances of the 20th century, CT and MRI tied as the top two advances in medical technology that had the greatest impact on the practice of medicine (2). From the first patient, it was clear that CT would revolutionize diagnostic imaging and therapeutic planning. Fittingly, only eight years after that first scan, Godfrey N. Hounsfield and Alan M. Cormack were jointly awarded the Nobel Prize in Physiology or Medicine for the development of computer-assisted tomography (3). This article summarizes major technology milestones in the history of CT imaging (Figure 1) (4–25) and highlights important clinical advances made possible by technological developments, with a discussion of future directions.
Figure 1.

Major milestones in the history of CT.
In the Beginning
In the 1950s, physicist Allan M. Cormack recognized the mathematical possibility of describing the interior of an object from knowledge of transmission measurements through an object (Figure 2a-b) (26). Using a phantom and a radioisotope source to take measurements, Cormack calculated the attenuation coefficients for wood and aluminum from transmission measurements through the phantom. Cormack published these results in 1963 (4) and 1964 (27), providing the first experimental demonstration of a CT scan, which warranted Cormack’s sharing of the Nobel Prize with Hounsfield in 1979.
Figure 2.


Alan Cormack (a) and equations from Cormack’s 1963 paper (b) establishing the ability to describe an object as a function of its line integrals. Godfrey Hounsfield (c) and figure from Hounsfield’s 1973 paper (d) describing the principles of computerized transverse axial scanning (tomography). Reprinted, with permission, from reference (26) (a), (4) (b), and (6) (d).
Unaware of Cormack’s work, Godfrey Hounsfield (Figure 2c), an engineer at Electric and Musical Industries (EMI), considered the same question (28–30). Beginning with manual arithmetic, Hounsfield calculated the correct values for a grid of three columns by three rows from the sums of four projections through the grid -- in essence solving a sudoku puzzle. Certain that a computer could extend this capability (31), Hounsfield made a formal proposal to his employer and the United Kingdom’s Department of Health and Social Security for funding. After approval of his proposal, Hounsfield built a tabletop system to scan phantoms and cadaveric specimens. With the first images in hand demonstrating the ability to image the inside of a brain specimen, in 1970 Hounsfield began the development of a full-size model capable of scanning the human head.
With radiologist James Ambrose from Atkinson Morley Hospital in the UK, on October 1, 1971, the first patient scan was performed (5) (Figure 3). It took two days for Dr. Ambrose to see these pioneering images as they had to undergo reconstruction on a mainframe computer at EMI (6). Hounsfield and Ambrose presented their results at the British Institute of Radiology conference in April 1972, generating some enthusiasm (31). In May, Hounsfield spoke at a neuroradiology course at the Albert Einstein College of Medicine. This time the excitement was uncontainable, and news of Hounsfield’s accomplishment aired on all three television networks the next day. Hounsfield and Ambrose displayed the brain scanning machine at the 1972 meeting of the Radiological Society of North America (RSNA), where they gave a talk immediately following the president’s address, receiving a standing ovation. It was clear that nothing would be the same again.
Figure 3.


Photograph of the first CT scanner (a) and the first CT image (b). The scan was performed by Dr. James Ambrose at Atkinson Morley’s Hospital in London. The patient had a frontal lobe tumor. Reprinted, with permission, from reference (6) (a) and (31) (b).
Early adoption
Ambrose’s first patient had a suspected frontal lobe tumor (31), which was clearly seen on the 80 × 80-pixel image (Figure 3b), and confirmed at surgery. Following this success, three units were built for the UK and two for the USA, and on June 19, 1973, the Mayo Clinic performed the first CT scan in North America. After the installation of the EMI Mark I scanner (as it became known), Mayo’s monthly volume of CT scans reached 150 before the installation of a second unit a year later to increase capacity. By early 1975, almost 300 head CT exams were performed every month (32). A “film jacket” consisted of 6 to 8 polaroid films taped into a manilla folder, one for each 13-mm slice examined. The EMI scanner had two detectors, and thus produced two image slices per 5-minute gantry rotation. The patient was manually repositioned between scan acquisitions and a complete exam could last almost an hour. But tellingly, pneumoencephalography volumes at Mayo Clinic fell to essentially zero as early as late 1975 (32).
The Need for Speed
With the success of CT scanning of the brain, it was natural to consider extending this technology to the rest of the body. In February 1974, Robert Ledley, DDS, built and installed the first whole-body CT scanner at Georgetown University Medical Center: The Automatic Computerized Transverse Axial scanner (33). It was conceptually very similar to the EMI Mark I scanner in that the x-ray beam translated from left to right across the patient, and then the gantry rotated 1 or 2 degrees depending on the scan mode, and the tube translated across the patient again. Referred to as the first generation of CT geometries, this design irradiated the two detectors along the z-axis with two pencil beams of radiation (Figure 4). In its first year of operation, it scanned 1100 patients, 116 of which were body regions other than the head.
Figure 4.

Illustration of four generations of CT scanner geometries. First and second generations were often referred to as translate/rotate geometries because the tube first translated across the patient and then the gantry rotated about the patient. Third generation was often referred to as rotate/rotate geometry because both the tube and the detector array rotated about the patient. Fourth generation was often referred to as rotate/stationary geometry, because the tube rotated about the patient while the ring of detectors remained stationary.
To image the torso well, short scan times were necessary, due to not only breathing artifacts, but also involuntary movements such as from the heart and bowel. To accomplish faster speeds, the pencil x-ray beam was widened into a fan shape, detected by a 30-degree bank of detectors (Figure 4). The wider coverage in the transverse direction only required eighteen 10-degree increments of the gantry, allowing the completion of a single scan (one “slice”) in 20 seconds. Referred to as second-generation CT, the ability of CT to spare patients unnecessary surgeries was quickly realized, “early experience revealed that the CT technique provided diagnostic information so convincing that, when correlated with other clinical data, nonoperative management of some patients was decided on” (34).
To acquire the hundreds of measurements at one angle around a patient faster, the translation of the x-ray tube across the patient was replaced with an even wider angular coverage (30–40 degrees) and simultaneous measurements across the patient (35). Referred to as third-generation scanner geometry, this is also known as rotate-rotate geometry because the x-ray tube and detector array both rotated together about the patient. In its infancy, this geometry was plagued with ring artifacts as any detector defect mapped out a ring in the image plane. To avoid this, the introduction of fourth-generation geometry (known as rotate-stationary) rotated the x-ray tube within a 360-degree ring of stationary detectors. While this resolved the issue of ring artifacts, in-plane anti-scatter collimation could not be used since the rays of the x-ray beam struck the detector at many different angles. It was also expensive as detectors remain one of the costliest components of a CT scanner. Due to their simple mechanics, relatively lower cost, acquisition speed, and compatibility with post-patient scatter grids, modern CT scanners are based on this third-generation technology.
A fifth-generation system used both a stationary detector array and a stationary x-ray source. Also known as electron beam CT (Figure 5), the electron gun emitted an electron beam that was magnetically swept quickly across a stationary tungsten anode surrounding the patient. The system was equipped with multiple detector arrays along the longitudinal axis, allowing the imaging of multiple levels of the heart in as short as 50 milliseconds. Acquisition of higher spatial resolution single-level scans was as short as 100 milliseconds, paving the way for single breath-hold imaging of the thorax and imaging of young children without sedation. Two now routine applications, pulmonary artery imaging and coronary artery calcium scanning, were first introduced on the electron beam CT system, which was made exclusively by Imatron Corporation, founded by the inventor of the technology, Dr. Doug Boyd. First commercially introduced in 1982, cardiac CT imaging was made possible by electron-beam CT (36) with imaging of the entire left ventricle possible in as short as 50 milliseconds. Widespread adoption of this technology was limited, however.
Figure 5.


Fifth generation geometry, also known as electron beam CT, used a stationary/stationary geometry (a). A side view of the system shows the electron accelerator behind the scanner (b).
The speed of electron beam CT challenged the major CT scanner manufacturers to try and further decrease their scan times, and at the RSNA meeting in 1989, spiral/helical CT was introduced (37). The enabling technology was the use of a “slip-ring” to conduct power and data between the rotating x-ray tube and detectors and the stationary gantry housing. Introduced commercially in 1990, spiral/helical CT allowed the acquisition of a volume of data in a breath-hold and brought tube rotation times down to 1 second. CT angiography performed with spiral/helical CT could display vessels without misregistration between acquisition planes, as occurred with step-and-shoot acquisition geometry (37).
Almost a decade after the introduction of spiral/helical CT, multi-detector-row CT (MDCT) was introduced wherein multiple detector rows existed along the z-axis (Figure 6) (14). The first systems had 4 data channels, used with different combinations of detector binning to acquire 4 nominally 1-, 2.5-, 3.75- or 5-mm images in a single rotation. This allowed longer z coverage of anatomy such as the aorta and led to the rise of run-off angiograms that covered from the top of the aortic arch down to the vessels of the feet.
Figure 6.
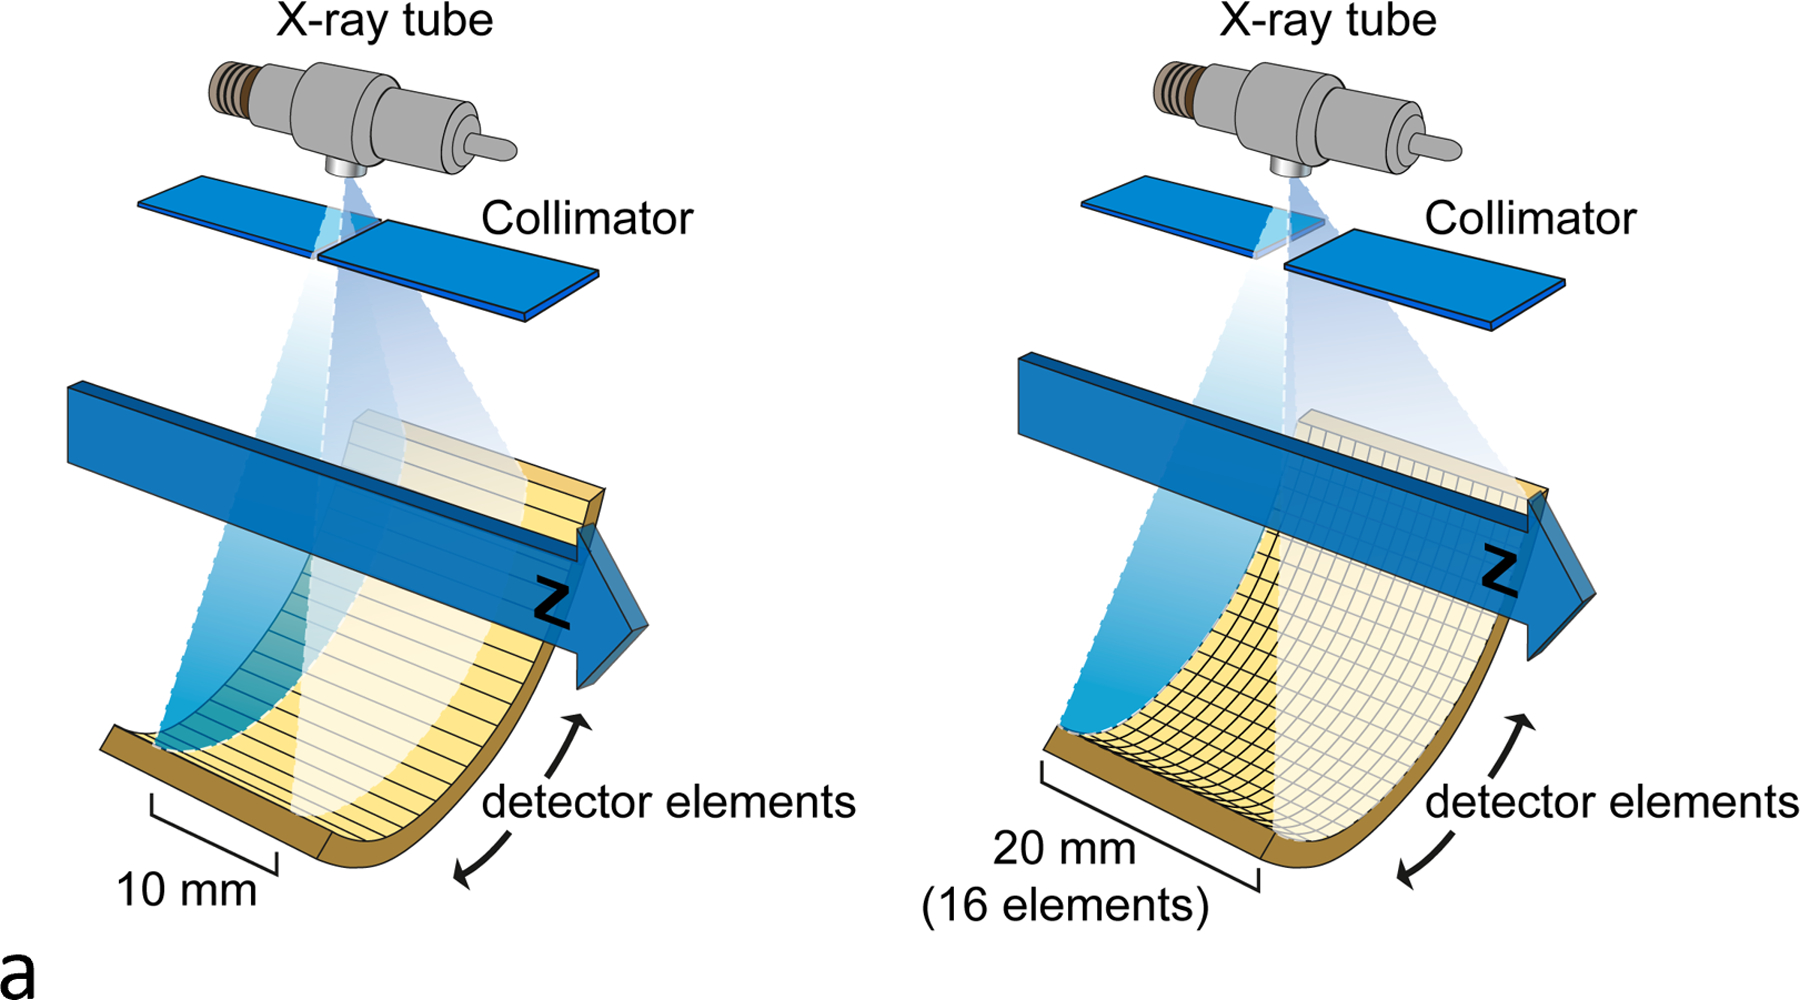


Illustration of single vs multi-detector row CT (a) and single vs multi-detector-row spiral CT (b). The z-axis coverage per rotation steadily increased, for example from a single 10-mm image to multiple images of varying thicknesses (c).
After the introduction of MDCT, the number of slices increased from 4 to 8, 16, 64, 128, and ultimately 320 detector channels along the z-axis (Figure 6). The z dimension of the detectors decreased, and dose inefficiencies of early multi-detector-row CT systems were replaced with routine scanning of 4 to 16 cm of coverage per rotation. It was possible to scan an entire adult from head to toe with isotropic spatial resolution in a single breath-hold. Or, one could scan an entire organ with a single gantry rotation with wide detector coverage. This is particularly beneficial in cardiac imaging; imaging the heart within a single heartbeat can avoid many motion artifacts, including those from arrhythmias (35). These advances in detector technology put stress on the x-ray tube, demanding higher tube currents and shorter rotation times. As the technology advanced, sub-second rotations became the norm. Today, commercial whole-body scanners have gantry rotation times as short as 0.25 s (25).
All the above technology advances combined to increase the quality and robustness of cardiac CT, as well as to decrease the associated radiation dose. Initially delivering an effective dose of approximately 20 mSv, doses below 1 mSv are now possible (38). Cardiac CT uses less than 360 degrees worth of projection data to provide stop-motion imaging of the heart. At the center of the gantry, this results in a temporal resolution of approximately one-half of the gantry rotation time for single-source scanners (35).
Decreases in rotation times below 0.5 s grew increasingly difficult from an engineering perspective, and while scan times continued to drop, the decreases became smaller. To achieve temporal resolution faster than 100 ms—the benchmark set with electron beam CT, which was the first commercial CT scanner to image the coronary arteries—multi-sector reconstruction was made commercially available (39). In this approach, projection data from multiple heart beats is used to improve the temporal resolution associated with cardiac reconstructions. Motion compensation algorithms to decrease motion artifacts have also been developed using data redundancies or by analyzing artifacts (40). Alternatively, dual-source scanner geometry uses two sources and two detector arrays (18), positioned approximately 90 degrees apart, to improve the temporal resolution of cardiac CT by a factor of two (Figure 7). Today’s dual-source CT systems offer a temporal resolution per image of nominally 65 msec. A dedicated cardiac CT system also has two x-ray tubes, but in the same x-y position, with a single detector. This has a gantry rotation time of 0.24 seconds with a temporal resolution of 120 msec. The system has a small field-of-view (25 cm), 14-cm detector width, and low cone beam artifacts (41). Regardless of the technical implementation, coronary CTA has become a first-line diagnostic test for patients with chest pain (42).
Figure 7.


Illustration of a dual-source CT geometry (a) and the dual-source “flash” scan mode, where the heart is imaged in a single gantry rotation (250 ms) through a series of images along the z-axis, with each image being slightly offset in time from the prior image (b).
With retrospective-ECG gating, data throughout the cardiac cycle can be obtained, which can provide four dimensional (3D + time) CT as well as quantify cardiac volumes and function. Recently, advanced metrics such as myocardial strain have been obtained (43). Computational fluid dynamics have been used to evaluate fractional flow reserve, which provides hemodynamic significance of coronary stenosis; assessment of intraventricular hemodynamics is in the early developmental stages (44, 45). Wide-coverage detectors and shuttle modes allow evaluation of perfusion, including that of the heart for myocardial ischemia, brain in patients with stroke, and in tumors for therapy monitoring (46).
Driving Doses Down
Around 2001, a publication theorizing that CT doses could increase long-term cancer risk in children put radiation from medical imaging in the spotlight (47). Professional societies, clinical practices, researchers, governmental organizations, and industry began to focus in earnest on reducing the doses associated with CT imaging. The introduction of new technologies and dose management strategies placed a particular focus on automatic exposure control systems that could adapt the applied dose to the size of a particular patient and the diagnostic task (Figure 8). These systems relied on a user-defined parameter to indicate the image quality needed and the CT localizer radiograph to measure the size (i.e., attenuation) of the patient. Learning to use these systems was sometimes difficult, as the algorithms and definitions used by each of the major manufacturers varied considerably (48). Once the system determined the dose to apply, the tube current was modulated automatically, sometimes in the x-y plane, sometimes in the z-axis direction, and sometimes in both. This would increase the tube current in thicker body regions and projections and decrease it in thinner, resulting in typical dose reductions of 20–40%. For cardiac CT, the electrocardiogram signal modulated the tube current according to the phase of interest in the cardiac cycle. This might, for example, involve turning down the tube current during systole, when there is more cardiac motion; a further review of tube current modulation is available (48).
Figure 8.


Illustration of angular and longitudinal tube current modulation, which varies the tube current according to the patient thickness (a). Scanned projection radiograph (b) and axial CT images at the levels of the upper thorax (c, 95 mAs), middle thorax (d, 101 mAs), liver (e, 369 mAs), and pelvis (f, 205 mAs) demonstrating the change in tube current associated with the change in body habitus. Reprinted, with permission, from reference (48).
The other key parameter that determines the dose applied to the patient is the tube potential (kV) of the x-ray tube. This establishes the energy distribution of the x-ray beam, which impacts not only dose but also contrast and noise in the image. In the interest of reducing doses in children (who are relatively small), the wisdom of always using 120 kV began to be questioned (49). X-ray tubes at that time could deliver the needed dose at lower tube potential settings. This had a two-fold effect: it reduced the applied dose (for the same tube current) and it increased iodine and bone signal as the mean energy of the beam moved closer to the k-edges of these materials. In some cases, increasing the tube current needed was necessary to obtain a sufficient dose at the lower tube energy, and x-ray tubes and generators increased their power capabilities such that on modern systems, most trim adults can be scanned at 100 kV (50).
Automatic tube potential selection, proposed by Yu et al, (50) was incorporated into several commercial systems. Dose reductions of 40 – 50% were reported (51) for applications with high iodine signal, such as angiographic applications, while there was minimal dose reduction when iodinated contrast media was not used. The use of both tube current modulation and tube potential optimization is very effective in tailoring the delivered dose to a specific patient and the specific diagnostic task.
In addition to the optimization of x-ray technique factors, other hardware steps to reduce dose included using more sizes of beam shaping filters and collimation of the beam at the start and stop locations of a spiral acquisition. The net result has been ever-decreasing CT dose levels. CT imaging of the coronary arteries benefited the most from the many dose reduction and management technologies and with the introduction of MDCT and sub-second gantry rotation times, cardiac CT became more widely available in the early 2000s (52, 53). In the four-MDCT era (four detector rows), effective doses from CT coronary angiography were about 10 – 12 mSv, with effective doses as high as 18 mSv reported (54–56). With the advent of high-pitch dual-source CT and volume (wide-coverage) CT, as well as electrocardiogram-based tube current modulation, dose levels have dropped precipitously in CT coronary angiography, with effective doses below 1 mSv reported (38, 57, 58).
To complement the changes in CT data acquisition, there has been much attention to the manner in which the projection data are reconstructed into images. Implemented with a variety of manufacturer-specific methods, the processes involved in iterative reconstruction are similar across manufacturers: a synthesized “forward-projection” of the initial reconstructed image (initial guess) is compared with the measured data and changes made to the reconstructed images in an iterative manner to reduce noise and, in some cases, sharpen details or reduce artifacts (Figure 9). This process breaks the traditional relationship between noise and dose observed with filtered-back-projection reconstruction and results in a non-linear relationship where the reconstruction algorithm’s impact on spatial resolution depends on the contrast of the object being imaged. For high-contrast structures (such as blood vessels), noise is effectively removed without blurring the vessels. However, for lower-contrast objects (such as liver lesions), the edges of the anatomy are blurred, often degrading low-contrast detection tasks (59, 60).
Figure 9.

Illustration of the processes involved in iterative reconstruction schematic.
The American College of Radiology’s CT dose index registry has collected data from across the U.S. to assess trends in dose levels. Diagnostic reference levels and achievable dose levels are used to indicate the 75th and 50th percentiles of the gathered data (61). This has led to a continuing reduction in CT doses (62, 63). It is important to keep in mind, however, that it is possible to reduce doses too much, such that the diagnostic content of the images is decreased (64). Studies to determine the diagnostic performance of radiologists as dose is reduced have shown that for low-contrast detection tasks, such as with liver metastases, aggressive dose reduction with iterative reconstruction also decreased observer performance (59, 65, 66).
Visualization techniques
The isotropic spatial resolution offered by MDCT techniques facilitated the development of several 3D visualization techniques. These 3D techniques improved the anatomical visualization for several vascular and non-vascular applications, especially in complex anatomies to determine spatial relationships. Maximum Intensity Projections (MIP) project voxels with the highest attenuation values through the image volume, which is useful for vascular imaging and small nodule detection. In contrast, minimum intensity projections (MiniP) projects voxels with the lowest attenuation values in the image volume, which is useful for airway abnormalities, the biliary tree, and pancreatic duct. Shaded surface displays (SSD) select the superficial attenuation values of a volume that are closest to a virtual viewer and generate the appearance of a shaded surface. Virtual endoscopy is a variation of SSD, which provides endoluminal views, most established in virtual colonoscopic which is an effective alternative to colonoscopy in colon cancer screening (67). Volume rendering, the current 3D visualization standard, utilizes a local lighting model and ray casting method to generate a 3D image from the volume of data, which is projected on a 2D display and manipulated in real time. Cinematic rendering with roots in animation movie industry provides photorealistic 3D images using a global illumination model and path tracing method (68).
3D models can also be used for 3D printing, which provides patient-specific personalized models of anatomy. These 3D printed models can be used for planning surgeries or interventions, simulation and bench testing of devices, creating customized devices and biomaterials, and educating physician and patients (69). Extended reality techniques that combine real and virtual environments are now emerging, with virtual reality creating a completely immersive simulated 3D environment that can be interacted with using hand controllers and augmented reality, which overlays virtual 3D objects onto the real environment. These techniques show promise in planning for surgeries and interventions, including in congenital heart disease (70).
From Greyscale to Color – Multi-energy Imaging
The x-ray attenuations of different materials—tissue, bone, or iodine for example—change depending on the energy of the impinging x-ray. In original writings, Hounsfield envisioned the ability to separate bone and iodine, but it took decades for dual-energy CT to become widely available (6). Dual-energy CT provides new capabilities to traditional grey-scale anatomic imaging, including material differentiation and material quantification (19, 71, 72). Examples of material differentiation include the differentiation of uric acid urinary stones from non-uric-acid stones and gout from pseudo gout (20, 73, 74). Examples of material quantification include the ability to quantify the concentration of iodinated contrast material present in tissue, organs, or vessels (75, 76). Further, the creation of virtual mono-energetic images can enhance iodinated contrast signal or reduce metal artifacts (77, 78). Other applications include the ability to subtract signal from a given material, creating virtual noncontrast or noncalcium images, in which iodine or calcium signal is removed, respectively (79). There are many ways to acquire dual-energy data, such as acquiring two scans at two different tube potentials, one immediately after the other (slow kV switching), acquiring one scan while the tube potential rapidly switched between a lower (eg, 80 kV) and a higher (eg, 140 kV) setting (fast kV switching), dual-source CT, dual-layer-detector CT, and dual-beam filtration CT (72, 80) (Figure 10).
Figure 10.

Illustrations of various approaches used in commercial products for dual-energy CT data acquisition.
Emerging applications and future directions
Photon counting CT
While there are several approaches to acquiring dual-energy CT data, photon-counting CT (PCCT) has the ability to simultaneously acquire more than two energy data sets (25, 81–83). Since the introduction of CT imaging in 1971, clinical CT scanners have used scintillating detectors, which use a two-step detection process that loses information about individual photons. The use of PCCTs, however, involves a single-step process to convert x-ray energy directly into an electrical signal (Figure 11). Information about individual photons is preserved and the numbers of x-rays in different energy bins can be counted if the PCCT has more than one energy threshold. Further, PCCTs are able to reject electronic noise, improve radiation dose efficiency, increase iodine signal, and improve spatial resolution (84). Currently two manufacturers offer a commercial PCCT (one full body unit and one portable head unit), and three other manufacturers have units undergoing clinical testing.
Figure 11.


Schematic diagram of a scintillation energy integrating detector (EID) (a) and an energy-resolving photon-counting CT (PCCT) (b). Sample images of the inner ear demonstrating the improved resolution of PCCT: EID-CT (c) versus PCCT (d). Arrows point to a stapes prosthetic. Sample images of calcified vessels in the lower extremities demonstrating the improved resolution of PCCT, which strongly decreases calcium blooming: EID-CT (e) versus PCCT (f). Reprinted, with permission, from reference (85) (c, d).
Some of the most promising applications of PCCT involve imaging of anatomy where exquisite spatial resolution adds clinical value. In non-contrast imaging of the temporal bones, studies in both cadaveric specimens and human subject have demonstrated improved visualization of important structures of the inner ear (85, 86). The use of tin filtration, while not novel to PCCT, resulted in total dose reductions of up to 85% for imaging of the temporal bone and sinuses using PCCT (87). In musculoskeletal imaging, lower image noise, higher bone signal-to-noise ratio, and sharper edges have been observed in human specimens (88, 89) and patients (89, 90) compared to CT using energy-integrating detectors. With PCCT, 125-micron spatial resolution can be obtained of large body parts such as the spine, shoulders, and pelvis (90). For small body parts such as the extremities, radiation dose is decreased by at least a factor of two due to acquisition of images without the use of post-patient attenuating filters (89). PCCT’s improved spatial resolution has also been shown to increase radiologist confidence in the evaluation of critical anatomic structures for large and small joints, as well as for multiple myeloma lesions (89–91). A review of the role of PCCT in musculoskeletal imaging can be found in (92).
PCCT also offers advantages in cardiovascular CT applications, particularly for small vessels (93–97). Calcium blooming is reduced due to the improved spatial resolution (98), allowing improved assessment of lumen stenosis in the presence of dense calcifications and stents (95, 99). Finally, the improved spatial resolution of PCCT has been shown to be of benefit in thoracic CT applications, improving the conspicuity of interstitial lung disease and small bronchi (100–102). Compared to conventional CT using energy-integrating detectors, PCCT significantly increased reader confidence for imaging findings of ground-glass opacity, reticulation, and mosaic attenuation (103). It has also been shown that patient radiation dose can be reduced which maintaining the sensitivity for detection of interstitial lung disease (104). In contrast-enhanced CT, radiation dose can similarly be decreased while improving the contrast-to noise ratio for pulmonary parenchyma, vessels, and metastases (105).
Artificial Intelligence
Another evolving technology impacting nearly every aspect of CT imaging is artificial intelligence (AI). AI can be used to automate aspects of the CT data acquisition process, such as patient positioning, by using data from optical and infrared overhead cameras with an AI algorithm to center the patient in the gantry and set start and end locations for scans of specific regions (106). AI algorithms can also determine the optimal post-trigger delay after contrast administration specific to an individual patient (107).
AI techniques can also generate images, such as in deep learning reconstruction (108–110), or modify images, such as in CT denoising (image-based noise reduction) (111, 112) (Figure 12). By training on low-dose CT images, convolutional neural networks can achieve dramatic noise suppression very quickly, as opposed to iterative reconstruction, where the most sophisticated models require too much reconstruction time to be practical in a clinical environment. Early evidence shows that, like iterative reconstruction, AI reconstruction and denoising maintain high-contrast spatial resolution but blur the edged low-contrast objects, allowing radiation dose reduction for many clinical applications.
Figure 12.


Schematic of a convolutional neural network used for CT image denoising (a) and sample input (b) and output (c) images.
Finally, techniques currently under investigation show great promise for further improving CT image quality or reducing the radiation dose from CT. For example, sparse-sampling CT uses AI to reconstruct images from undersampled data, which can reduce radiation dose, acquisition time, and streak artifacts (113, 114). Also, AI can be used to generate high resolution images from standard resolution acquisitions (115).
AI will also play a large role in automating clinical tasks – both routine and complex. This includes automation of time-consuming tasks such as segmentation and quantification. In coronary artery CT, for example, AI will play a role in improving artery segmentation and in quantitative assessment of properties such as coronary flow reserve. With the increasing use of multi-energy CT, AI algorithms to segment normal or pathological tissues will be combined with advanced, noise-reducing material decomposition analyses to automatically generate quantitative maps of material concentration. Classification tasks, such as the characterization of urinary stone type or coronary plaques will augment routine interpretation. This is specifically useful in triaging of CT studies based on emergent findings such as pulmonary embolism.
Another use of AI will be in the area of opportunistic screening, which utilizes the rich data available in CT that are not typically reported. Measurements of important risk predictors such as body composition analysis, coronary artery calcium, epicardial fat, liver fat, and vertebral bone mineral density will become routine parts of CT, providing rich data sources for personalized preventive health practices. Already AI methods to determine coronary artery calcium scores from non-gated thoracic CT exams have been reported (116). Finally, AI-driven imaging data, with or without clinical information, can provide prognostic information and risk-stratification, which can help with personalized and precision management of patients. For example, data on coronary artery plaque and stenosis can predict myocardial infarction (117).
Radiomics
The use of CT data with AI is ideal due to the well-defined physical meaning of CT values such as pixel brightness (ie, Hounsfield units). Reconstruction kernels are manufacturer and model-specific and play a major role in establishing the spatial resolution and noise characteristics of a CT image. This model-specific nature of CT images has always been a challenge for broadly applying quantitative CT methods (eg, using the same computational algorithm for images from different scanner models). The use of AI can overcome these differences and allow radiomics models to work across scanner models (118). Radiomics will continue to be used to find meaning in CT data – meaning that is not visually evident to human readers (119). Particularly with ultra-high spatial resolution CT and 1024 or 2048 matrix sizes, data set sizes will continue to increase, as will the number of pattern recognition tools (based on both traditional machine learning techniques as well as AI). Ultra-high resolution imaging can be accomplished clinically utilizing small detector sizes (currently 0.2 mm or 0.25 mm z-axis dimensions are available) and compact focal spots (25, 84, 120). The conversion of images into mineable data is one of the more exciting opportunities associated with PCCT, as its data are fundamentally more quantitative and reproducible in nature (121). Experts in big data and bioinformatics will continue to become more integrated into the clinical radiology team.
Conclusions
Since its invention in the 1970s, CT has undergone numerous technical developments and innovations that have established it as an indispensable tool in the practice of medicine. The development of CT and its impact on medicine are the result of the ingenuity of inventors, the investment and engineering skill of manufacturers, and the commitment of radiologists and scientists to develop new clinical applications. At the turn of the 21st century, a survey of physicians asked what was the most important medical invention or innovation of the 20th century (2); CT tied with MRI for first place. It is undeniable that the detailed view of the body that CT provides has changed medicine for the better (122, 123). This tremendous accomplishment reflects the remarkable ecosystem of inventors, engineers, physicians, and scientists who propelled CT and its clinical capabilities forward.
In the 1980s, as MRI became clinically available, it was lamented that “CT is dead.” Clearly, this was not the case! Each new generation of technology increases not only the speed and spatial resolution of CT but also enables new clinical applications and reductions in radiation and contrast dose. As Radiology celebrates its 100th anniversary, we look back at the lifesaving technologies and applications that have filled its pages. For over 50 years, CT technology has been an essential part of that journey. This and other articles have tried to summarize this rich history of CT (7, 124–129), a history that has seen CT move from two image slices per 5-minute head CT scan to imaging the entire body in a second or two. As CT continues to reinvent itself every decade or so, Radiology will remain at the forefront of sharing its story.
Summary Statement:
Since its invention in the 1970s, CT has undergone numerous technical developments and innovations that have established it as an indispensable tool in the practice of medicine.
Essentials:
Multiple CT scanner geometries, or generations, have existed since the introduction of CT in 1971.
Each new generation of technology increases the speed and spatial resolution of CT, enables new clinical applications, and decreases the required doses of radiation and iodinated contrast media.
Shorter gantry rotation times, multi-detector row, multi-sector reconstructions, and dual-source CT technologies have increased the quality and robustness of cardiac CT.
Radiation doses in CT are reduced using tube current modulation, lower tube potential, beam-shaping filters, beam collimation, and iterative reconstruction algorithms.
Photon-counting CT uses semiconductor detectors for ultra-high spatial resolution imaging and multi-energy binning from a single acquisition.
Funding:
No direct funding was used for this work. Dr. McCollough is the PI of a grant to Mayo Clinic from Siemens Healthcare.
Abbreviations:
- PCCT
photon-counting CT
- AI
artificial intelligence
Footnotes
Data Sharing Statement: No data were generated or analyzed during the study.
References
- 1.Eyler WR, ed. Radiology 1971;101(1):1–248.5000087 [Google Scholar]
- 2.Fuchs VR, Sox HC Jr., Physicians’ views of the relative importance of thirty medical innovations. Health Aff (Millwood) 2001;20(5):30–42. doi: 10.1377/hlthaff.20.5.30 [DOI] [PubMed] [Google Scholar]
- 3.The Nobel Prize in Physiology or Medicine 1979. NobelPrize.org: Nobel Prize Outreach AB 2023. https://www.nobelprize.org/prizes/medicine/1979/summary/. Accessed 2023 03/17. [Google Scholar]
- 4.Cormack AM. Representation of a Function by Its Line Integrals, with Some Radiological Applications. Journal of Applied Physics 1963;34(9):2722–2727. doi: 10.1063/1.1729798 [DOI] [Google Scholar]
- 5.Ambrose J Computerized transverse axial scanning (tomography). 2. Clinical application. Br J Radiol 1973;46(552):1023–1047. doi: 10.1259/0007-1285-46-552-1023 [DOI] [PubMed] [Google Scholar]
- 6.Hounsfield GN. Computerized transverse axial scanning (tomography). 1. Description of system. Br J Radiol 1973;46(552):1016–1022. doi: 10.1259/0007-1285-46-552-1016 [DOI] [PubMed] [Google Scholar]
- 7.Schulz RA, Stein JA, Pelc NJ. How CT happened: the early development of medical computed tomography. J Med Imaging (Bellingham) 2021;8(5):052110. doi: 10.1117/1.Jmi.8.5.052110 [DOI] [PMC free article] [PubMed] [Google Scholar]
- 8.Baker HL Jr. Historical vignette: introduction of computed tomography in North America. AJNR Am J Neuroradiol 1993;14(2):283–287. [PMC free article] [PubMed] [Google Scholar]
- 9.Lipton MJ, Higgins CB, Farmer D, Boyd DP. Cardiac imaging with a high-speed Cine-CT Scanner: preliminary results. Radiology 1984;152(3):579–582. doi: 10.1148/radiology.152.3.6540463 [DOI] [PubMed] [Google Scholar]
- 10.Crawford CR, King KF. Computed tomography scanning with simultaneous patient translation. Med Phys 1990;17(6):967–982. doi: 10.1118/1.596464 [DOI] [PubMed] [Google Scholar]
- 11.Kalender WA, Seissler W, Klotz E, Vock P. Spiral volumetric CT with single-breath-hold technique, continuous transport, and continuous scanner rotation. Radiology 1990;176(1):181–183. doi: 10.1148/radiology.176.1.2353088 [DOI] [PubMed] [Google Scholar]
- 12.Hui H, He HD, Fox S, Ackelsberg S, Strong G, Seidenschnur G. Multi-slice helical CT: principles, imaging characteristics, and performance. Proceedings of the 20th Annual International Conference of the IEEE Engineering in Medicine and Biology Society Vol20 Biomedical Engineering Towards the Year 2000 and Beyond (Cat No98CH36286)1998; p. 637–639 vol.632. [Google Scholar]
- 13.Klingenbeck-Regn K, Schaller S, Flohr T, Ohnesorge B, Kopp AF, Baum U. Subsecond multi-slice computed tomography: basics and applications. Eur J Radiol 1999;31(2):110–124. doi: 10.1016/s0720-048x(99)00086-8 [DOI] [PubMed] [Google Scholar]
- 14.McCollough CH, Zink FE. Performance evaluation of a multi-slice CT system. Med Phys 1999;26(11):2223–2230. doi: 10.1118/1.598777 [DOI] [PubMed] [Google Scholar]
- 15.Taguchi K, Aradate H. Algorithm for image reconstruction in multi-slice helical CT. Med Phys 1998;25(4):550–561. doi: 10.1118/1.598230 [DOI] [PubMed] [Google Scholar]
- 16.Flohr T, Stierstorfer K, Raupach R, Ulzheimer S, Bruder H. Performance evaluation of a 64-slice CT system with z-flying focal spot. Rofo 2004;176(12):1803–1810. doi: 10.1055/s-2004-813717 [DOI] [PubMed] [Google Scholar]
- 17.Nikolaou K, Flohr T, Knez A, Rist C, Wintersperger B, Johnson T, Reiser MF, Becker CR. Advances in cardiac CT imaging: 64-slice scanner. Int J Cardiovasc Imaging 2004;20(6):535–540. doi: 10.1007/s10554-004-7015-1 [DOI] [PubMed] [Google Scholar]
- 18.Flohr TG, McCollough CH, Bruder H, Petersilka M, Gruber K, Suss C, Grasruck M, Stierstorfer K, Krauss B, Raupach R, Primak AN, Kuttner A, Achenbach S, Becker C, Kopp A, Ohnesorge BM. First performance evaluation of a dual-source CT (DSCT) system. Eur Radiol 2006;16(2):256–268. doi: 10.1007/s00330-005-2919-2 [DOI] [PubMed] [Google Scholar]
- 19.Johnson TR, Krauss B, Sedlmair M, Grasruck M, Bruder H, Morhard D, Fink C, Weckbach S, Lenhard M, Schmidt B, Flohr T, Reiser MF, Becker CR. Material differentiation by dual energy CT: initial experience. Eur Radiol 2007;17(6):1510–1517. doi: 10.1007/s00330-006-0517-6 [DOI] [PubMed] [Google Scholar]
- 20.Primak AN, Fletcher JG, Vrtiska TJ, Dzyubak OP, Lieske JC, Jackson ME, Williams JC Jr, McCollough CH. Noninvasive differentiation of uric acid versus non-uric acid kidney stones using dual-energy CT. Acad Radiol 2007;14(12):1441–1447. doi: 10.1016/j.acra.2007.09.016 [DOI] [PMC free article] [PubMed] [Google Scholar]
- 21.Choi SI, George RT, Schuleri KH, Chun EJ, Lima JA, Lardo AC. Recent developments in wide-detector cardiac computed tomography. Int J Cardiovasc Imaging 2009;25 Suppl 1:23–29. doi: 10.1007/s10554-009-9443-4 [DOI] [PubMed] [Google Scholar]
- 22.Prakash P, Kalra MK, Kambadakone AK, Pien H, Hsieh J, Blake MA, Sahani DV. Reducing abdominal CT radiation dose with adaptive statistical iterative reconstruction technique. Invest Radiol 2010;45(4):202–210. doi: 10.1097/RLI.ob013e3181dzfeec [DOI] [PubMed] [Google Scholar]
- 23.Silva AC, Lawder HJ, Hara A, Kujak J, Pavlicek W. Innovations in CT dose reduction strategy: application of the adaptive statistical iterative reconstruction algorithm. AJR Am J Roentgenol 2010;194(1):191–199. doi: 10.2214/ajr.09.2953 [DOI] [PubMed] [Google Scholar]
- 24.Higashigaito K, Euler A, Eberhard M, Flohr TG, Schmidt B, Alkadhi H. Contrast-Enhanced Abdominal CT with Clinical Photon-Counting Detector CT: Assessment of Image Quality and Comparison with Energy-Integrating Detector CT. Acad Radiol 2022;29(5):689–697. doi: 10.1016/j.acra.2021.06.018 [DOI] [PubMed] [Google Scholar]
- 25.Rajendran K, Petersilka M, Henning A, Shanblatt ER, Schmidt B, Flohr TG, Ferrero A, Baffour F, Diehn FE, Yu L, Rajiah P, Fletcher JG, Leng S, McCollough CH. First Clinical Photon-counting Detector CT System: Technical Evaluation. Radiology 2022;303(1):130–138. doi: 10.1148/radiol.212579 [DOI] [PMC free article] [PubMed] [Google Scholar]
- 26.Friedland GW. Allan Macleod Cormack, MSc. Radiology 1998;209(1):290–291. doi: 10.1148/radiology.209.1.290 [DOI] [Google Scholar]
- 27.Cormack AM. Representation of a Function by Its Line Integrals, with Some Radiological Applications. II. Journal of Applied Physics 1964;35(10):2908–2913. doi: 10.1063/1.1713127 [DOI] [Google Scholar]
- 28.Bates S, Beckmann L, Thomas A, Waltham R. Godfrey Hounsfield: Intuitive Genius of CT.: British Institute of Radiology, 2012. [Google Scholar]
- 29.Wells PNT. Sir Godfrey Newbold Hounsfield KT CBE. 28 August 1919 – 12 August 2004. Biographical Memoirs of Fellows of the Royal Society 2005;51:221–235. doi: 10.1098/rsbm.2005.0014 [DOI] [Google Scholar]
- 30.Zannos S Godfrey Hounsfield and the Invention of Cat Scans: Mitchell Lane Publishers, 2002. [Google Scholar]
- 31.Beckmann EC. CT scanning the early days. Br J Radiol 2006;79(937):5–8. doi: 10.1259/bjr/29444122 [DOI] [PubMed] [Google Scholar]
- 32.Baker HL Jr. Computed tomograpy and neuroradiology: a fortunate primary union. AJR Am J Roentgenol 1976;127(1):101–110. doi: 10.2214/ajr.127.1.101 [DOI] [PubMed] [Google Scholar]
- 33.Ledley RS, Di Chiro G, Luessenhop AJ, Twigg HL. Computerized transaxial x-ray tomography of the human body. Science 1974;186(4160):207–212. doi: 10.1126/science.186.4160.207 [DOI] [PubMed] [Google Scholar]
- 34.Sheedy PF 2nd, Stephens DH, Hattery RR, Muhm JR, Hartman GW. Computed tomography of the body: initial clinical trial with the EMI prototype. AJR Am J Roentgenol 1976;127(1):23–51. doi: 10.2214/ajr.127.1.23 [DOI] [PubMed] [Google Scholar]
- 35.Bushberg JT, Seibert JA, Leidholdt EMJ, Boone JM. The Essential Physics of Medical Imaging 4 ed: Lippincott Williams & Wilkins, 2020. [Google Scholar]
- 36.Boyd DP, Lipton MJ. Cardiac computed tomography. Proc IEEE 1983;71(3):298–307. [Google Scholar]
- 37.Pan X, Siewerdsen J, La Riviere PJ, Kalender WA. Anniversary paper. Development of x-ray computed tomography: the role of medical physics and AAPM from the 1970s to present. Med Phys 2008;35(8):3728–3739. doi: 10.1118/1.2952653 [DOI] [PMC free article] [PubMed] [Google Scholar]
- 38.Chen MY, Shanbhag SM, Arai AE. Submillisievert median radiation dose for coronary angiography with a second-generation 320-detector row CT scanner in 107 consecutive patients. Radiology 2013;267(1):76–85. doi: 10.1148/radiol.13122621 [DOI] [PMC free article] [PubMed] [Google Scholar]
- 39.Tang X, Hsieh J, Seamans J, Dong F, Okerlund D. Cardiac imaging in diagnostic VCT using multi-sector data acquisition and image reconstruction: step-and-shoot scan vs. helical scan. Medical Imaging: SPIE, 2008. [Google Scholar]
- 40.Kim S, Chang Y, Ra JB. Cardiac Motion Correction for Helical CT Scan With an Ordinary Pitch. IEEE Trans Med Imaging 2018;37(7):1587–1596. doi: 10.1109/tmi.2018.2817594 [DOI] [PubMed] [Google Scholar]
- 41.Maggiore P, Huang AL, Anastasius M, Brown R, Boroditsky J, Ariel E, Ezekiel J, Merkur J, Blanke P, Leipsic J. A comparative assessment of the performance of a state-of-the art small footprint dedicated cardiovascular CT scanner. J Cardiovasc Comput Tomogr 2021;15(1):85–87. doi: 10.1016/j.jcct.2020.04.002 [DOI] [PubMed] [Google Scholar]
- 42.Gulati M, Levy PD, Mukherjee D, Amsterdam E, Bhatt DL, Birtcher KK, Blankstein R, Boyd J, Bullock-Palmer RP, Conejo T, Diercks DB, Gentile F, Greenwood JP, Hess EP, Hollenberg SM, Jaber WA, Jneid H, Joglar JA, Morrow DA, O’Connor RE, Ross MA, Shaw LJ. 2021 AHA/ACC/ASE/CHEST/SAEM/SCCT/SCMR Guideline for the Evaluation and Diagnosis of Chest Pain: A Report of the American College of Cardiology/American Heart Association Joint Committee on Clinical Practice Guidelines. Circulation 2021;144(22):e368–e454. doi: 10.1161/cir.0000000000001029 [DOI] [PubMed] [Google Scholar]
- 43.Vach M, Vogelhuber J, Weber M, Sprinkart AM, Pieper CC, Block W, Kuetting D, Attenberger UI, Luetkens JA. Feasibility of CT-derived myocardial strain measurement in patients with advanced cardiac valve disease. Sci Rep 2021;11(1):8793. doi: 10.1038/s41598-021-88294-5 [DOI] [PMC free article] [PubMed] [Google Scholar]
- 44.Goubergrits L, Vellguth K, Obermeier L, Schlief A, Tautz L, Bruening J, Lamecker H, Szengel A, Nemchyna O, Knosalla C, Kuehne T, Solowjowa N. CT-Based Analysis of Left Ventricular Hemodynamics Using Statistical Shape Modeling and Computational Fluid Dynamics. Front Cardiovasc Med 2022;9:901902. doi: 10.3389/fcvm.2022.901902 [DOI] [PMC free article] [PubMed] [Google Scholar]
- 45.Nørgaard BL, Fairbairn TA, Safian RD, Rabbat MG, Ko B, Jensen JM, Nieman K, Chinnaiyan KM, Sand NP, Matsuo H, Leipsic J, Raff G. Coronary CT Angiography-derived Fractional Flow Reserve Testing in Patients with Stable Coronary Artery Disease: Recommendations on Interpretation and Reporting. Radiol Cardiothorac Imaging 2019;1(5):e190050. doi: 10.1148/ryct.2019190050 [DOI] [PMC free article] [PubMed] [Google Scholar]
- 46.Prezzi D, Khan A, Goh V. Perfusion CT imaging of treatment response in oncology. Eur J Radiol 2015;84(12):2380–2385. doi: 10.1016/j.ejrad.2015.03.022 [DOI] [PubMed] [Google Scholar]
- 47.Brenner D, Elliston C, Hall E, Berdon W. Estimated risks of radiation-induced fatal cancer from pediatric CT. AJR Am J Roentgenol 2001;176(2):289–296. doi: 10.2214/ajr.176.2.1760289 [DOI] [PubMed] [Google Scholar]
- 48.McCollough CH, Bruesewitz MR, Kofler JM Jr. CT dose reduction and dose management tools: overview of available options. Radiographics 2006;26(2):503–512. doi: 10.1148/rg.262055138 [DOI] [PubMed] [Google Scholar]
- 49.Yu L, Bruesewitz MR, Thomas KB, Fletcher JG, Kofler JM, McCollough CH. Optimal tube potential for radiation dose reduction in pediatric CT: principles, clinical implementations, and pitfalls. Radiographics 2011;31(3):835–848. doi: 10.1148/rg.313105079 [DOI] [PubMed] [Google Scholar]
- 50.Yu L, Li H, Fletcher JG, McCollough CH. Automatic selection of tube potential for radiation dose reduction in CT: a general strategy. Med Phys 2010;37(1):234–243. doi: 10.1118/1.3264614 [DOI] [PubMed] [Google Scholar]
- 51.Yu L, Fletcher JG, Grant KL, Carter RE, Hough DM, Barlow JM, Vrtiska TJ, Williamson EE, Young PM, Goss BC, Shiung M, Leng S, Raupach R, Schmidt B, Flohr T, McCollough CH. Automatic selection of tube potential for radiation dose reduction in vascular and contrast-enhanced abdominopelvic CT. AJR Am J Roentgenol 2013;201(2):W297–306. doi: 10.2214/AJR.12.9610 [DOI] [PubMed] [Google Scholar]
- 52.Becker CR, Ohnesorge BM, Schoepf UJ, Reiser MF. Current development of cardiac imaging with multidetector-row CT. Eur J Radiol 2000;36(2):97–103. [DOI] [PubMed] [Google Scholar]
- 53.Carr JJ, Crouse JR 3rd, Goff DC Jr, D’Agostino RB Jr, Peterson NP, Burke GL. Evaluation of subsecond gated helical CT for quantification of coronary artery calcium and comparison with electron beam CT. AJR Am J Roentgenol 2000;174(4):915–921. doi: 10.2214/ajr.174.4.1740915 [DOI] [PubMed] [Google Scholar]
- 54.Hausleiter J, Meyer T, Hermann F, Hadamitzky M, Krebs M, Gerber TC, McCollough C, Martinoff S, Kastrati A, Schomig A, Achenbach S. Estimated radiation dose associated with cardiac CT angiography. JAMA 2009;301(5):500–507. doi: 10.1001/jama.2009.54 [DOI] [PubMed] [Google Scholar]
- 55.Hunold P, Vogt FM, Schmermund A, Debatin JF, Kerkhoff G, Budde T, Erbel R, Ewen K, Barkhausen J. Radiation exposure during cardiac CT: effective doses at multi-detector row CT and electron-beam CT. Radiology 2003;226(1):145–152. doi: 10.1148/radiol.2261011365 [DOI] [PubMed] [Google Scholar]
- 56.Morin RL, Gerber TC, McCollough CH. Radiation dose in computed tomography of the heart. Circulation 2003;107(6):917–922. [DOI] [PubMed] [Google Scholar]
- 57.Einstein AJ, Elliston CD, Arai AE, Chen MY, Mather R, Pearson GD, Delapaz RL, Nickoloff E, Dutta A, Brenner DJ. Radiation dose from single-heartbeat coronary CT angiography performed with a 320-detector row volume scanner. Radiology 2010;254(3):698–706. doi: 10.1148/radiol.09090779 [DOI] [PMC free article] [PubMed] [Google Scholar]
- 58.Flohr TG, Leng S, Yu L, Aiimendinger T, Bruder H, Petersilka M, Eusemann CD, Stierstorfer K, Schmidt B, McCollough CH. Dual-source spiral CT with pitch up to 3.2 and 75 ms temporal resolution: image reconstruction and assessment of image quality. Med Phys 2009;36(12):5641–5653. doi: 10.1118/1.3259739 [DOI] [PubMed] [Google Scholar]
- 59.Fletcher JG, Yu L, Li Z, Manduca A, Blezek DJ, Hough DM, Venkatesh SK, Brickner GC, Cernigliaro JC, Hara AK, Fidler JL, Lake DS, Shiung M, Lewis D, Leng S, Augustine KE, Carter RE, Holmes DR 3rd, McCollough CH. Observer Performance in the Detection and Classification of Malignant Hepatic Nodules and Masses with CT Image-Space Denoising and Iterative Reconstruction. Radiology 2015;276(2):465–478. doi: 10.1148/radiol.2015141991 [DOI] [PMC free article] [PubMed] [Google Scholar]
- 60.Yu L, Vrieze TJ, Leng S, Fletcher JG, McCollough CH. Technical Note: Measuring contrast- and noise-dependent spatial resolution of an iterative reconstruction method in CT using ensemble averaging. Med Phys 2015;42(5):2261–2267. doi: 10.1118/1.4916802 [DOI] [PMC free article] [PubMed] [Google Scholar]
- 61.Brink JA, Miller DL. U.S. National Diagnostic Reference Levels: Closing the Gap. Radiology 2015;277(1):3–6. doi: 10.1148/radiol.2015150971 [DOI] [PubMed] [Google Scholar]
- 62.Kanal KM, Butler PF, Sengupta D, Bhargavan-Chatfield M, Coombs LP, Morin RL. U.S. Diagnostic Reference Levels and Achievable Doses for 10 Adult CT Examinations. Radiology 2017;284(1):120–133. doi: 10.1148/radiol.2017161911 [DOI] [PubMed] [Google Scholar]
- 63.Strauss KJ. Developing patient-specific dose protocols for a CT scanner and exam using diagnostic reference levels. Pediatr Radiol 2014;44 Suppl 3:479–488. doi: 10.1007/s00247-014-3088-8 [DOI] [PubMed] [Google Scholar]
- 64.Pickhardt PJ, Lubner MG, Kim DH, Tang J, Ruma JA, del Rio AM, Chen GH. Abdominal CT with model-based iterative reconstruction (MBIR): initial results of a prospective trial comparing ultralow-dose with standard-dose imaging. AJR Am J Roentgenol 2012;199(6):1266–1274. doi: 10.2214/AJR.12.9382 [DOI] [PMC free article] [PubMed] [Google Scholar]
- 65.Fletcher JG, Yu L, Fidler JL, Levin DL, DeLone DR, Hough DM, Takahashi N, Venkatesh SK, Sykes AG, White D, Lindell RM, Kotsenas AL, Campeau NG, Lehman VT, Bartley AC, Leng S, Holmes DR 3rd, Toledano AY, Carter RE, McCollough CH. Estimation of Observer Performance for Reduced Radiation Dose Levels in CT: Eliminating Reduced Dose Levels That Are Too Low Is the First Step. Acad Radiol 2017;24(7):876–890. doi: 10.1016/j.acra.2016.12.017 [DOI] [PMC free article] [PubMed] [Google Scholar]
- 66.Solomon J, Marin D, Roy Choudhury K, Patel B, Samei E. Effect of Radiation Dose Reduction and Reconstruction Algorithm on Image Noise, Contrast, Resolution, and Detectability of Subtle Hypoattenuating Liver Lesions at Multidetector CT: Filtered Back Projection versus a Commercial Model-based Iterative Reconstruction Algorithm. Radiology 2017;284(3):777–787. doi: 10.1148/radiol.2017161736 [DOI] [PMC free article] [PubMed] [Google Scholar]
- 67.Bai W, Yu D, Zhu B, Yu X, Duan R, Li Y, Yu W, Hua W, Kou C. Diagnostic accuracy of computed tomography colonography in patients at high risk for colorectal cancer: a meta-analysis. Colorectal Dis 2020;22(11):1528–1537. doi: 10.1111/codi.15060 [DOI] [PubMed] [Google Scholar]
- 68.Eid M, De Cecco CN, Nance JW Jr, Caruso D, Albrecht MH, Spandorfer AJ, De Santis D, Varga-Szemes A, Schoepf UJ. Cinematic Rendering in CT: A Novel, Lifelike 3D Visualization Technique. AJR Am J Roentgenol 2017;209(2):370–379. doi: 10.2214/ajr.17.17850 [DOI] [PubMed] [Google Scholar]
- 69.Otton JM, Birbara NS, Hussain T, Greil G, Foley TA, Pather N. 3D printing from cardiovascular CT: a practical guide and review. Cardiovasc Diagn Ther 2017;7(5):507–526. doi: 10.21037/cdt.2017.01.12 [DOI] [PMC free article] [PubMed] [Google Scholar]
- 70.Goo HW, Park SJ, Yoo SJ. Advanced Medical Use of Three-Dimensional Imaging in Congenital Heart Disease: Augmented Reality, Mixed Reality, Virtual Reality, and Three-Dimensional Printing. Korean J Radiol 2020;21(2):133–145. doi: 10.3348/kjr.2019.0625 [DOI] [PMC free article] [PubMed] [Google Scholar]
- 71.Graser A, Johnson TR, Chandarana H, Macari M. Dual energy CT: preliminary observations and potential clinical applications in the abdomen. Eur Radiol 2009;19(1):13–23. doi: 10.1007/s00330-008-1122-7 [DOI] [PubMed] [Google Scholar]
- 72.McCollough CH, Leng S, Yu L, Fletcher JG. Dual- and Multi-Energy CT: Principles, Technical Approaches, and Clinical Applications. Radiology 2015;276(3):637–653. doi: 10.1148/radiol.2015142631 [DOI] [PMC free article] [PubMed] [Google Scholar]
- 73.Bongartz T, Glazebrook KN, Kavros SJ, Murthy NS, Merry SP, Franz WB 3rd, Michet CJ, Veetil BM, Davis JM 3rd, Mason TG 2nd, Warrington KJ, Ytterberg SR, Matteson EL, Crowson CS, Leng S, McCollough CH. Dual-energy CT for the diagnosis of gout: an accuracy and diagnostic yield study. Ann Rheum Dis 2015;74(6):1072–1077. doi: 10.1136/annrheumdis-2013-205095 [DOI] [PMC free article] [PubMed] [Google Scholar]
- 74.Glazebrook KN, Guimaraes LS, Murthy NS, Black DF, Bongartz T, Manek NJ, Leng S, Fletcher JG, McCollough CH. Identification of intraarticular and periarticular uric acid crystals with dual-energy CT: initial evaluation. Radiology 2011;261(2):516–524. doi: 10.1148/radiol.11102485 [DOI] [PubMed] [Google Scholar]
- 75.Ascenti G, Mileto A, Krauss B, Gaeta M, Blandino A, Scribano E, Settineri N, Mazziotti S. Distinguishing enhancing from nonenhancing renal masses with dual-source dual-energy CT: iodine quantification versus standard enhancement measurements. Eur Radiol 2013;23(8):2288–2295. doi: 10.1007/s00330-013-2811-4 [DOI] [PubMed] [Google Scholar]
- 76.Chae EJ, Seo JB, Jang YM, Krauss B, Lee CW, Lee HJ, Song KS. Dual-energy CT for assessment of the severity of acute pulmonary embolism: pulmonary perfusion defect score compared with CT angiographic obstruction score and right ventricular/left ventricular diameter ratio. AJR Am J Roentgenol 2010;194(3):604–610. doi: 10.2214/AJR.09.2681 [DOI] [PubMed] [Google Scholar]
- 77.Bamberg F, Dierks A, Nikolaou K, Reiser MF, Becker CR, Johnson TR. Metal artifact reduction by dual energy computed tomography using monoenergetic extrapolation. Eur Radiol 2011;21(7):1424–1429. doi: 10.1007/s00330-011-2062-1 [DOI] [PubMed] [Google Scholar]
- 78.Yu L, Leng S, McCollough CH. Dual-energy CT-based monochromatic imaging. AJR Am J Roentgenol 2012;199(5 Suppl):S9–S15. doi: 10.2214/AJR.12.9121 [DOI] [PubMed] [Google Scholar]
- 79.Pache G, Krauss B, Strohm P, Saueressig U, Blanke P, Bulla S, Schafer O, Helwig P, Kotter E, Langer M, Baumann T. Dual-energy CT virtual noncalcium technique: detecting posttraumatic bone marrow lesions--feasibility study. Radiology 2010;256(2):617–624. doi: 10.1148/radiol.10091230 [DOI] [PubMed] [Google Scholar]
- 80.McCollough CH, Boedeker K, Cody D, Duan X, Flohr T, Halliburton SS, Hsieh J, Layman RR, Pelc NJ. Principles and applications of multienergy CT: Report of AAPM Task Group 291. Med Phys 2020;47(7):e881–e912. doi: 10.1002/mp.14157 [DOI] [PubMed] [Google Scholar]
- 81.Pourmorteza A, Symons R, Sandfort V, Mallek M, Fuld MK, Henderson G, Jones EC, Malayeri AA, Folio LR, Bluemke DA. Abdominal Imaging with Contrast-enhanced Photon-counting CT: First Human Experience. Radiology 2016;279(1):239–245. doi: 10.1148/radiol.2016152601 [DOI] [PMC free article] [PubMed] [Google Scholar]
- 82.Willemink MJ, Persson M, Pourmorteza A, Pelc NJ, Fleischmann D. Photon-counting CT: Technical Principles and Clinical Prospects. Radiology 2018;289(2):293–312. doi: 10.1148/radiol.2018172656 [DOI] [PubMed] [Google Scholar]
- 83.Yu Z, Leng S, Jorgensen SM, Li Z, Gutjahr R, Chen B, Halaweish AF, Kappler S, Yu L, Ritman EL, McCollough CH. Evaluation of conventional imaging performance in a research whole-body CT system with a photon-counting detector array. Phys Med Biol 2016;61(4):1572–1595. doi: 10.1088/0031-9155/61/4/1572 [DOI] [PMC free article] [PubMed] [Google Scholar]
- 84.Leng S, Yu Z, Halaweish A, Kappler S, Hahn K, Henning A, Li Z, Lane J, Levin DL, Jorgensen S, Ritman E, McCollough C. Dose-efficient ultrahigh-resolution scan mode using a photon counting detector computed tomography system. J Med Imaging (Bellingham) 2016;3(4):043504. doi: 10.1117/1.JMI.3.4.043504 [DOI] [PMC free article] [PubMed] [Google Scholar]
- 85.Benson JC, Rajendran K, Lane JI, Diehn FE, Weber NM, Thorne JE, Larson NB, Fletcher JG, McCollough CH, Leng S. A New Frontier in Temporal Bone Imaging: Photon-Counting Detector CT Demonstrates Superior Visualization of Critical Anatomic Structures at Reduced Radiation Dose. AJNR Am J Neuroradiol 2022;43(4):579–584. doi: 10.3174/ajnr.A7452 [DOI] [PMC free article] [PubMed] [Google Scholar]
- 86.Zhou W, Lane JI, Carlson ML, Bruesewitz MR, Witte RJ, Koeller KK, Eckel LJ, Carter RE, McCollough CH, Leng S. Comparison of a Photon-Counting-Detector CT with an Energy-Integrating-Detector CT for Temporal Bone Imaging: A Cadaveric Study. AJNR Am J Neuroradiol 2018;39(9):1733–1738. doi: 10.3174/ajnr.A5768 [DOI] [PMC free article] [PubMed] [Google Scholar]
- 87.Rajendran K, Voss BA, Zhou W, Tao S, DeLone DR, Lane JI, Weaver JM, Carlson ML, Fletcher JG, McCollough CH, Leng S. Dose Reduction for Sinus and Temporal Bone Imaging Using Photon-Counting Detector CT With an Additional Tin Filter. Invest Radiol 2020;55(2):91–100. doi: 10.1097/rli.0000000000000614 [DOI] [PMC free article] [PubMed] [Google Scholar]
- 88.Klintström B, Henriksson L, Moreno R, Malusek A, Smedby Ö, Woisetschläger M, Klintström E. Photon-counting detector CT and energy-integrating detector CT for trabecular bone microstructure analysis of cubic specimens from human radius. Eur Radiol Exp 2022;6(1):31. doi: 10.1186/s41747-022-00286-w [DOI] [PMC free article] [PubMed] [Google Scholar]
- 89.Rajendran K, Baffour F, Powell G, Glazebrook K, Thorne J, Larson N, Leng S, McCollough C, Fletcher J. Improved visualization of the wrist at lower radiation dose with photon-counting-detector CT. Skeletal Radiol 2023;52(1):23–29. doi: 10.1007/s00256-022-04117-2 [DOI] [PubMed] [Google Scholar]
- 90.Baffour FI, Rajendran K, Glazebrook KN, Thorne JE, Larson NB, Leng S, McCollough CH, Fletcher JG. Ultra-high-resolution imaging of the shoulder and pelvis using photon-counting-detector CT: a feasibility study in patients. Eur Radiol 2022;32(10):7079–7086. doi: 10.1007/s00330-022-08925-x [DOI] [PMC free article] [PubMed] [Google Scholar]
- 91.Baffour FI, Huber NR, Ferrero A, Rajendran K, Glazebrook KN, Larson NB, Kumar S, Cook JM, Leng S, Shanblatt ER, McCollough CH, Fletcher JG. Photon-counting Detector CT with Deep Learning Noise Reduction to Detect Multiple Myeloma. Radiology 2023;306(1):229–236. doi: 10.1148/radiol.220311 [DOI] [PMC free article] [PubMed] [Google Scholar]
- 92.Baffour FI, Glazebrook KN, Ferrero A, Leng S, McCollough CH, Fletcher JG, Rajendran K. Photon-Counting Detector CT for Musculoskeletal Imaging: A Clinical Perspective. AJR Am J Roentgenol 2023:1–10. doi: 10.2214/ajr.22.28418 [DOI] [PubMed] [Google Scholar]
- 93.Mergen V, Sartoretti T, Baer-Beck M, Schmidt B, Petersilka M, Wildberger JE, Euler A, Eberhard M, Alkadhi H. Ultra-High-Resolution Coronary CT Angiography With Photon-Counting Detector CT: Feasibility and Image Characterization. Invest Radiol 2022;57(12):780–788. doi: 10.1097/rli.0000000000000897 [DOI] [PMC free article] [PubMed] [Google Scholar]
- 94.Sandfort V, Persson M, Pourmorteza A, Noël PB, Fleischmann D, Willemink MJ. Spectral photon-counting CT in cardiovascular imaging. J Cardiovasc Comput Tomogr 2021;15(3):218–225. doi: 10.1016/j.jcct.2020.12.005 [DOI] [PubMed] [Google Scholar]
- 95.Si-Mohamed SA, Boccalini S, Lacombe H, Diaw A, Varasteh M, Rodesch PA, Dessouky R, Villien M, Tatard-Leitman V, Bochaton T, Coulon P, Yagil Y, Lahoud E, Erhard K, Riche B, Bonnefoy E, Rioufol G, Finet G, Bergerot C, Boussel L, Greffier J, Douek PC. Coronary CT Angiography with Photon-counting CT: First-In-Human Results. Radiology 2022;303(2):303–313. doi: 10.1148/radiol.211780 [DOI] [PubMed] [Google Scholar]
- 96.Symons R, Reich DS, Bagheri M, Cork TE, Krauss B, Ulzheimer S, Kappler S, Bluemke DA, Pourmorteza A. Photon-Counting Computed Tomography for Vascular Imaging of the Head and Neck: First In Vivo Human Results. Invest Radiol 2018;53(3):135–142. doi: 10.1097/rli.0000000000000418 [DOI] [PMC free article] [PubMed] [Google Scholar]
- 97.Wildberger JE, Alkadhi H. New Horizons in Vascular Imaging With Photon-Counting Detector CT. Invest Radiol 2023. doi: 10.1097/rli.0000000000000957 [DOI] [PubMed] [Google Scholar]
- 98.Marsh JF Jr, VanMeter PD, Rajendran K, Leng S, McCollough CH. Ex vivo coronary calcium volume quantification using a high-spatial-resolution clinical photon-counting-detector computed tomography. J Med Imaging (Bellingham) 2023;10(4):043501. doi: 10.1117/1.Jmi.10.4.043501 [DOI] [PMC free article] [PubMed] [Google Scholar]
- 99.Symons R, De Bruecker Y, Roosen J, Van Camp L, Cork TE, Kappler S, Ulzheimer S, Sandfort V, Bluemke DA, Pourmorteza A. Quarter-millimeter spectral coronary stent imaging with photon-counting CT: Initial experience. J Cardiovasc Comput Tomogr 2018;12(6):509–515. doi: 10.1016/j.jcct.2018.10.008 [DOI] [PubMed] [Google Scholar]
- 100.Bartlett DJ, Koo CW, Bartholmai BJ, Rajendran K, Weaver JM, Halaweish AF, Leng S, McCollough CH, Fletcher JG. High-Resolution Chest Computed Tomography Imaging of the Lungs: Impact of 1024 Matrix Reconstruction and Photon-Counting Detector Computed Tomography. Invest Radiol 2019;54(3):129–137. doi: 10.1097/rli.0000000000000524 [DOI] [PMC free article] [PubMed] [Google Scholar]
- 101.Si-Mohamed SA, Miailhes J, Rodesch PA, Boccalini S, Lacombe H, Leitman V, Cottin V, Boussel L, Douek P. Spectral Photon-Counting CT Technology in Chest Imaging. J Clin Med 2021;10(24). doi: 10.3390/jcm10245757 [DOI] [PMC free article] [PubMed] [Google Scholar]
- 102.Symons R, Pourmorteza A, Sandfort V, Ahlman MA, Cropper T, Mallek M, Kappler S, Ulzheimer S, Mahesh M, Jones EC, Malayeri AA, Folio LR, Bluemke DA. Feasibility of Dose-reduced Chest CT with Photon-counting Detectors: Initial Results in Humans. Radiology 2017;285(3):980–989. doi: 10.1148/radiol.2017162587 [DOI] [PMC free article] [PubMed] [Google Scholar]
- 103.Inoue A, Johnson TF, White D, Cox CW, Hartman TE, Thorne JE, Shanblatt ER, Johnson MP, Carter RE, Lee YS, Rajendran K, Leng S, McCollough CH, Fletcher JG. Estimating the Clinical Impact of Photon-Counting-Detector CT in Diagnosing Usual Interstitial Pneumonia. Invest Radiol 2022;57(11):734–741. doi: 10.1097/rli.0000000000000888 [DOI] [PubMed] [Google Scholar]
- 104.Jungblut L, Euler A, von Spiczak J, Sartoretti T, Mergen V, Englmaier V, Landsmann A, Mihai CM, Distler O, Alkadhi H, Frauenfelder T, Martini K. Potential of Photon-Counting Detector CT for Radiation Dose Reduction for the Assessment of Interstitial Lung Disease in Patients With Systemic Sclerosis. Invest Radiol 2022;57(12):773–779. doi: 10.1097/rli.0000000000000895 [DOI] [PMC free article] [PubMed] [Google Scholar]
- 105.Hagen F, Walder L, Fritz J, Gutjahr R, Schmidt B, Faby S, Bamberg F, Schoenberg S, Nikolaou K, Horger M. Image Quality and Radiation Dose of Contrast-Enhanced Chest-CT Acquired on a Clinical Photon-Counting Detector CT vs. Second-Generation Dual-Source CT in an Oncologic Cohort: Preliminary Results. Tomography 2022;8(3):1466–1476. doi: 10.3390/tomography8030119 [DOI] [PMC free article] [PubMed] [Google Scholar]
- 106.Saltybaeva N, Schmidt B, Wimmer A, Flohr T, Alkadhi H. Precise and Automatic Patient Positioning in Computed Tomography: Avatar Modeling of the Patient Surface Using a 3-Dimensional Camera. Invest Radiol 2018;53(11):641–646. doi: 10.1097/rli.0000000000000482 [DOI] [PubMed] [Google Scholar]
- 107.Korporaal JG, Mahnken AH, Ferda J, Hausleiter J, Baxa J, Hadamitzky M, Flohr TG, Schmidt BT. Quantitative evaluation of the performance of a new test bolus-based computed tomographic angiography contrast-enhancement-prediction algorithm. Invest Radiol 2015;50(1):1–8. doi: 10.1097/rli.0000000000000088 [DOI] [PubMed] [Google Scholar]
- 108.Akagi M, Nakamura Y, Higaki T, Narita K, Honda Y, Zhou J, Yu Z, Akino N, Awai K. Deep learning reconstruction improves image quality of abdominal ultra-high-resolution CT. Eur Radiol 2019;29(11):6163–6171. doi: 10.1007/s00330-019-06170-3 [DOI] [PubMed] [Google Scholar]
- 109.Koetzier LR, Mastrodicasa D, Szczykutowicz TP, van der Werf NR, Wang AS, Sandfort V, van der Molen AJ, Fleischmann D, Willemink MJ. Deep Learning Image Reconstruction for CT: Technical Principles and Clinical Prospects. Radiology 2023;306(3):e221257. doi: 10.1148/radiol.221257 [DOI] [PMC free article] [PubMed] [Google Scholar]
- 110.Solomon J, Lyu P, Marin D, Samei E. Noise and spatial resolution properties of a commercially available deep learning-based CT reconstruction algorithm. Med Phys 2020;47(9):3961–3971. doi: 10.1002/mp.14319 [DOI] [PubMed] [Google Scholar]
- 111.Brendlin AS, Plajer D, Chaika M, Wrazidlo R, Estler A, Tsiflikas I, Artzner CP, Afat S, Bongers MN. AI Denoising Significantly Improves Image Quality in Whole-Body Low-Dose Computed Tomography Staging. Diagnostics (Basel) 2022;12(1). doi: 10.3390/diagnostics12010225 [DOI] [PMC free article] [PubMed] [Google Scholar]
- 112.Brendlin AS, Schmid U, Plajer D, Chaika M, Mader M, Wrazidlo R, Männlin S, Spogis J, Estler A, Esser M, Schäfer J, Afat S, Tsiflikas I. AI Denoising Improves Image Quality and Radiological Workflows in Pediatric Ultra-Low-Dose Thorax Computed Tomography Scans. Tomography 2022;8(4):1678–1689. doi: 10.3390/tomography8040140 [DOI] [PMC free article] [PubMed] [Google Scholar]
- 113.Dong J, Fu J, He Z. A deep learning reconstruction framework for X-ray computed tomography with incomplete data. PLoS One 2019;14(11):e0224426. doi: 10.1371/journal.pone.0224426 [DOI] [PMC free article] [PubMed] [Google Scholar]
- 114.Liang K, Zhang L, Yang H, Yang Y, Chen Z, Xing Y. Metal artifact reduction for practical dental computed tomography by improving interpolation-based reconstruction with deep learning. Med Phys 2019;46(12):e823–e834. doi: 10.1002/mp.13644 [DOI] [PubMed] [Google Scholar]
- 115.Umehara K, Ota J, Ishida T. Application of Super-Resolution Convolutional Neural Network for Enhancing Image Resolution in Chest CT. J Digit Imaging 2018;31(4):441–450. doi: 10.1007/s10278-017-0033-z [DOI] [PMC free article] [PubMed] [Google Scholar]
- 116.van Assen M, Martin SS, Varga-Szemes A, Rapaka S, Cimen S, Sharma P, Sahbaee P, De Cecco CN, Vliegenthart R, Leonard TJ, Burt JR, Schoepf UJ. Automatic coronary calcium scoring in chest CT using a deep neural network in direct comparison with non-contrast cardiac CT: A validation study. Eur J Radiol 2021;134:109428. doi: 10.1016/j.ejrad.2020.109428 [DOI] [PubMed] [Google Scholar]
- 117.Lin A, Manral N, McElhinney P, Killekar A, Matsumoto H, Kwiecinski J, Pieszko K, Razipour A, Grodecki K, Park C, Otaki Y, Doris M, Kwan AC, Han D, Kuronuma K, Flores Tomasino G, Tzolos E, Shanbhag A, Goeller M, Marwan M, Gransar H, Tamarappoo BK, Cadet S, Achenbach S, Nicholls SJ, Wong DT, Berman DS, Dweck M, Newby DE, Williams MC, Slomka PJ, Dey D. Deep learning-enabled coronary CT angiography for plaque and stenosis quantification and cardiac risk prediction: an international multicentre study. Lancet Digit Health 2022;4(4):e256–e265. doi: 10.1016/s2589-7500(22)00022-x [DOI] [PMC free article] [PubMed] [Google Scholar]
- 118.Choe J, Lee SM, Do KH, Lee G, Lee JG, Lee SM, Seo JB. Deep Learning-based Image Conversion of CT Reconstruction Kernels Improves Radiomics Reproducibility for Pulmonary Nodules or Masses. Radiology 2019;292(2):365–373. doi: 10.1148/radiol.2019181960 [DOI] [PubMed] [Google Scholar]
- 119.Gillies RJ, Kinahan PE, Hricak H. Radiomics: Images Are More than Pictures, They Are Data. Radiology 2016;278(2):563–577. doi: 10.1148/radiol.2015151169 [DOI] [PMC free article] [PubMed] [Google Scholar]
- 120.Takagi H, Tanaka R, Nagata K, Ninomiya R, Arakita K, Schuijf JD, Yoshioka K. Diagnostic performance of coronary CT angiography with ultra-high-resolution CT: Comparison with invasive coronary angiography. Eur J Radiol 2018;101:30–37. doi: 10.1016/j.ejrad.2018.01.030 [DOI] [PubMed] [Google Scholar]
- 121.Symons R, Cork TE, Sahbaee P, Fuld MK, Kappler S, Folio LR, Bluemke DA, Pourmorteza A. Low-dose lung cancer screening with photon-counting CT: a feasibility study. Phys Med Biol 2017;62(1):202–213. doi: 10.1088/1361-6560/62/1/202 [DOI] [PMC free article] [PubMed] [Google Scholar]
- 122.Pandharipande PV, Alabre CI, Coy DL, Zaheer A, Miller CM, Herring MS, Tramontano AC, Dowling EC, Eisenberg JD, Ashar BH, Halpern EF, Donelan K, Gazelle GS. Changes in Physician Decision Making after CT: A Prospective Multicenter Study in Primary Care Settings. Radiology 2016;281(3):835–846. doi: 10.1148/radiol.2016152887 [DOI] [PubMed] [Google Scholar]
- 123.Pandharipande PV, Reisner AT, Binder WD, Zaheer A, Gunn ML, Linnau KF, Miller CM, Avery LL, Herring MS, Tramontano AC, Dowling EC, Abujudeh HH, Eisenberg JD, Halpern EF, Donelan K, Gazelle GS. CT in the Emergency Department: A Real-Time Study of Changes in Physician Decision Making. Radiology 2016;278(3):812–821. doi: 10.1148/radiol.2015150473 [DOI] [PubMed] [Google Scholar]
- 124.Boone JM, McCollough C. Computed tomography turns 50. Physics Today 2021;74(9):34. doi: 10.1063/PT.3.4834 [DOI] [Google Scholar]
- 125.Dillon WP. 50th anniversary of computed tomography: past and future applications in clinical neuroscience. J Med Imaging (Bellingham) 2021;8(5):052112. doi: 10.1117/1.Jmi.8.5.052112 [DOI] [PMC free article] [PubMed] [Google Scholar]
- 126.Fahrig R, Jaffray DA, Sechopoulos I, Webster Stayman J. Flat-panel conebeam CT in the clinic: history and current state. J Med Imaging (Bellingham) 2021;8(5):052115. doi: 10.1117/1.Jmi.8.5.052115 [DOI] [PMC free article] [PubMed] [Google Scholar]
- 127.Howell JD. The CT Scan after 50 years - Continuity and Change. N Engl J Med 2021;385(2):104–105. doi: 10.1056/NEJMp2033374 [DOI] [PubMed] [Google Scholar]
- 128.Hsieh J, Flohr T. Computed tomography recent history and future perspectives. J Med Imaging (Bellingham) 2021;8(5):052109. doi: 10.1117/1.Jmi.8.5.052109 [DOI] [PMC free article] [PubMed] [Google Scholar]
- 129.La Riviere PJ, Crawford CR. From EMI to AI: a brief history of commercial CT reconstruction algorithms. J Med Imaging (Bellingham) 2021;8(5):052111. doi: 10.1117/1.Jmi.8.5.052111 [DOI] [PMC free article] [PubMed] [Google Scholar]