

Summary
Diffuse intrinsic pontine glioma (DIPG) is an aggressive brain stem tumor and the leading cause of pediatric cancer-related death. To date, these tumors remain incurable, underscoring the need for efficacious therapies. In this study, we demonstrate that the immune checkpoint TIM-3 (HAVCR2) is highly expressed in both tumor cells and microenvironmental cells, mainly microglia and macrophages, in DIPG. We show that inhibition of TIM-3 in syngeneic models of DIPG prolongs survival and produces long-term survivors free of disease that harbor immune memory. This antitumor effect is driven by the direct effect of TIM-3 inhibition in tumor cells, the coordinated action of several immune cell populations, and the secretion of chemokines/cytokines that create a proinflammatory tumor microenvironment favoring a potent antitumor immune response. This work uncovers TIM-3 as a bona fide target in DIPG and supports its clinical translation.
Keywords: DMGs, DIPG, TIM-3, immunotherapy, microglia, macrophages, diffuse midline glioma, pediatric brain tumor, tumor microenvironment, immune checkpoint
Graphical abstract
Highlights
-
•
TIM-3 expression is upregulated in the TME and tumor cells of DIPG patients
-
•
TIM-3 plays a critical role in DIPG tumor cells proliferation and tumorigenesis
-
•
TIM-3 blockade enhances microglia and CD8+ T cell function
-
•
TIM-3 blockade induces a durable memory response, evidenced by tumor eradication
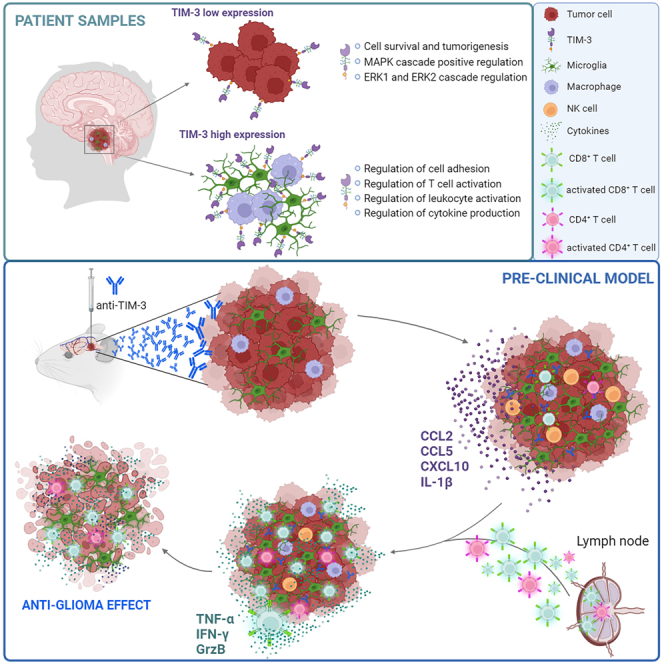
Ausejo-Mauleon et al. demonstrate that TIM-3 is a highly expressed molecule in DIPG tumor cells and immune microenvironment, and its blockade triggers a potent immune response due to the conversion of the DIPG tumor microenvironment to a proinflammatory phenotype through microglia and CD8+ T cell activation, promoting an anti-glioma response and durable immunological memory.
Introduction
Diffuse intrinsic pontine glioma (DIPG) is a type of diffuse midline glioma (DMG) that develops in the pons during childhood.1 DIPG prognosis is dismal, with over 90% of patients dying within two years of diagnosis and a median overall survival time of 9–12 months.2,3,4 The location of these tumors within the brainstem, together with the diffuse infiltrative nature of these tumors that results in involvement of the surrounding normal tissue, limits potential interventions such as surgery, making DIPG one of the most devastating and challenging pediatric cancers.
The standard of care treatment for DIPG is radiotherapy (RT), which is not curative but provides tumor stabilization and a temporary reduction in symptoms, extending the average survival time to approximately 3 months5,6 and underscoring the fact that DIPG is still an unmet clinical need. In recent years, due to the good results obtained in several solid tumors, immune checkpoint inhibitors (ICIs) have been evaluated for use in DIPG patients. Unfortunately, none of the classic ICIs have shown efficacy in this tumor,7 probably because the DIPG tumor microenvironment (TME) is nearly devoid of T cell infiltration and mainly comprises microglia/macrophages.8,9 This singular TME provides an opportunity to assess the value of non-classic immune checkpoint molecules, such as T cell immunoglobulin mucin-3 (TIM-3, HAVCR2).
TIM-3, a member of the T cell immunoglobulin and mucin domain protein family, was originally identified on the surface of T helper 1 (Th1) cells as an immunosuppressive molecule.10 Subsequent studies have shown that TIM-3 is expressed on multiple immune cell types, including natural killer (NK) cells, monocytes, dendritic cells (DCs), and microglia, and it potently regulates not only adaptive immunity but also innate immunity.11,12,13,14,15,16 In fact, loss of TIM-3 prevents DCs from expressing a regulatory program and facilitates the maintenance of effector CD8+ T cells and stem cells, thus promoting antitumor immunity.15 Similarly, in monocytes and macrophages, TIM-3 acts as a negative regulator during innate immune responses.16 In microglia, activation of the TIM-3 signaling pathway promotes inflammatory factor production17,18 and might be a pivotal link between neuroinflammation and microglial polarization.17 In recent years, the expression of TIM-3 in tumor cells has been linked to potential roles in the proliferative and metastatic capacities of different cancers,19,20,21,22 including glioblastoma.23 The pleiotropic functions of this protein in multiple compartments of the immune TME and in tumor cells make TIM-3 an attractive target to be therapeutically exploited in DIPG.
In this study, we identified TIM-3 as an actionable target in DIPG tumors. Our data showed that TIM-3 blockade resulted in a significant antitumor effect accompanied by immune memory development in immunocompetent models of DIPG. These promising preclinical results open the door to the use of an anti-TIM-3 antibody in future clinical trials for this devastating disease.
Results
TIM-3 is highly expressed in the TME of DIPG patients
An in silico study of TIM-3 (HAVCR2) expression in DIPG patient samples uncovered high-relative expression levels of this immune checkpoint molecule in comparison with those of others such as CTLA-4, PD-1 (PDCD1), LAG-3, and TIGIT from three different cohorts (Figure 1A). We also observed that the expression of galectin-9 (LGASL9), one of the main TIM-3 ligands, was very high in the same samples (Figure S1A). In contrast, CEACAM-1 (another TIM-3 ligand) had almost undetectable expression. In a separate dataset from St. Jude, 93.5% of DIPG patients (n = 31) showed TIM-3 expression, which was greater than the percentage observed in other pediatric brain tumors (n = 350) or pediatric solid tumors (n = 2483) (Figure S1B). Interestingly, data from single-cell sequencing (n = 66 patients) of DIPG tumor cells (analyzed according to markers used to differentiate into 3 groups: astrocyte (AC)-like, oligodendrocyte (OC)-like, and oligodendrocyte precursor cell (OPC)-like)24,25 (Figure 1B) revealed that TIM-3 was expressed in all three populations, but the expression was slightly higher in OPC-like cells (Figure 1C). TIM-3 expression in OPC-like cells correlated with genes positively involved in the survival of tumor cells, with the most significant pathways being those related to the regulation of ion transport, IL-6 production, and response to IFN-γ. We also observed an enrichment in genes regulating the MAPK and ERK1/ERK2 cascades (Figure 1D). Collectively, these data suggest that TIM-3 expression may have important roles in DIPG tumor cell survival and tumorigenesis. To gain a deeper understanding of its expression within DIPG tumors we looked into the different cell compartments. We observed that the highest expression of this molecule was found within the immune compartment and in a subset of OPCs (Figure 1E). Regarding the immune compartment, TIM-3 expression was mainly restricted to microglia and macrophages and at higher levels than those observed in the tumor compartment (Figures 1F and 1G). Moreover, TIM-3 expression in microglia correlated with genes involved in the immune response (Figure 1H). However, the genes that significantly correlated with TIM-3 in both populations (tumor cells and microglia) were completely different. Venn diagram analysis showed that of the 465 genes that significantly correlated with TIM-3 in microglia and the 262 in tumor cells, only 6 were shared between the cell types (HAVCR2, CD84, ILAIR1, IFNLR1, PLA2G4E, and DAND; Figure S1C). Remarkably, we observed that TIM-3 is differentially expressed in tumors with the H3F3A mutation (H3.3K27M) compared to tumors that displayed the HIST1H3B mutation (H3.1K27M) or WT (Figure S1D). These data suggest that TIM-3 participates in different processes depending on the cell compartment in which it is expressed. TIM-3 protein expression was readily detected in DIPG samples (n = 9). We observed the expression of TIM-3 in CD68+ myeloid cells (mostly microglia and macrophages; 53.72%), CD3+ T cells (38.51%), and H3K27M+ tumor cells (43.89%) (Figures 1I and S1E). Importantly, TIM-3 is not expressed in healthy human brains (Figure S1F). Thus, we conclude that DIPG tumor cells and the surrounding microenvironment express TIM-3, supporting its potential for therapeutic targeting.
Figure 1.

Evaluation of TIM-3 (HAVCR2) expression in samples from DIPG patients
(A) Violin plots showing the relative mRNA expression of HAVCR2 (TIM-3), PDCD1 (PD-1), CTLA-4, LAG3, and TIGIT in DIPG patients (n = 113) from the PedcBioPortal (PNOC_PedBio_49 and PNOC003_PedBio_32) and Kids First Data Resource Portal (PNOC_32). The lower and upper hinges of the violin plots correspond to the first and third quartiles. After stat (middle): median, 50% quantile, as well as the kernel density estimates as the width.
(B) Two-dimensional representations of the OC-like versus AC-like (x axis) and OPC-like (y axis) scores for DIPG patients.
(C) Left panel, tSNE map of TIM-3 expression in OPC-like, AC-like and OC-like cells. Right panel, Violin plot of TIM-3 expression.
(D) Gene pathways enriched in the set of genes correlated with TIM-3 in OPC-like cells (tumor cells).
(E) Left panel, UMAP plot depicting the different cell populations found in scRNA-seq data for 66 DIPG patients. Right panel, Visualization of HAVCR2 gene expression density in UMAP.
(F) UMAP plot of TIM-3 expression in microglia and macrophages from scRNA-seq data.
(G) Violin plot of TIM-3 expression in microglia, macrophages, OC-like cells, AC-like cells, MES-like cells and OPC-like cells. (H) Gene pathways enriched in the set of genes correlated with TIM-3 in microglia. Data obtained from a previous patient’s scRNA-seq dataset (GSE18435725).
(I) Left panel, representative image from multiplex IF analyses with TIM-3, H3K27M (tumor cells), CD68 (macrophages and microglia) and CD3 (T cells) of DIPG tumor samples from a patient. Right panel, quantification of H3K27M+TIM-3+, H3K27M+TIM-3+, and H3K27M+TIM-3+ compared to total cells in 9 different DIPG patients. One-way ANOVA was performed in panels A and C. Bar graphs indicate the mean ± SEM. (ns, p > 0.05; ∗p < 0.05; ∗∗p < 0.01; ∗∗∗p < 0.001; ∗∗∗∗p < 0.0001). See also Figure S1.
TIM-3 plays critical roles in the survival and tumorigenicity of DIPG cells
We next investigated the importance of this molecule in tumor cells. Human (DIPG IV, DIPG I, Tp54, and Tp80) and murine (NP53 and XFM) DIPG cell lines showed robust TIM-3 protein expression (Figures 2A, S2A, and S2B). Interestingly, we observed that DIPG murine cell lines with H3.3K27M mutation displayed higher TIM-3 expression than H3.1K27M and H3WT (Figure S2C). Corroborating these results, TIM-3 co-expressed with the tumor cell marker nestin in an in vivo orthotopic murine DIPG model (Figure S2D). Additionally, Gal-9, but not CEACAM1 (Figures S2E and S2F), was expressed in both murine and human cell lines (Figure S2G) and in the murine orthotopic models (Figure S2H). This result agrees with the expression of these ligands in the PNOC patients’ data (Figure S1A).
Figure 2.

Analysis of the role of TIM-3 in the tumorigenesis of human and murine DIPG cell lines
(A) Western blot analysis of TIM-3 expression in DIPG human and murine cell lines, using GRB-2 as a housekeeping protein.
(B) Viability assay (MTS) of TP54 and DIPG007 cells 7 days after TIM-3-specific shRNA knockdown.
(C) Viability assay (MTS) of TP54 and DIPG007 cells 7 days after treatment with a human anti-TIM-3 antibody (provided by BMS, BMS-986258).
(D) Western blot analysis of TIM-3 expression in control guide NP53 and TIM-3KO (G2C1, G2C9, and G1C7) NP53 different cell lines.
(E) Clonogenicity assay with control guide NP53 cells versus three different TIM-3KO NP53 clones at 2 weeks.
(F) Evaluation of the proliferative capacity by a BrdU assay performed with TIM-3KO clones normalized to control guide cells (mean ± SEM) (G) Apoptosis analysis of TIM-3KO cells compared to control guide cells. Viable (Annexin V−7AAD−), early apoptosis (Annexin V+7AAD−), and late apoptosis (Annexin V+7AAD+).
(H) Viability assay (MTS) of NP53 control guide, G2C9 and G1C7 TIM-3KO cells 7 days after treatment with galectin-9 and CEACAM1 (TIM-3 main ligands).
(I) Kaplan-Meier survival curves of immunocompetent mice bearing control guide NP53 cells (n = 6), G2C9 TIM-3KO cells (n = 5, log rank; p = 0.0012), or G1C7 TIM-3KO cells (n = 5, log rank; p = 0.0012).
(J) Gene pathways enriched in the set of genes with differential expression between TIM-3+ and TIM-3KO cells. Results obtained from RNA-seq data.
(K) Heatmap of the differentially expressed genes between TIM-3+ and TIM-3KO cells related to the MAPK and PI3K-AKT pathways. Results were obtained from previous RNA-seq data.
(L) Western blot analysis of PTEN, MEK1, pMEK, ERK1/2, pERK1/2, and c-JUN expression in TIM-3+ and TIM-3KO murine DIPG cell lines. Standardized quantification against its own vinculin (housekeeping) and a Student’s t test is performed for TIM-3+ versus TIM-3KO statistical analysis.
(M) Kaplan-Meier survival curves of immunocompetent mice bearing HSJD-007 tumors and treated with an anti-human TIM-3 antibody (BMS-986258) (n = 9) or IgG1 (n = 9 log rank; p = 0.0001). Student’s t test (panel B, C), one-way ANOVA (panel E) and two-way ANOVA (panel F, H) were performed. Bar graphs indicate the mean ± SEM. (ns, p > 0.05; ∗p < 0.05; ∗∗p < 0.01; ∗∗∗p < 0.001; ∗∗∗∗p < 0.0001). See also Figures S2 and S3.
To unravel the functionality of TIM-3 in DIPG tumor cells, we next performed loss-of-function studies. Importantly, TIM-3 knockout (KO) was lethal in all human DIPG cell lines evaluated; therefore, we used a doxycycline-inducible shRNA (Figure S3A). Inducible knockdown of TIM-3 expression significantly reduced the viability of the TP54 (70% less) and HSJD-DIPG-007 (37% less) cell lines (Figure 2B). Importantly, the addition of an anti-TIM-3 human antibody (BMS-986258) also decreased the viability of these cells (Figure 2C). Interestingly, we obtained three viable murine DIPG cell lines lacking TIM-3 expression (G2C1, G2C9, and G1C7; Figure 2D). Clonogenicity experiments demonstrated that TIM-3KO clones harbored a diminished capability to form colonies compared to control guide cells (G2C1 (16.05%), G2C9 (12.62%), and G1C7 (11.62%) (Figure 2E). The TIM-3KO clones also displayed reduced metabolic activity that was heightened at lower confluence (Figure S3B). The lower metabolic rate was due to a marked decrease in the proliferative status (Figure 2F) and not to an increase in cell death after the loss of TIM-3 expression (Figure 2G). TIM-3KO cells also had a significantly lower migratory capacity than control cells (ranging from 41.85 to 61.02%; Figure S3C). To elucidate whether exogenous TIM-3 blockade had the same effect on cells as genetic ablation, we treated cells with an anti-TIM-3 antibody. Treatment with the anti-TIM-3 antibody only decreased viability in the control guide cells (Figure S3D), indicating that the TIM-3KO cells were unresponsive to the treatment. Moreover, the addition of CEACAM1 and galectin-9 ligands led to an increase in the proliferation only in the control guide cells (TIM-3+), while they had no effect on TIM-3KO cells (Figures S2E and S2H). Collectively, these findings revealed the direct importance of TIM-3 expression in the proliferation and survival of DIPG tumor cell lines in vitro. To elucidate the importance of TIM-3 expression in tumorigenicity in vivo, we implanted TIM-3KO cell lines into the pons of immunocompetent mice. All mice bearing parental cells (control guide) developed tumors, and they had a median overall survival time of 16 days. Interestingly, the overall median survival for mice bearing G2C9 (35 days or G1C7 (Undefined) TIM-3KO cells was significantly longer than that of control mice. Additionally, 40% (2/5 mice; G2C9 TIM-3KO) and 60% (3/5 mice; G1C7 TIM-3KO) survived 6 times longer than the median survival time of control mice. (Figure 2I). Confirming the slow growth rate of TIM-3KO cells, we observed tumors at day 100 (Figure 3F). Importantly, analyses of the immune infiltration in TIM-3KO tumors at days 7 and 14 after cell implantation showed no differences in any of the percentages of the indicated immune populations among the 3 groups (Figures S3G and S3H). These data indicate that TIM-3 plays an important role in DIPG tumorigenesis in vivo.
Figure 3.

Evaluation of the antitumor effect of TIM-3 blockade
(A and B) Schedule of survival experiments performed with murine DIPG cells. Cells were implanted on Day -3. On Day 0 (three days later), 25 μg of IgG2a or anti-TIM-3 was administered intraperitoneally (i.p.) in the systemic schedule (A) or intratumorally (i.t.) in the hybrid schedule (B). On Days 7 and 11 days after cell implantation, each of the antibodies (10 mg/kg) was administered intraperitoneally (i.p.).
(C) Kaplan-Meier survival curves of mice bearing NP53 (n = 10 per group, log rank; p = 0.0008) or XFM (n = 10 per group, log rank; p = 0.0102) DIPG cells systemically treated with IgG2a or anti-TIM-3 monoclonal antibodies.
(D) Kaplan-Meier survival curves of mice bearing NP53 (n = 12 per group, log rank; p = 0.0025) or XFM (n = 10 per group, log rank; p = 0.0008) cells treated with the hybrid schedule.
(E) Left panel, representative images of TIM-3 expression levels in the tumors of mice treated with IgG2a or anti-TIM-3. Middle panel, representative hematoxylin/eosin and Ki67 staining micrographs of NP53 tumors from mice given the indicated treatments. Right panel, quantification of Ki67+ cells in the tumors of mice treated with IgG2a (n = 3) or anti-TIM-3 (n = 5) (p < 0.0001). Student’s t test was performed. Bar graphs indicate the mean ± SEM. (ns, p > 0.05; ∗p < 0.05; ∗∗p < 0.01; ∗∗∗p < 0.001; ∗∗∗∗p < 0.0001).
(F) The long-term survivors in the anti-TIM-3-treated group from (B) were subjected to rechallenge with NP53 (n = 6) or XFM (n = 5) cells and compared with control naive mice (n = 6) (p = 0.0001 and 0.0002, for NP53 tumor- and XFM tumor-bearing mice, respectively).
(G) Representative hematoxylin/eosin staining images of NP53 or XFM tumors harvested from mice at the time of death (naive) or at the end of the experiment (long-term survivors).
(H) Left panel, representative images of PD-1 expression levels in NP53. Right panel, quantification of PD-1+ cells per mm2 of NP53 tumors.
(I) Kaplan-Meier survival curves of mice treated with an anti-PD-1 or IgG2A monoclonal antibody (n = 10, log rank; p = 0.71) following the schedule depicted in (B).
(J) Kaplan‒Meier survival curves of mice bearing CT-2A cells treated with an anti-TIM-3 or IgG2A monoclonal antibody (n = 10, log rank; p = 0.143) following the systemic schedule depicted in (A). See also Figures S4 and S5.
Next, we performed a transcriptomic evaluation of TIM-3+ and TIM-3KO (G2C9 and G1C7 TIM-3KO clones) cells. Interestingly, analyses showed that the PI3K-AKT and MAPK pathways were significantly enriched in TIM-3KO tumor cells compared with TIM-3+ tumor cells (Figure 2J and S3I). TIM-3 knockout caused downregulation of the Jak3, Myc, Fos, Cdk11b, and Cdkl3 genes involved in the MAPK signaling pathway (Figure 2K). We observed a significant decrease in the phosphorylation responsible for activating Map2k1 (MEK1) and Mapk3 (ERK1) (Figure 2L). We also detected the downregulation of the c-Jun protein, which is an important downstream protein in the MAPK signaling pathway (Figure 2K). We did not observe any differences in the PI3K-AKT pathway genes Rtkn2, Akt1, and total S6, or AKT phosphorylation (Thr308 and Ser473). However, activating phosphorylation of S6 was clearly diminished (Figure S3J). In addition, we detected upregulation of Pik3ca in TIM-3KO tumor cells (Figure 2K).
Finally, to evaluate the therapeutic potential of an anti-TIM-3 monoclonal antibody, the HSJD-DIPG-007 DIPG human cell line was implanted orthotopically in Rag2-γc- immunodeficient mice. Interestingly, treatment with a human anti-TIM-3-blocking antibody resulted in an increase in the median survival of treated mice (AbTIM-3 = 78 days; p < 0.0001) compared with that of control-treated mice (AbIgG1 = 63 days) (Figure 2M). These data demonstrate that TIM-3 plays critical roles in the tumorigenesis and survival of human DIPG cell lines.
TIM-3 blockade induces an anti-glioma effect in immunocompetent DIPG models and results in immune memory
Next, we evaluated the therapeutic value of TIM-3 blockade in an immunocompetent context. First, we assessed the expression profile of TIM-3 in the TME of an immunocompetent model of DIPG 10 days after cell implantation. In this model, TIM-3 was expressed in T cells (CD8+ and CD4+), regulatory T cells (Tregs, FOXP3+), macrophages (F4/80+), and microglia (TMEM119+) (Figure S4A). Similarly, TIM-3 was detected in all studied populations of the TME by flow cytometry (Figures S4B and S4C). Interestingly, although the number of CD8+ cells was nearly negligible in tumors, the majority of these CD8+ cells expressed TIM-3 (84.7%), followed by DCs (78.9%), microglia (68.9%) and macrophages (66.1%). TIM-3 expression was also predominant in Treg (63.1%), CD4 (60.8%), and monocyte (54.9%) populations. In addition, slightly below 50% of NK cells and granulocytes expressed TIM-3. Interestingly, the highest TIM-3 expression intensity was observed in DC, macrophage, microglia, and Treg populations (Figures S4B and S4C). In addition, we confirmed TIM-3 expression in one additional in utero electroporation (IUE) DMG model (PPK26) and in an isogenic orthotopic DMG model (24D-1: H3WT; 26C-7: H3.1K27M, and 26B-7 H3.3K27M) also develop by IUE model27). The expression of TIM-3 in these additional models further supports the notion that, indeed, its expression in DMGs is observed across different models. Interestingly, similarly to the TIM-3 pattern expression in patients, in the isogenic cell lines, we observed that orthotopic models with H3.3K27M mutation have a higher expression of TIM-3 than H3.1K27M and H3WT (Figure S4D).
In DIPG, blood-brain barrier (BBB) integrity is intact at diagnosis in many cases28,29; thus, alternative administration routes such as intratumoral injection,30 intraventricular administration,31 or convention-enhanced delivery32,33 have been extensively evaluated in clinical trials. Therefore, to maximize therapeutic efficacy, we evaluated two routes of administration: a systemic route (3 doses; Figure 3A) and a hybrid route with an initial intratumoral administration followed by two systemic administrations (Figure 3B). First, we analyzed the TIM-3 antibody biodistribution by SPECT scan after being injected either systemically or locally in the tumor. The systemic administration of 67Gallium-labeled TIM-3 antibody was mainly detected in the cervical lymph nodes for seven days starting 24 h upon treatment (Figure S4E). As expected, the intratumoral-administered antibody was readily detected in the brainstem declining over the course of a week (Figures S4F and S4G). Ex vivo measurement of the radioactivity in different tissues showed that the superficial cervical lymph nodes accumulated the maximum antibody concentration independently on the administration route (Figure S4H).
Next, we evaluated the therapeutic efficacy of each of the administration protocols. Of note, both schedules resulted in a significant therapeutic benefit. The systemic administration of an anti-TIM-3 antibody led to an increase in the median survival of mice bearing NP53 (AbIgG2a = 20 days vs. AbTIM-3 = 34 days; p = 0.0008) and XFM tumors (AbIgG2a = 15 days vs. AbTIM-3 = 33 days; p = 0.0102) and led to 20% and 33% long-term survivors, respectively (Figure 3C). The hybrid route regimen resulted in a significant increase in median survival (AbIgG2a = 18 days vs. AbTIM-3 = 47.5 days; p = 0.0025) and led to 50% long-term survivors in mice bearing NP53 tumors (Figure 3D). Treatment of mice bearing XFM tumors with the anti-TIM-3 antibody also led to an increase in median survival (AbIgG2a = 12 vs. AbTIM-3 = 32 days; p = 0.0008) and 50% long-term survivors (Figure 3D). No significant weight loss was observed during the duration of either treatment schedule (Figure S5A). Since the hybrid route showed the best therapeutic profile, we decided to continue with this schedule. We did not observe any significant differences between anti-TIM-3 and IgG2a-treated mice in the levels of alanine aminotransferase, aspartate aminotransferase, or alkaline phosphatase for monitoring hepatic injury or in albumin levels for monitoring hepatic function at day 3 or 14 after the first treatment (Figures S5B and S5C). These results suggest a good tolerability and safety profile at the concentration evaluated.
Analyses of brains in a separate experiment demonstrated that treatment with the anti-TIM-3-blocking antibody significantly reduced the expression levels of this molecule. Moreover, control mice presented clearly visible tumors in the pons with a high-proliferation index, while treated long-term survivors were free of disease (Figure 3E). Rechallenge experiments showed that while 100% of naive mice were not able to reject tumor cells in either model, in the anti-TIM-3-treated groups for both models, 100% of NP53 and 80% of XFM tumor model mice were long-term survivors, indicating the generation of immune memory in these anti-TIM-3-treated mice (Figure 3F). In agreement with these data, anatomopathological analyses of brains showed that long-term survivors from the anti-TIM-3-treated group were free of disease (Figure 3G). Next, to elucidate whether the antitumor effect was due to local or peripheral memory, we performed a rechallenge experiment using a drug that abrogates T cell trafficking (FTY720), confining these cells to the lymph nodes. Blood analyses verified the absence of circulating T cells, but other cells, such as NK cells, could be detected (Figure S5D). The rechallenge experiment resulted in 100% and 66% long-term survivors in the anti-TIM-3-treated NP53 and XFM tumor groups, respectively (Figures S5E and S5F), with these survivors being free of disease (Figure S5G). These data suggest that the immune memory response may be due to resident memory cells within the brain.
To rule out the possibility that other classic ICIs could also have efficacy in DIPG, we evaluated the therapeutic effect of PD-1 blockade in our model. First, we confirmed by IHC that PD-1 was expressed in our murine orthotopic model (Figure 3H) Treatment with anti-PD-1 (Figure 3B) did not result in any therapeutic benefit in the NP53 tumor-bearing animals (Figure 3I). Additionally, although the expression of TIM-3 was high in GBM patients’ samples (TCGA; Figure S5H), evaluation of the therapeutic effect in an orthotopic glioma model showed no survival benefit (Figure 3J). Altogether, our data support the value of targeting TIM-3 and the uniqueness of this immune checkpoint molecule in the context of DIPG.
TIM-3 blockade results in increases in proinflammatory populations in the TME
To better understand the antitumor efficacy of TIM-3 blockade in DIPG, we characterized the mechanism underlying this effect in vivo. Mice were sacrificed 3, 7, or 14 days after the first dose, following the same schedule as in the survival experiment (Figure S6A). On day 7, anti-TIM-3-treated mice displayed a 3-fold increase in the number of microglia (CD45medCD11b+), which harbored a more proliferative phenotype (Ki67+) than those in IgG2a-treated animals (Figure 4A). Anti-TIM-3-treated mice displayed increases in the percentage and proliferative state of NK cells (Figure 4B). Next, we further characterized the NK-cell compartment, and we differentiated four maturation and functional states according to the markers CD27 and CD11b34 (Figure 4C). NK cells from anti-TIM-3-treated mice showed a more proliferative functional state (CD27+CD11b−) (Figure 4C) and expressed the early activation markers CD69 and GITR but maintained low levels of CD137 and NKp46 (Figure S6B) NK cells with a mature cytotoxic phenotype (CD27+CD11bmed) did not change in number or phenotype upon treatment (Figure 4C). However, anti-TIM-3-treated mice had a significantly lower percentage of CD27+CD11bhigh NK cells, corresponding to a terminal cytotoxic phenotype (TIM-3highCD137lowGITRlow; Figure 4C and S6C). These data suggest that anti-TIM-3 treatment maintains NK cells in a proliferative state without the onset of exhaustion. Anti-TIM-3-treated mice showed an increase in the level of DCs with significantly elevated Ki67 levels (Figure 4D), although the expression of maturation markers) remained unchanged (Figure S6D). There were no changes in the number or phenotype of macrophages between the treatments, but with TIM-3 blockade, these cells were less proliferative, as measured by evaluating the marker Ki67 (Figure S6E). It should be noted that in both treatments, macrophages displayed the same phenotype (CD206highCD163medCD80medCD86med; Figure S6F). Interestingly, by day 14 after treatment, we observed an increase in the adaptive response, with augmentation of the level of CD8+ T cells (Figure 4E) that displayed an activated phenotype with higher GITR expression and lower PD-1 and TIM-3 expression (Figure 4F). The higher levels of intratumoral IL-1β and IFN-γ in anti-TIM-3-treated mice suggested an antitumor immune response (Figure 4G) that was further confirmed by increases in the number of infiltrating tumor-specific T cells on days 7 and 14 (Figure 4H). In addition, treated mice showed significantly higher percentages of CD8+ T cells with an IFN-γ+TNF-α+ or GrzB+TNF-α+ phenotype (Figure 4I) and a decrease in the Treg population (Figure 4J). Although there was no difference in the number of CD4+ T cells, those from anti-TIM-3-treated mice displayed lower GITR and PD-1 expression (Figure 4J and S6GA). Similarly, upon restimulation, CD4+ T cells from treated mice presented a cytotoxic profile with significant increases in the proportions of Ki67+TNF-α+, GrzB+TNF-α+, and IFN-γ+TNF-α+ cells (Figure 4K and S6H). No differences were found in the CD4+ or CD8+ phenotype between the treatments at day 14 (Figure S6I). Monocytes and B cells remained unchanged throughout the course of the immune response, while the level of granulocytes was increased 7 days after the intratumoral dose of anti-TIM-3 (Figure S6J). This treatment led to significant increases in the proinflammatory CD8+ Tcell:Treg, CD4+ T cell:Treg and CD8+ T cell:macrophage ratios at day 14 after intratumoral treatment (Figure 4L and S6K). On day 7 after treatment, we observed increases in the levels of the chemoattractant chemokines CCL2, CCL5, and CXCL10, which are important in the trafficking of immune cells such as T cells and DCs (Figure 4M). Collectively, these results indicate that anti-TIM-3 treatment causes an increase in the number of T cells in the TME and activation of tumor-specific T cells to maintain a proinflammatory and cytotoxic phenotype that is critical for antitumor efficacy in the TME.
Figure 4.

Characterization of tumor microenvironment modulation by TIM-3 blockade
NP53 cells were engrafted (Day -3), and animals were treated with IgG2a or anti-TIM-3 (Day 0) following the hybrid schedule depicted in Figure 3B. Animals were sacrificed on days 3, 7, and 14 after treatment (A). Left panel, flow cytometric analyses of microglia per mg of tumor on days 3 and 7 after i.t. treatment. Right panel, quantification of Ki67+ microglia by flow cytometry on day 7 after i.t. treatment (p = 0.001) (B) Left panel, flow cytometric analyses of the NK-cell percentage. Right panel, Ki67 expression on NK cells at the indicated days after i.t. treatment with IgG2a or anti-TIM-3.
(C) Analyses of the NK-cell status using the markers CD27 and CD11b on Day 3 after i.t. treatment. CD27+CD11b− (green), CD27+CD11b+ (gray), CD27−CD11bmed (blue), and CD27+CD11bhigh (red). Left panel, representative flow cytometry plots. Right panel, quantification of the indicated markers (p = 0.0007).
(D) Left panel, flow cytometric analyses of the DC percentage. Right panel, Ki67 expression on DCs at 7 days after i.t. treatment.
(E) Flow cytometric analyses of the CD8+ T cell percentage in the CD45+ population on days 3, 7, and 14 after i.t. treatment.
(F) Flow cytometric analyses of different activation (GITR, p < 0.0001) and exhaustion (PD1, p < 0.0001; TIM-3, p = 0.009) markers expressed in the CD8+ subset on day 7 after treatment administration.
(G) Quantification of IL-1β and IFN-γ expression in the tumor parenchyma on days 3 and 7 (p < 0.001, both) after i.t. treatment.
H) ELISPOT analyses of TILs on Days 7 and 14 after i.t. IgG2a or anti-TIM-3 treatment (p < 0.001 and p = 0.04, respectively) (I) Flow cytometric analysis of IFN-γ, TNF-α, and GrzB expression after ex vivo stimulation of CD8+ TILs treated with IgG2a or anti-TIM-3 (p < 0.001, all).
(J) Analyses of the CD4+ and Treg percentages in the CD45+ cell population on days 3, 7, and 14 after i.t. treatment with IgG2a or anti-TIM-3.
(K) Flow cytometric analysis of Ki67, TNF-α, and GrzB expression after ex vivo stimulation of CD4+ TILs treated with IgG2a or anti-TIM-3 (p < 0.001, all).
(L) Analyses of the CD8+ cell:Treg (p < 0.0001) and CD8+ cell:macrophage (p < 0.001) ratios in the tumor microenvironment population on the indicated days.
(M) Flow cytometric analysis of CCL2, CCL5, and CXCL10 expression in the tumor microenvironment on the indicated days. Student’s t test, one-way ANOVA and two-way ANOVA were performed. Bar graphs indicate the mean ± SEM (ns, p > 0.05; ∗p < 0.05; ∗∗p < 0.01; ∗∗∗p < 0.001; ∗∗∗∗p < 0.0001). See also Figure S6.
TIM-3 blockade efficacy is due to the coordinated interactions of several immune populations in the TME
Considering that the levels of T cells, NK cells, and microglia were significantly increased after TIM-3 blockade, we decided to deplete these cells to decipher their contributions to the therapeutic effect of the treatment (Figures 5A and S7A). Depletion of NK cells resulted in a partial loss of the therapeutic effect of anti-TIM-3 treatment, with a median overall survival time of 25 versus 39 days. In addition, CD4+ or CD8+ T cell depletion led to loss of the therapeutic effect, which was even more pronounced than in the loss observed with NK cell depletion (25 days and 29 days, respectively; Figures 5B and S7B). However, there was a small but significant therapeutic effect on the survival of mice lacking NK cells, CD4+, or CD8+ T cells when anti-TIM-3-treated mice were compared to IgG-treated mice without depletion of these populations (AbIgG2b+AbIgG2a group; Figures 5B and S7B). These results suggested that T cells (mainly CD8+) are the population with the most prominent role in the efficacy. Nevertheless, the therapeutic effect of the anti-TIM-3 antibody was due to the combined action of at least two populations. Depletion of NK + CD4+ T cells (18 days) or NK + CD8+ T cells (17 days) resulted in a significant decrease in the therapeutic effect of the anti-TIM-3 antibody; these decreases were greater than those caused by depletion of only one population (Figures 5C and S7C). Again, we still observed a significant therapeutic effect on survival when either depletion group was compared with the control group (Figures 5C and S7C) confirming that myeloid cells also play a role in the therapeutic effect of TIM-3 blockade. The depletion of immune populations was confirmed in both experiments by flow cytometric analysis of the blood (Figures S10D and S10E). Next, we used immunodeficient Rag2-γc- mice, which lack functional T, B, and NK cells but have macrophage and microglial populations, to further rule out roles for microglia and macrophages in therapeutic efficacy. Interestingly, survival studies demonstrated a significant increase in mouse survival achieved with anti-TIM-3 treatment versus IgG2a treatment (18 vs. 21 days, Figure 5D), demonstrating a minimal direct role of myeloid cells in therapeutic efficacy, probably due to enhanced activation of this population after TIM-3 blockade. Depletion of microglia/macrophages with a CSF1R inhibitor (PLX-3397) resulted in total loss of the therapeutic effect compared with PLX+anti-TIM-3 treatment, producing a result similar to that observed for the Vehicle+AbIgG2a group (Figure 5E and S8A); this result demonstrated a fundamental role for these populations in producing a functional immune response. Next, we characterized how PLX treatment alters the immune process triggered by TIM-3 blockade (Figure S6A). PLX treatment resulted in a significant decrease in the number of macrophages, but not in the number of microglia, compared to the vehicle-treated groups (3 days after anti-TIM-3 i.t. treatment; Figure S8B). This result suggests that anti-CSF1R treatment preferentially depletes macrophages. We observed that PLX treatment caused a decrease in the number of macrophages, NK, and CD8+ T cells compared with the vehicle+AbTIM-3 group, 7 days after the first dose, (Figure 5F). In addition, we observed that PLX triggered a decrease in the number of active (Ki67+) and pro-inflammatory (MHCII+) microglia cells per mg of tumor resulting from anti-TIM-3 treatment (Figure 5G). PLX treatment not only causes loss of proliferative microglia but also loss of CD4+ and CD8+ T cells proliferation during the first step of the immune response caused by TIM-3 blockade (at day 3 and 7 after i.t. dose; Figure 5H and S8C). Interestingly, there is a significantly higher percentage of macrophages expressing MHC II (pro-inflammatory marker) in the anti-TIM-3-treated brains which is lost after PLX treatment (Figure S8D). Importantly, after PLX treatment, all these population changes are accompanied by the loss of cytokines CCL5, CCL2, CXCL10, IL-1β, and IFN-γ that increase after TIM-3 blockade in the tumor microenvironment (Figure 5I). In the long-term immune response (14 days), PLX administration led to a loss in the number and proliferative state of microglia and CD8+ T cells that is observed with anti-TIM-3 blockade (Figures S8E and S8F). At day 14 and probably coincidental with the last stage of the immune response we did not observe differences in the number of either CD4+ Conv or Treg nor in their proliferative state (Figures S8G and S8H). These data demonstrate that TIM-3 blockade transforms the TME toward a more pro-inflammatory phenotype, mediated by activation of pro-inflammatory macrophages and microglia, which triggers several pro-inflammatory chemokines and cytokines that, in turn, enhance the T cell antitumor response. Importantly, these data also demonstrated the importance of the coordinated action of mainly macrophages, microglia, and CD8+ T cells for achieving a complete therapeutic effect through TIM-3 blockade.
Figure 5.

Characterization of the roles of different immune populations in TIM-3-blockade efficacy
(A) Schedule of survival experiments (NP53 cells bearing mice) performed with depleting antibodies specific for NK cells (clone K1.1), CD4+ T cells (clone GK1.5), and CD8+ T cells (clone CD8β) and anti-TIM-3 or IgG2a antibodies.
(B and C) Kaplan-Meier survival curves of mice treated with the anti-TIM-3 antibody and (B) depleting antibody specific for NK cells (n = 11), CD4 cells (n = 10), or CD8 cells (n = 11) alone or in combination (C) of NK and CD4+ T cells (n = 10) or NK and CD8+ T cells (n = 11).
(D) Kaplan-Meier survival curves of immunodeficient Rag2-γc- mice treated with anti-TIM-3 (n = 10) or IgG2a (n = 9) (log rank p = 0.01).
(E) Kaplan-Meier survival curves of mice treated with anti-TIM-3 (n = 10) or IgG2a (n = 12) or an anti-CSFR1 drug (PLX) plus the anti-TIM-3 antibody (n = 11).
(F) Flow cytometric analyses of macrophages, NK and CD8+ T cells per mg of tumor on day 7 after TIM-3 i.t. treatment with Vehicle+IgG2a (black), Vehicle+AbTIM-3 (blue), or PLX+AbTIM-3 (yellow).
(G) Flow cytometric analyses of microglia number of cells per mg tumor (left panel), MFI Ki67 (middle panel), and percentage of MHCII expression (right panel) on day 7.
(H) Quantification of Ki67+ CD4+ (left panel) and CD8+ T cells (right panel) by flow cytometry on day 7 after i.t. treatment.
(I) Flow cytometric analysis of CCL2, CCL5, CXCL10, IL-1β, and IFN-γ expression in the tumor microenvironment comparing groups on the indicated day. One-way ANOVA was performed. Bar graphs indicate the mean ± SEM (ns, p > 0.05; ∗p < 0.05; ∗∗p < 0.01; ∗∗∗p < 0.001; ∗∗∗∗p < 0.0001). See also Figures S7 and S8.
Tumor draining lymph nodes play a role in the antitumor response triggered by anti-TIM-3 treatment
Since a major hurdle in the efficacy of immunotherapies against brain tumors35 is the lack of antigen presentation in the tumor-draining lymph nodes (TDLNs) and issues related to the homing of T cells to these TDLNs, we wanted to assess whether TIM-3 could rescue this situation. Previously we confirmed that after either local or systemic administration the antibody was able to reach the cervical draining lymph nodes where it could be causing phenotypic changes in the immune populations (Figures 3A, 3B, S4E, and S4F). Thus, we evaluated the kinetics of different immune populations in the deep cervical lymph node (DC LN; main) and superficial cervical lymph node (SC LN) (Figure 6A). Flow cytometry confirmed that antiTIM-3-treated DC LNs had a significantly higher number of CD45+ immune cells than IgG2a-treated DC LNs at day 7 after the first treatment dose (Figure 6B). Within this CD45+ population, we observed significant increases in the CD4+ and B cell populations (Figure 6C). There was also a trend toward increases in the number of CD8+ cells and DCs (Figure 6D). No differences were observed in any other immune population in the SC LN (Figure S9A). To investigate the importance of DCs, we characterized their phenotype in both lymph nodes. Interestingly, DCs in the anti-TIM-3-treated DC LN had significantly lower expression of PD-L1 (Figure 6E). In addition, DCs in the anti-TIM-3-treated SC LN had significantly higher expression of CD80 and MHCII (Figure S9B), corresponding to a mature phenotype with greater antigen presentation.
Figure 6.

Assessment of the role of the deep cervical tumor-draining lymph nodes in TIM-3 blockade
(A) Representative diagram of where the superior cervical (SC LN) and deep cervical lymph nodes (DC LN) are located.
(B) Flow cytometric analyses of the number of CD45+ immune cells in the DC LN on day 7 after i.t. treatment with IgG2a (black) or anti-TIM-3 (blue).
(C and D) Flow cytometric analyses of the numbers of (C) CD4+ T, B cells, (D) CD8+ T cells, and DCs in the DC LN on day 7 after i.t. treatment.
(E) MFI analysis of PD-L1 expression in DCs in the tumor-draining DC LN on Day 7 after treatment.
(F and G) Left panels, representative flow cytometry plots. Right panels, flow cytometric analysis of Ki67+, TNF-α+, GrzB+, and IFN-γ+ expression after ex vivo stimulation of (F) CD4+ or (G) CD8+ cells from the DC LN of mice treated with IgG2a or anti-TIM-3. Student’s t test was performed in all the graphs. Bar graphs indicate the mean ± SEM (ns, p > 0.05; ∗p < 0.05; ∗∗p < 0.01; ∗∗∗p < 0.001; ∗∗∗∗p < 0.0001). See also Figure S9.
Next, we investigated the cytotoxic potential of T cells present in both lymph nodes. To this end, T cells were restimulated. In both lymph nodes, the anti-TIM-3-treated CD4+ cell population displayed increases in the frequencies of Ki67+TNF-α+ and GrzB+TNF-α+ cells. However, we observed only a significant increase in IFN-γ+TNF-α+ cells in the DC LN (Figure 6F and S9C). An analysis of these markers in the CD8+ T cell population also revealed increases in the frequencies of Ki67+TNF-α+ and GrzB+TNF-α+ cells in the anti-TIM-3-treated TDLN compared with those in the control (IgG2a)-treated TDLN. In contrast to the results for CD4+ cells, in the TIM-3-treated group, we observed a significant increase in the frequency of CD8+Ki67+TNF-α+ cells in both draining lymph nodes (Figures 6G and S9D). Importantly, in mice treated with anti-TIM-3, the percentage of cytotoxic T cells in DC LNs was twice as high as in SC LNs, highlighting the potential pivotal importance of the first ones (Figures 6F, 6G, S9C, S9D). These results demonstrate that anti-TIM-3 treatment causes T cell activation and proliferation in the lymph nodes, especially in the DC LN, mediated at least in part by TNF-α and probably due to effective antigen presentation by DCs.
Discussion
Despite preclinical and clinical research efforts, DIPGs remain incurable. In this study, we demonstrate the efficacy of inhibiting the immune checkpoint molecule TIM-3 in different preclinical models of DIPGs and elucidate the underlying mechanism, offering a rationale to translate this approach. These data are in stark contrast to the lack of efficacy achieved with immune checkpoint blockade (ICB) in brain tumors in general36,37,38 and more specifically in DIPG. The first clinical trial using nivolumab (anti-PD-1) showed no survival benefit in these patients.7 Despite this lack of efficacy, new phase I and I/II clinical trials with anti-PD-1 (pembrolizumab, NCT02359565; pidilizumab, NCT01952769; and cemiplimab, NCT03690869), anti-PD-L1 (durvalumab, NCT02793466), or anti-CTLA-4+anti-PD-1 (nivolumab+ipilimumab, NCT03130959) were launched with the intention of evaluating the therapeutic efficacy of ICIs in DIPG.39 However, the therapeutic benefits are far from desirable. The high expression of TIM-3 in DIPG compared to that of other immune checkpoint molecules and the role of TIM-3 in myeloid populations that are fundamental in the DIPG microenvironment,8 together with these promising preclinical data, suggest a completely different approach. Therefore, the promising preclinical data for TIM-3 blockade support its clinical translation via the systemic route or other alternative routes of administration, such as intratumoral injection,30 which may be better for antibody delivery to the tumor due to the integrity of the BBB.
The role of TIM-3 in brain tumors has not been extensively characterized, although TIM-3 blockade in combination with radiotherapy, but not alone, has shown promising efficacy in preclinical models of glioblastoma multiforme (GBM).40 In our work, the antitumor effect of an anti-TIM-3 antibody as a single agent was remarkable, increasing the median overall survival of treated mice and the infiltration of proinflammatory immune cell populations in the TME. Interestingly, microglia and macrophages were the populations in which TIM-3 was most highly expressed in the TME of DIPG patients, followed by tumor cells (OPC-like), mainly in the H3-mutated molecular subgroup. Nevertheless, in our work we found therapeutic effect inhibiting TIM-3 in both H3-mutated and H3WT models suggesting that the inhibition of the TIM-3 in the immune compartment was the most relevant for the antitumor effect. Moreover, we underscore the possibility to use this therapy in both H3-mutant and H3-WT molecular subgroups.
Modulation of TIM-3 in microglia has been described to play an important role in the immune response in gliomas41 and in other brain diseases, such as neuroinflammation under hypoxia18 and intracerebral hemorrhage.17 Additionally, recent work has shown that intrinsic TIM-3 cancer cell expression induces glioblastoma progression by modulating tumor cells and the TME.23 Here, we demonstrate that DIPG cell-intrinsic TIM-3 plays a fundamental role in tumorigenesis independent of the TME mainly via the MAPK pathway.
Although the roles of macrophages and microglia in DIPG are not well understood, CD11b+ cells comprise 94% of the immune cells in the TME.8 Interestingly, in our murine model, anti-TIM-3 treatment resulted in increase in the levels of microglia, NK cells, DCs, and CD8+ T cells corresponding to proliferative/active phenotypes and the secretion of CLL2, CCL5, CXCL10, IL-1β, and IFN-γ into the TME. Under physiological conditions, microglia are not a highly variable population42; nevertheless, under pathogenic conditions, they acquire a great proliferative capacity.43,44,45 Microglia are the main secretory cells for the chemoattractant chemokines CCL2 and CCL5 in brain tumors.46 However, several studies have demonstrated that high CCL247 and CCL548 expression in the microenvironment can induce a shift in microglia toward a proinflammatory profile. The myeloid chemokine CXCL10 has also been described as a key molecule in the attraction of T cells to the TME to enhance the therapeutic effect of ICB.49,50 In addition, TIM-3 blockade in DCs is directly related to the maintenance of the IFN-γ-producing effector CD8+ T cell pool driven by IL-1β.15 Our depletion data showed that all populations played important roles in the therapeutic effect; however, only the loss of macrophages and microglia caused a complete loss of the efficacy of anti-TIM-3 therapy due to a loss of pro-inflammatory immune populations, chemokines and cytokines. This could be because these cells are entirely necessary not for their direct effects on tumor cells but for the remodeling of the DIPG TME toward a more favorable environment for the remaining immune populations,51 supporting the efficacy of ICB.52,53 Additionally, we demonstrated that TIM-3 blockade has direct effects on microglia and macrophages, inducing remodeling of the TME and stimulating the expansion and activity of tumor-specific CD8+ T cells to support their antitumor effects.
In summary, we provide strong evidence that TIM-3 blockade is capable of inducing profound proinflammatory changes in the DIPG TME, leading to the activation of T cells and generation of immune memory and thus preventing tumor recurrence. Additionally, we demonstrate the critical roles of microglia and macrophages in TIM-3-blockade efficacy. The encouraging results obtained in this study provide a strong rationale for exploring TIM-3 blockade in the treatment of DIPGs and support initiating clinical studies.
STAR★Methods
Key resources table
| REAGENT or RESOURCE | SOURCE | IDENTIFIER |
|---|---|---|
| Antibodies | ||
| AF594 anti-mouse CD44 (IM7) | BioLegend | Cat#103054; RRID: AB_2563183 |
| AF750 anti-mouse CD45 (30-F11) | BioLegend | Cat#103128; RRID: AB_493715 |
| Akt (pan) (11E7) Rabbit mAb | Cell Signaling | Cat#4685; RRID: AB_2225340 |
| APC anti-mouse CD163 (S15049I) | BioLegend | Cat#155305; RRID: AB_2814059 |
| APC anti-mouse F4/80 (BM8) | BioLegend | Cat#123116; RRID: AB_893481 |
| APC anti-mouse TIM-3 (B8.2C12) | BioLegend | Cat#134007; RRID: AB_2562997 |
| APC anti-mouse TNFα (MP6-XT22) | BioLegend | Cat#506307; RRID: AB_315428 |
| BUV395 anti-mouse CD11b (M1/70) | BD Bioscience | Cat#563553; RRID: AB_2738276 |
| BUV496 anti-mouse CD4 (GK1.5) | BD Bioscience | Cat#612952; RRID: AB_2813886 |
| BV421 anti-mouse CD19 (6D5) | BioLegend | Cat#115538; RRID: AB_11203527 |
| BV421 anti-mouse CD8a (KT-15) | Bio-Rad | Cat# MCA609PBT |
| BV421 anti-mouse MERTK (2B10C42) | BioLegend | Cat#151510; RRID: AB_2832533 |
| BV421 anti-mouse NKp46 (29A1.4) | BioLegend | Cat#137611; RRID: AB_10915472 |
| BV421 anti-mouse PD-1 (29F.1A12) | BioLegend | Cat#135218; RRID: AB_2561447 |
| BV421 anti-mouse PD-L1 (10F.9G2) | BioLegend | Cat#124315; RRID: AB_10897097 |
| BV510 anti-mouse CD8a (53-6.7) | BioLegend | Cat#107520; RRID: AB_2813967 |
| BV605 anti-mouse CD206 (C068C2) | BioLegend | Cat#141721; RRID: AB_2562340 |
| BV605 anti-mouse NK1.1 (PK136) | BioLegend | Cat#108739; RRID: AB_2562273 |
| BV650 anti-mouse IA/IE (M5/114.15.2) | BioLegend | Cat#107641; RRID: AB_2565975 |
| BV785 anti-mouse TCRb (H57-597) | BioLegend | Cat#109249; RRID: AB_2810347 |
| CD4 (D7D2Z) Rabbit mAb | Cell Signaling | Cat#25229; RRID: AB_2798898 |
| CEACAM1 Rabbir mAb | Thermo Fisher | Cat#PA5-114988; RRID: AB_2899624 |
| c-Jun (60A8) Rabbit mAb | Cell Signaling | Cat#9165; RRID: AB_2130165 |
| Erk1/2 (p44/42 MAPK) Antibody | Cell Signaling | Cat#9102; RRID: AB_330744 |
| F4/80 (D2S9R) Rabbit mAb | Cell Signaling | Cat#70076; RRID: AB_2799771 |
| FITC anti-mouse CD3 (17A2) | BioLegend | Cat#100203; RRID: AB_312660 |
| FITC anti-mouse CD4 (RM4-5) | BioLegend | Cat#100510; RRID: AB_312713 |
| FITC anti-mouse Ki67 (11F6) | BioLegend | Cat#151211; RRID: AB_2814054 |
| FITC anti-mouse Ly6C (1A8) | BioLegend | Cat#128006; RRID: AB_1186135 |
| FoxP3 (D6O8R) Rabbit mAb | Cell Signaling | Cat#12653; RRID: AB_2797979 |
| Galectin-9 Rabbit mAb | Abcam | Cat#Ab127982; AB_1114143 |
| Galectin-9 (D9R4A) Rabbit mAb | Cell Signaling | Cat#54330; RRID: AB_2799456 |
| H3K27M Rabbit mAb | Abcam | Cat#ab190631; RRID: AB_2860570 |
| InVivoMAb anti-CD4 (GK1.5) | BioXCell | Cat#BE0003-1; RRID: AB_1107636 |
| InVivoMAb anti-CD8β (53-5.8) | BioXCell | Cat#BE0223; RRID: AB_2687706 |
| InVivoMAb anti-IgG2a (2A3) | BioXCell | Cat#BE0089; RRID: AB_1107769 |
| InVivoMAb anti-IgG2b (MPC-11) | BioXCell | Cat#BE0086; RRID: AB_1107791 |
| InVivoMAb anti-NK1.1 (PK136) | BioXCell | Cat#BE0036; RRID: AB_1107737 |
| InVivoMAb anti-PD-1 (RMP1-14) | BioXCell | Cat#BE0146; RRID: AB_10949053 |
| InVivoMAb anti-TIM-3 (RMT3-23) | BioXCell | Cat#BE0115; RRID: AB_10949464 |
| IκBα Antibody | Cell Signaling | Cat#9242; RRID: AB_331623 |
| MEK1 Antibody | Cell Signaling | Cat#9124; RRID: AB_330804 |
| p38 MAPK Antibody | Cell Signaling | Cat#9212; RRID: AB_330713 |
| pAkt (Ser473) Antibody | Cell Signaling | Cat#9271; RRID: AB_329825 |
| pAkt (Thr308) Antibody | Cell Signaling | Cat#9275; RRID: AB_329828 |
| PD-1 Rabbit mAb | Cell Signaling | Cat#84651; RRID: AB_2800041 |
| PE anti-mouse CD40 (3/23) | BioLegend | Cat#124609; RRID: AB_1134084 |
| PE anti-mouse OX-40 (OX-86) | BioLegend | Cat#119409; RRID: AB_2272150 |
| PE anti-mouse TIM-3 (RMT3-23) | BioLegend | Cat#119703; RRID: AB_345377 |
| PECy7 anti-mouse CD11c (N418) | BioLegend | Cat#117318; RRID: AB_493568 |
| PECy7 anti-mouse CD69 (H1.2F3) | BioLegend | Cat#104511; RRID: AB_493565 |
| PE anti-mouse FOXP3 (3G3) | BioLegend | Cat#126404; RRID: AB_1089117 |
| PECy7 anti-mouse Granzyme B (NGZB) | eBioscience | Cat#25-8898-80; RRID: AB_10853338 |
| PE-Dazzle anti-mouse CD27 (LG.3A10) | BioLegend | Cat#124227; RRID: AB_2565793 |
| PE-eFluor610 anti-mouse FOXP3 (FJK-16S) | Thermo Fisher | Cat#61-5773-82; RRID: AB_2574624 |
| PerCP/Cy5.5 anti-mouse GITR (DTA-1) | BioLegend | Cat#126316; RRID: AB_2563384 |
| PerCP/Cy5.5 anti-mouse IFN-γ (XMG1.2) | BioLegend | Cat#505821; RRID: AB_961361 |
| PerCP/Cy5.5 anti-mouse Ly6G (PK136) | BioLegend | Cat#127616; RRID: AB_1877271 |
| pERK1/2 (p44/42 MAPK) (Thr202/Tyr204) Antibody | Cell Signaling | Cat#9101; RRID: AB_331646 |
| pMEK1 (Ser298) Antibody | Cell Signaling | Cat#9128; RRID: AB_330810 |
| pS6 Ribosomal Protein (Ser235/236) Antibody | Cell Signaling | Cat#2211; RRID: AB_331679 |
| PTEN (138G6) Rabbit mAb | Cell Signaling | Cat#9559; RRID: AB_390810 |
| S6 Ribosomal Protein (5G10) Rabbit mAb | Cell Signaling | Cat#2217; RRID: AB_331355 |
| TIM-3 (D3M9R) Rabbit mAb (Mouse Specific) | Cell Signaling | Cat#83882S; RRID: AB_2800033 |
| TIM-3 anti-human (D5D5R) Rabbit mAb | Cell Signaling | Cat#45208S; RRID: AB_2716862 |
| TMEM119 (E3E1O) Rabbit mAb | Cell Signaling | Cat#90840; RRID: AB_2928137 |
| Vinculin Antibody Rabbit mAb | Cell Signaling | Cat#4650; RRID: AB_10559207 |
| Bacterial and virus strains | ||
| SMARTvector inducible lentiviral TIM-3 shRNA | Horizon Discovery | Cat#V3SH11252-226164912 |
| Biological samples | ||
| Human DIPG paraffin blocks | Clinica Universidad de Navarra | https://www.cun.es/ |
| Chemicals, peptides, and recombinant proteins | ||
| CEACAM1 recombinant protein | SinoBiological | Cat#50571-M08H |
| EFG human | MERK | Cat#SRP3027 |
| FGF-2 human | MERK | Cat#SRP4037 |
| Galectin-9 recombinant protein | R&D System | Cat#3535-GA-50 |
| Mouse recombinant IFN-gamma | Thermo Fisher Scientific | Cat#PMC4031 |
| PLX-3397 (anti-CSFR-1) | MedChemExpress | Cat# HY-16749 |
| Critical commercial assays | ||
| BrdU Cell Proliferation Assay Kit | Cell Signaling | Cat#6813 |
| Cell-Titer 96 One solution Aqueous Proliferation kit | Promega | Cat#G3581 |
| IFN-γ ELISPOT set | BD Biosciences | Cat#551083 |
| LEGENDplex mouse inflammation | BioLegend | Cat#740150 |
| LEGENDplex mouse pro-inflammatory chemokine | BioLegend | Cat#740007 |
| Deposited data | ||
| HAVCR2 expression from Kids First Data Resource Portal | Kids First Data Resource Portal | https://portal.kidsfirstdrc.org |
| HAVCR2 expression from PedcBioPortal | PedcBioPortal | https://pedcbioportal.org/ |
| HAVCR2 expression from St. Jude dataset | St. Jude dataset | https://pecan.stjude.cloud/proteinpaint/HAVCR2 |
| Single cell-RNAseq data from DIPG patients | Laboratory of Dr. Mariella Filbin1 | N/A |
| RNAseq raw and analyzed data | This paper | GEO: GSE223859 |
| Experimental models: Cell lines | ||
| Human DIPG: HSJD-DIPG-007 | Laboratory of Dr. Jaume Mora | N/A |
| Human DIPG: JHH-DIPG I | Laboratory of Dr. Eric Raabe | N/A |
| Human DIPG: SU-DIPG IV | Laboratory of Dr. Michelle Monje | N/A |
| Human DIPG: TP54 | Laboratory of Drs. Marie-Pierre Junier and Hervé Cheneiwess | N/A |
| Human DIPG: TP80 | Laboratory of Drs. Marie-Pierre Junier and Hervé Cheneiwess | N/A |
| Murine GBM: CT-2A | Laboratory of Dr Fueyo and Dr Gómez-Manzano |
N/A |
| Murine DIPG: NP53 | Laboratory of Dr. Oren Becher | N/A |
| Murine DIPG: NP53 Control Guide | This paper | N/A |
| Murine DIPG: NP53 TIM-3KO G2C1 | This paper | N/A |
| Murine DIPG: NP53 TIM-3KO G2C9 | This paper | N/A |
| Murine DIPG: XFM | Laboratory of Dr. Oren Becher | N/A |
| Experimental models: Organisms/strains | ||
| Mouse: BALB/cJ ; Strain #:000651 | The Jackson Laboratory | Strain #:000651 |
| Mouse: C57BL/6J | The Jackson Laboratory | Strain #:000664 |
| Mouse: NP53 fl/fl (NTV-a p53floxed) | Laboratory of Dr. Oren Becher | N/A |
| Mouse: Rag2-/- γc-/- mice ; C;129S4-Rag2tm1.1Flv Il2rgtm1.1Flv/J | The Jackson Laboratory | Strain #:014593 |
| Oligonucleotides | ||
| Murine TIM-3KO Guide 1: 5′- CACCGTTCTCCAAGAACCCTAACCA-3′ |
This paper | N/A |
| Murine TIM-3KO Guide 2: 5′-CACCGAGCTGTAGTAGAGTCCCCAT- 3′. |
This paper | N/A |
| Control Guide: 5′-GCGAGGTATTCGGCTCCGCG-3′ | Ishizuka et al.2 | N/A |
| Human TIM-3KO Guide 1: 5′-CACCGTGTGTTTGAATGTGGCAACG -3′ |
This paper | N/A |
| Human TIM-3KO Guide 2: 5′-CACCGTGAAGTCTCTCTGCCGAGT -3′ |
This paper | N/A |
| Recombinant DNA | ||
| pSpCas9(BB)-2A-GFP(PX458) | Addgene | Cat#48138 |
| Software and algorithms | ||
| Akoya Biosciences Inform software (version 2.4.8) | Biosciences | N/A |
| FlowJo 10.8.1 | BD Biosciences | N/A |
| Prism software 9.3.1 | GraphPad by Domatics | N/A |
| QuPath version 0.2.3 | University of Edinburgh | N/A |
| R/Bioconductor | Bioconductor | N/A |
| LEGENDplex™ Data Analysis Software V.8.0 | Vigene Tech Inc | N/A |
Resource availability
Lead contact
Further information and requests for resources and reagents should be directed to and will be fulfilled by the lead contact, Marta M. Alonso (mmalonso@unav.es).
Materials availability
All unique reagents generated in this study are available from the lead contact without restriction. This does not apply to the BMS-986258 antibody since the property belongs to Bristol-Myers Squibb pharmaceuticals.
Experimental model and subject details
Cell lines and culture conditions
The murine DIPG cell lines XFM (H3-WT) and NP53 (H3.3K27M) were provided by Dr. Becher (Mount Sinai, NY, USA). The cell lines were generated from DIPG tumors arising in genetically modified mice.54 CT-2A cells were kind gifts from Dr Fueyo and Dr Gómez-Manzano (UT MD Anderson Cancer Center, Houston, Texas, USA). All murine cell lines were maintained in Dulbecco’s Modified Eagle Medium supplemented with 10% fetal bovine serum and 1% streptomycin/penicillin. The human DIPG cell lines TP54 (H3.3K27M) and TP80 (H3.3K27M) were kindly provided by Drs. Marie-Pierre Junier and Hervé Cheneiwess (INSERM Institute, Paris, France); the SU-DIPG IV (H3.1K27M) cell line was a kind gift from Dr. Michelle Monje (Stanford, California); JHH-DIPG1 (H3.3K27M) cells were generously provided by Dr. Eric Raabe (John Hopkins, Baltimore); and HSJD-DIPG-007 (H3.3K27M) cells were provided by Dr. Angel Montero (Sant Joan de Déu, Barcelona, Spain). All human DIPG cell lines were maintained as neurospheres cultured in a specialized serum-free basal medium supplemented with a human neural stem cell proliferation supplement (NeuroCultTM NS-A Proliferation Kit, #05751, STEMCELL Technologies), basic fibroblast growth factor (FGF) and epidermal growth factor (EGF) (20 ng/mL MERK, St. Louis, MO). All cells were maintained in a humidified atmosphere containing 5% CO2 at 37°C. All cell lines were routinely tested for mycoplasma (Mycoalert mycoplasma detection kit; Lonza) and authenticated at the CIMA Genomic Core Facility (Pamplona, Spain) using DNA profiling.
Animal studies
Ethical approval for the animal studies was granted by the Animal Ethical Committee of the University of Navarra (CEEA; Comité Etico de Experimentación Animal) under protocol number CEEA/004-21. All animal studies were performed at the veterinary facilities of the Center for Applied Medical Research in accordance with institutional, regional, and national laws and ethical guidelines for experimental animal care. The orthotopic DIPG model was established by injection into the pons55 using a guide-screw system (Taconic Farms, Inc.).
DIPG immunocompetent models
NP53: 10,000 cells were implanted to 4-week-old transgenic mice in 3 μl of uncomplemented DMEM, with equal numbers of each sex included, kindly provided by Dr. Oren Becher. NP53 cell line was obtained from tumors generated using RCAS (Replication-competent ASLV long terminal repeat with a splice acceptor) system in NP53 fl/fl mice, obtained from crossing Nestint tv-a (Ntv-a) and p53 floxed (C57BL/6 background with p53 fl/fl). Nestin Tv-a mice contain the TVA receptor (receptor for RCAS to infect) under the Nestin promoter. The cells that express Nestin are susceptible for virus infect producing PDGF-B signaling, p53 loss, and ectopic H3.3-K27 mutation in those cells. The cells that mainly express Nestin are the glial progenitor cells. Dr Becher derived the NP53 cell line from tumors generated using this system and therefore, we implant these cell line in the same mice it was created. In one of the experiments, the NP53 cell line was implanted into Rag2-γc- (C;129S4-Rag2tm1.1Flv Il2rgtm1.1Flv/J) immunodeficient mice that lack functional NK, T and B cells to study the therapeutic role of myeloid cells in our treatment. XFM: 1,000 cells in 3 μl of uncomplemented DMEM were implanted in Balb/c mice. The XFM cell line was generated in the same way that NP53 from tumors developed in a mouse model driven by PDGF-B signaling and Ink4a and ARF loss with H3 wild-type. Ink4a-ARF deletions are more common in secondary DIPGs (induced by RT).
Anti-TIM-3 (BioXCell; clone RMT3-23), or its corresponding IgG2a (BioXCell; clone C1.18.4), was administered intratumorally in 3 μl (25 μg) and then injected two times intraperitoneally (10 mg/kg) at 3, 7 and 11 days after cell implantation, respectively in the hybrid schedule. In the systemic schedule, anti-TIM-3 was administrated three times intraperitoneally (10 mg/kg) at 3, 7 and 11 days after cell implantation. Mice were sacrificed when symptoms were visible. In the murine models, in which growth kinetics were very fast, we considered long-term survivors to be those animals that lived at least three times longer than the median survival time of control animals.
DIPG immunodeficient model (human cell line)
HSJD-DIPG-007: 500,000 cells were implanted to 4-week-old Rag2-γc- immunodeficient mice in 3 μl of uncomplemented TSM medium, with equal numbers of each sex included. HSJD-DIPG-007 is an established DMG cell line from the Sant Joan de Déu Hospital in Barcelona, derived from the autopsy of a radiotherapy-naive, 6-year-old male that died one month after diagnosis and received one course of chemotherapy (cisplatin and irinotecan). These HSJD-DIPG-007 tumor cells harbor mutations in H3F3AK27M, ACVR1 R206H, PPM1Dp.P428fs, and PIK3CAp.H1047R.
In these model, human anti-TIM-3 (BMS-986258; Bristol-Myers Squibb) was administered following a hybrid schedule. Rag2-γc- mice bearing orthotopically injected human DMG cells were treated with a single intratumoral injection of anti-TIM-3 (15μg/mouse), or its corresponding IgG (IgG1 control group), and subsequently once a week with intraperitoneal doses (10mg/kg per mouse) until the end of the experiment. BMS confirms that this antibody does not cross-react to mouse cells.
GBM immunocompetent model
CT-2A: 5,000 cells in 3 μl of uncomplemented DMEM were implanted in C57BL/6J mice in the supratentorial region of the mice using a guide-screw system described previously. Anti-TIM-3 was administrated three times intraperitoneally (10 mg/kg) at 3, 7 and 11 days after cell implantation. Mice were sacrificed when symptoms were visible. In the murine models, in which growth kinetics were very fast, we considered long-term survivors to be those animals that lived at least three times longer than the median survival time of control animals.
Method details
Multiplexed immunofluorescence staining in human samples
4-colour multiplex immunofluorescence protocol based on tyramide signal amplification (TSA) was developed for simultaneous detection of TIM-3+ (45208S, CST), H3K27M+ (ABE419, MERK), CD68+ (IR613, DAKO) and CD3+ (IR503, DAKO) cells in formalin-fixed paraffin-embedded (FFPE) specimens. Briefly, 4-μm thick sections obtained from FFPE tissue blocks were deparaffinized, rehydrated and fixed with formaldehyde:methanol (1:10). Each section was put through sequential rounds of antibody staining, including heat induced antigen retrieval with citrate (pH6, PerkinElmer) or EDTA (pH9, Dako) target retrieval solution, protein blocking with Antibody Diluent/Block (Akoya Bioscience), incubation with primary antibody and anti-mouse/rabbit secondary antibodies (Akoya Bioscience) followed by TSA amplification with fluorophores Opal 570, Opal 520, Opal 480 and Opal 620 (Akoya Biosciences) respectively diluted in 1X Plus Amplification Diluent (Akoya Biosciences). After all five sequential rounds, nuclei were counterstained with spectral DAPI (Akoya Biosciences) and sections were mounted with Faramount Aqueous Mounting Medium (Dako). The histone mutations and the age of the different patients are indicated in the Figure S10A.
Immunohistochemical staining for TIM-3 in human samples
Immunohistochemical staining was conducted on FFPE tissue sections; the sections were stained with a Bond Polymer Refine Detection kit and an anti-TIM-3 antibody (1:100, Clone D5D5R, Cell Signaling Technology) and counterstained with hematoxylin using a Leica BOND-RXm (Leica Biosystems, Barcelona, Spain). Tonsil tissue was used as a positive control.
Multiplex immunofluorescence in murine samples
A multiplex immunolabeling protocol based on tyramide signal amplification (TSA) and Opal fluorophores was developed and validated. Briefly, paraffin-embedded sections of mouse brains were deparaffinized, hydrated, and treated with peroxidase. Then, each section was subjected to sequential rounds of antibody staining, which each included heat-induced antigen retrieval at pH 6 and protein blocking with 20% normal goat serum (Dako) in PBS. Finally, the sections were incubated with a primary antibody and secondary antibody conjugated to HRP (Dako), followed by TSA visualization with the fluorophores Opal 520, Opal 540, Opal 570, Opal 620, Opal 650, and Opal 690 (Akoya Biosciences). The primary antibodies included anti-TIM-3 (1:200, Cell Signaling Technology), anti-CD4 (1:400, Cell Signaling Technology), anti-FOXP3 (1:600, Cell Signaling Technology), anti-TMEM119 (1:400, Cell Signaling Technology), and anti-F4/80 (1:400, Cell Signaling Technology). After 6 sequential reactions, nuclei were counterstained with spectral DAPI (Akoya Biosciences), and the sections were mounted with Diamond antifade mountant (Life Technologies). Multiplex immunofluorescence slides were scanned on a Vectra-Polaris Automated Quantitative Pathology Imaging System (Akoya Biosciences). The whole tissue present in a single FFPE tissue section was imaged, spectrally unmixed, and exported as a component TIF image tile using Akoya Biosciences Inform software (version 2.4.8). The component TIF image tiles were then imported into the open-source digital pathology software QuPath version 0.2.0-m9 and stitched together using the x-y coordinates to create a new pyramidal TIF file.
Immunohistochemical analysis for murine samples
Paraffin-embedded mouse brain sections were first stained with hematoxylin and eosin for tumor analysis. Once tumor status was confirmed, the remaining staining experiments were performed with antibodies against PD-1 (84651, CST), galectin-9 (ab216479, Abcam), CEACAM1 (PA5-114988, Thermo Fisher), TIM-3 (83882, CST) and H3K27M (ab190631, Abcam). For immunohistochemical staining, Vectastain ABC kits (Vector Laboratories Inc.) were used according to the manufacturer’s instructions. The number of positively stained cells per mm2 was quantified using the Fiji platform.
Radiolabelling of Ab with 67-gallium
Two milligrams of the monoclonal antibody [] was adjusted to pH 8 by buffer exchange with a G-25 column (Cytiva, Fisher Sci) using an elution buffer of 0.1M NaHCO3. Then, 20 μL was incubated at 37°C for 1 hour with a 5-fold molar excess of the chelator p-NCS-benzyl-NODAGA (Chematech, France). Then, the excess of the chelator was eliminated by molecular exclusion using a 0.25M sodium acetate solution supplemented with 5 mg/mL of gentisic acid. After this, the NODAGA-conjugated antibody was stored in a dark container at 4° overnight. The day after, 185 MBq of gallium-67, (gallium chloride), was diluted to a volume of 200 μL with 1M HCl, and added to an 800 μL of the NODAGA-conjugated antibody solution (approximately 1.2 mg of antibody). The mixture was incubated at room temperature for 45 minutes, obtaining a radiochemical yield of around 33%. Finally, free gallium-67 was removed by size exclusion purification and concentrated with an Amicon 30K.
SPECT/CT in vivo biodistribution studies
For biodistribution studies, each animal received one single dose of radiolabeled Ab (intratumoral: 0,25 MBq, n=2; intraperitoneal: 4 MBq, n=2). Single photon emission computed tomography (SPECT) scans were acquired in a U-SPECT6/E-class (MILabs) using a UHR-RM collimator. Images were acquired 1, 3- and 7-days post-administration of 67Ga-Ab. Additionally, for intratumoral administration, an image was acquired immediately after the administration. For image acquisition, animals were placed prone on the scanner bed under continuous anesthesia with isoflurane (2 % in 100 % O2 gas). For intraperitoneal administration, a whole-body scan in list mode format was acquired over 2 hours; for intratumoral administration, images of the head were acquired during 1 hour. Following the SPECT acquisition, CT scans were performed to obtain anatomical information using a tube setting of 55 kV and 0,33 mA. The SPECT images were reconstructed using the gallium-67 photopeaks with a 20 % energy window width and using a calibration factor to obtain the activity information (MBq/mL). Finally, attenuation correction was applied using the CT attenuation map. Studies were visualized using PMOD software (PMOD Technologies Ltd., Adliswil, Switzerland). The images corresponding to the same animal were corrected with a numerical factor to compensate the gallium-67 decay. Intraperitoneal images were qualitatively examined to study the biodistribution of the 67Ga-Ab. Intratumoral scans were quantitatively analyzed; for this, a volume of interest was drawn over the tumor to calculate the 67-Ga Ab retention at different time points. The uptake was referred to the value obtained in post-administration images, which was considered the 100% of the administered dose. At 8 days post-injection of 67Ga-Ab, animals were sacrificed to measure the radioactivity in tissues using a gamma counter (Hidex Automatic Gamma Counter, Hidex Oy, Turuk, Finland) calibrated for gallium-67 to calculate the percentage of injected dose per gram (%ID/g). The following tissues were analyzed: tumor, deep and superficial cervical lymph nodes.
Inducible knockdown of human TIM-3 with shRNA
Human DIPG TP54 and HSJD-DIPG-007 cells were transfected with a SMARTvector inducible lentiviral TIM-3-specific shRNA (Horizon Discovery, Waterbeach, United Kingdom). Then, they were selected with 0.5 μg/ml puromycin. Doxycycline (10 μg/ml) was used to induce shRNA expression, and TIM-3 knockdown was confirmed by flow cytometry.
TIM-3 CRISPR/Cas9 knockout
Validated pSpCas9(BB)-2A-GFP(PX458) was purchased from Addgene (Massachusetts, USA). Then, the TIM-3 CRISPR/Cas9 KO plasmid encoding the Cas9 nuclease and a target-specific 22-nt guide RNA (gRNA) were designed for maximum KO efficiency, or a nontargeting guide (control) was used. The two murine TIM-3-specific gRNA sequences were 5′- CACCGTTCTCCAAGAACCCTAACCA-3′ and 5′-CACCGAGCTGTAGTAGAGTCCCCAT-3′. The control guide sequence was 5′-GCGAGGTATTCGGCTCCGCG-3′.56 In this study, the CRISPR/Cas9 knockout plasmid was cotransfected into NP53 cells using fugene HD transfection reagent (Roche, USA) according to ’the manufacturer’s protocol. After 24 hours, NP53 cells were sorted using a FACSAria IIU (Becton Dickinson), with the GFPhigh cells collected. Sequencing confirmed that the cells had disruption of the TIM-3 gene.
Clonogenic assay
A total of 5000 NP53 TIM-3KO or control cells were seeded in a 6-well plate for 14 days. Then, the wells were washed with Dulbecco’s PBS (DPBS) and fixed for 10–15 minutes with 4% formaldehyde. The fixed cells were dyed with 0.5% crystal violet for 5 minutes. Crystal violet was diluted in DPBS/10% acetic acid, and the absorbance was measured at 570 nm. The data are presented as the percentages of three independent experiments.
BrdU proliferation assay
NP53 TIM-3KO cells (150, 500, 1500 or 2000 cells per well) were plated in a 96-well plate in triplicate for each of three independent experiments. Cell proliferation was assayed relative to day zero using the BrdU Cell Proliferation Assay Kit (Cell Signaling #6813) according to the manufacturer’s protocol following a two-hour incubation with BrdU.
Cell viability assays
NP53 TIM-3KO cells (150, 500, 1500 or 2000 cells/well) were seeded in a 96-well plate. Five days later, cell viability was assessed using the Cell-Titer 96 One Solution Aqueous Proliferation Kit (Promega). The data are presented as the percentages of three independent experiments. For murine in vitro antibody treatment, 500 NP53 control guide, G2C9 or G1C7 TIM-3KO were seeded in a 96-well plate. 24h later, three lines were treated with anti-TIM-3 [10μg/ml] or its corresponding IgG. Cell viability was measured every 24h until 5 days after treatment. Similarly, the same number of cells were seeded for Gal-9 (3535-GA-50, R&D System) and CEACAM1 (50571-M08H, SinoBiological) recombinant proteins experiment. The ligands concentration was [5μg/ml] and the viability was measured at days 3 and 7. Treatment results were normalized against the viability of each cell with IgG. For human cells viability assay, 10,000 HSJD-DIPG-007 or TP54 were seeded in a 96-well plate. The same schedule and antibody concentrations were used as in the mouse model and viability was measured 7 days after treatment. The absorbance was measured using a SPECTROstar Nano reader (BMG Labtech, Ortenberg, Germany).
Transwell migration assay
A total of 50000 CRIPR/Cas9 NP53 TIM-3KO cells were seeded in serum-free DMEM, 200 μL of the cell suspension was added to the upper Transwell chamber, and 600 μL of medium containing 20% fetal bovine serum was added to the lower chamber. The upper chamber was carefully immersed in the lower chamber liquid with sterile forceps. The 24-well plate holding the Transwell chamber was incubated in a 37°C incubator for 16 hours. Then, the liquid was removed from the upper chamber, and the chamber was placed in a well containing 600 μL of PBS three times. The wells were washed with DPBS and fixed for 10–15 minutes with 4% formaldehyde. The fixed cells were dyed with 0.5% crystal violet for 5 minutes. Crystal violet was diluted in DPBS/10% acetic acid, and the absorbance was measured at 570 nm. Each experiment was repeated three times.
RNA-seq
RNA-seq was performed by Macrogen (Seoul, South Korea). The mRNA conditions used were 1 μg of total RNA, 20 ng/μl concentration, RIN >7.0, and rRNA ratio >1.0. Libraries for sequencing were prepared using TruSeq stranded mRNA + NovaSeq 6000 100 PE (2 x 100 bp) 50 M total reads/sample (5 Gb/sample). Data analysis was carried out by our bioinformaticians. Raw data have been deposited in GEO (GSE223859).
Immunoblotting
For immunoblotting assays, the samples were subjected to sodium dodecyl sulfate-Tris-glycine gel electrophoresis. Membranes were incubated with antibodies against the following proteins: mTIM-3, (D3M9R, CST, Massachusetts, USA) hTIM-3 (D5D5R, CST), Gal-9 (54330, CST), Vinculin (13901, CST), CEACAM1 (14771, CST) and GRB-2 (610111, BD Biosciences). For validation of RNA-seq–identified pathways, membranes were incubated with antibodies against the following proteins: AKT (4685, CST), pAKT308 (9275, CST), pAKT473 (9271, CST) S6 (2217, CST), pS6 (2211, CST), ERK 1/2 (9102, CST), pERK1/2 (9101, CST), IKBα (9242, CST), c-Jun (9165, CST), p38 (9212, CST), PTEN (9559, CST), MEK1 (9124. CST), pMEK1 (9128, CST) and Vinculin (4650, CST). Membranes were developed according to Amersham’s enhanced chemiluminescence protocol.
Flow cytometry
Excised tumors and draining lymph nodes for all experiments were mechanically dissociated using a scalpel, incubated with collagenase IV/DNase I (17018-029 Gibco/11284932001 Roche) with rotation for 15 minutes and then incubated twice for 10 minutes at 37°C. The solution was filtered through a 70-μm cell strainer (Thermo Fisher Scientific, Waltham, Massachusetts, USA), and after the addition of a 30% Percoll solution (17-0891-01 GE Healthcare, Chicago, IL, USA), tumor cells were isolated by centrifugation at 500×g for 20 minutes. Single-cell suspensions were then stained for flow cytometry. Dead cells were excluded by PromoFluor-840 staining (1:10,000, PK-PF840-3-01). The fluorochrome-tagged monoclonal antibodies (mAbs) used in this assay are listed in STAR Methods. For nuclear staining, cells were fixed and permeabilized using BD Cytofix/Cytoperm Plus (555028 BD Biosciences) and then stained according to the manufacturer’s instructions. The remaining samples were then analyzed using a CytoFLEX (Beckman Coulter) and FlowJo software (BD Biosciences). Flow gating strategy used for all tumor microenvironment immune population characterization experiments was the same (Figure S10B).
IFN-γ ELISPOT
NP53 cells were incubated with recombinant murine IFN-γ (100 IU/mL). Twenty-four hours later, tumor-infiltrating lymphocytes (TILs) were isolated from mice and cocultured with the NP53 cells (ratio of 10:1) for 24 hours in a 96-well plate. A mouse IFN-γ ELISPOT set (551083 BD) was used according to the manufacturer’s instructions, and the results were measured using an Immunospot S6 Analyzer (Macro, Immunospot). The results of the IFN-γ ELISPOT were normalized per 103 TILs.
Chemokine and cytokine LEGENDplex assay
LEGENDplex mouse inflammation and proinflammatory chemokine panels (BioLegend, USA) were used to estimate the concentrations of selected inflammatory cytokines and chemokines in the TME. The LEGENDplex assay was performed according to the manufacturer’s procedure. Samples were acquired on a CytoFLEX (Beckman Coulter) with a 488-nm laser and a 536/40 (BP) filter for the fluorochrome PE and a 638-nm laser and 675/20 (BP) filter for the fluorochrome APC. The results were analyzed using LEGENDplex Data Analysis Software V.8.0 (Vigene Tech Inc., USA). The concentration of each growth factor/cytokine was determined by means of a standard curve generated during the assay.
In vivo rechallenge and depletion studies
For rechallenge experiments, mice that survived three times longer than the median survival time of the control group were orthotopically reimplanted with the same number of tumor cells (104 NP53 cells or 103 XFM cells). In the rechallenge experiment performed with FTY720, mice were treated with 0.5 μg/g per mouse daily starting 24 hours before cell implantation. For depletion experiments, mice were treated 5 times intraperitoneally with 200 μg of anti-NK1.1 (BioXCell; clone PK136), anti-CD4 (BioXCell; clone GK1.5), anti-CD8β (BioXCell; clone 53-5.8) or a corresponding IgG2b antibody (BioXCell); the antibodies were administered every 4 days beginning two days after cell implantation. PLX-3397 (MedChemExpress) was administered orally at 50 mg/kg every day beginning on the day before of first antibody administration. We evaluated whether these depletions worked by measuring the appropriate populations in the blood 2 days after the first administration of the antibody.
Quantification and statistical analysis
Bioinformatic analyses
The public datasets used in this study were downloaded from PedcBioPortal (https://pedcbioportal.org/), Kids First Data Resource Portal (https://portal.kidsfirstdrc.org) and the St. Jude dataset (https://pecan.stjude.cloud/proteinpaint/HAVCR2). First, filtering of the gene expression data of DIPG patients was performed with R/Bioconductor. Genes with an expression level lower than the noise signal in more than 50% of the samples were considered to be not expressed. A table with data on the H3 mutational status and age of the PNOC patients included in the analysis of TIM-3 expression and other immune markers is included in the supplementary data (Figure S10C).
scRNA-seq data processing
Whole transcriptome amplification, library construction and sequencing were performed using the smart-seq2 protocol.57 Expression levels were quantified as Ei,j=log2(TPMi,j/10+1), where TPMi,j refers to the transcripts per million for gene i in sample j, as calculated by RSEM. TPM values were divided by 10 since we estimated the complexity of single-cell libraries on the order of 100,000 transcripts and wanted to avoid counting each transcript ∼10 times, as would be the case with TPM, which could inflate the difference between the expression level of a gene in cells in which the gene was detected and that in those in which it was not detected. For each cell, we calculated two quality measures: the number of genes for which at least one read was mapped and the average expression level of a curated list of housekeeping genes. We then conservatively excluded all cells with either fewer than 2500 detected genes or an average housekeeping expression level (E, as defined above) below 2.5. For the remaining cells, we calculated the aggregate expression of each gene as Ea(i)=log2(average (TPMi,1...n) +1) and excluded genes with Ea<4. For the remaining cells and genes, we defined relative expression by centering the expression levels, Eri,j=Ei,javerage[Ei,1...n]. This dataset consisted of 2244 cells across 66 DIPG patients with the 3 different status of histone 3 (Figure S10D).
Statistical analysis
Data are presented as the means±SEM of a minimum of three biological replicates and were compared using Student’s t test. Multiple comparisons were made by one-way ANOVA with the post hoc Bonferroni test. A P value <0.05 was considered significant. The survival rate was evaluated using Kaplan‒Meier curves, and statistical analyses were performed with the log-rank test. GraphPad Prism software was used for the statistical analyses. ns, P>0.05; ∗P<0.05; ∗∗P<0.01; ∗∗∗P<0.001; ∗∗∗∗P<0.0001.
Acknowledgments
The performed work was supported through Predoctoral Fellowships from Gobierno de Navarra (VL), and Instituto de Salud Carlos III (DdlN), a Postdoctoral Fellowship ChadTough-Defeat DIPG (MGM). Plan de colaboración Internacional (PCI2021-122084-2B) Spanish Ministry of Science and Innovation and Blanca Morell Foundation (SL). ChadTough-Defeat DIPG (MMA), AECC General Projects (PRYGN21937; MMA), Instituto de Salud Carlos III y Fondos Feder (PI19/01896 MMA, PI18/00164 APG “A way to make Europe”); El sueño de Vicky; Asociación Pablo Ugarte, Foundations ADEY, ACS, Hay que tomarse la vida con tumor; + Investigación + Vida (La Guareña) (APG and MMA). Red Española de Terapias Avanzadas TERAV ISCIII (RD21/0001/0022; Financiado por la Unión Europea-Next GenerationEU. Plan de Recuperación Transformación y Resiliencia). This project also received funding from the European Research Council (ERC) under the European Union's Horizon 2020 Research and Innovation Programme (817884 ViroPedTher to MMA).
Author contributions
Conception and design: I.A.M. and MMA.
Development of methodology: All authors.
Acquisition of data (provided animals, acquired and managed patients, provided facilities, etc.): All authors.
Analysis and interpretation of the data (e.g., statistical analysis, biostatistics, and computational analysis): All authors.
Writing, review, and/or revision of the manuscript: All authors.
Administrative, technical, or material support (i.e., reporting or organizing data and constructing databases): All authors.
Study supervision: S.L., F..P., and M.M.A.
Declaration of interests
A.C.A. is a member of the SAB for Tizona Therapeutics, Trishula Therapeutics, Compass Therapeutics, Zumutor Biologics, ImmuneOncia, and Excepgen, which have interests in cancer immunotherapy. A.C.A. is a paid consultant for iTeos Therapeutics and Larkspur Biosciences. A.C.A.’s interests were reviewed and managed by the Brigham and Women’s Hospital. The rest of authors do not have potential conflicts of interest to disclose.
Inclusion and diversity
We support inclusive, diverse, and equitable conduct of research.
Published: October 5, 2023
Footnotes
Supplemental information can be found online at https://doi.org/10.1016/j.ccell.2023.09.001.
Supplemental information
Data and code availability
RNA-seq data have been deposited in GEO and are publicly available as of the date of publication. Accession numbers are listed in the key resources table. The microscopy data reported in this paper will be shared by the lead contact upon request. Any additional information required to reanalyze the data reported in this paper is available from the lead contact upon request.
References
- 1.Louis D.N., Perry A., Wesseling P., Brat D.J., Cree I.A., Figarella-Branger D., Hawkins C., Ng H.K., Pfister S.M., Reifenberger G., et al. The 2021 WHO classification of tumors of the central nervous system: A summary. Neuro Oncol. 2021;23:1231–1251. doi: 10.1093/neuonc/noab106. [DOI] [PMC free article] [PubMed] [Google Scholar]
- 2.Cooney T., Lane A., Bartels U., Bouffet E., Goldman S., Leary S.E.S., Foreman N.K., Packer R.J., Broniscer A., Minturn J.E., et al. Contemporary survival endpoints: An international diffuse intrinsic pontine glioma registry study. Neuro Oncol. 2017;19:1279–1280. doi: 10.1093/neuonc/nox107. [DOI] [PMC free article] [PubMed] [Google Scholar]
- 3.Hoffman L.M., Veldhuijzen van Zanten S.E.M., Colditz N., Baugh J., Chaney B., Hoffmann M., Lane A., Fuller C., Miles L., Hawkins C., et al. Clinical, radiologic, pathologic, and molecular characteristics of long-term survivors of Diffuse Intrinsic Pontine Glioma (DIPG): A collaborative report from the International and European Society for Pediatric Oncology DIPG registries. J. Clin. Oncol. 2018;36:1963–1972. doi: 10.1200/JCO.2017.75.9308. [DOI] [PMC free article] [PubMed] [Google Scholar]
- 4.Mackay A., Burford A., Carvalho D., Izquierdo E., Fazal-Salom J., Taylor K.R., Bjerke L., Clarke M., Vinci M., Nandhabalan M., et al. Integrated Molecular Meta-Analysis of 1,000 Pediatric High-Grade and Diffuse Intrinsic Pontine Glioma. Cancer Cell. 2017;32:520–537.e5. doi: 10.1016/j.ccell.2017.08.017. [DOI] [PMC free article] [PubMed] [Google Scholar]
- 5.El-Khouly F.E., Veldhuijzen van Zanten S.E.M., Santa-Maria Lopez V., Hendrikse N.H., Kaspers G.J.L., Loizos G., Sumerauer D., Nysom K., Pruunsild K., Pentikainen V., et al. Diagnostics and treatment of diffuse intrinsic pontine glioma: where do we stand? J. Neuro Oncol. 2019;145:177–184. doi: 10.1007/s11060-019-03287-9. [DOI] [PMC free article] [PubMed] [Google Scholar]
- 6.Panditharatna E., Yaeger K., Kilburn L.B., Packer R.J., Nazarian J. Clinicopathology of diffuse intrinsic pontine glioma and its redefined genomic and epigenomic landscape. Cancer Genet. 2015;208:367–373. doi: 10.1016/j.cancergen.2015.04.008. [DOI] [PubMed] [Google Scholar]
- 7.Kline C., Liu S.J., Duriseti S., Banerjee A., Nicolaides T., Raber S., Gupta N., Haas-Kogan D., Braunstein S., Mueller S. Reirradiation and PD-1 inhibition with nivolumab for the treatment of recurrent diffuse intrinsic pontine glioma: a single-institution experience. J. Neuro Oncol. 2018;140:629–638. doi: 10.1007/s11060-018-2991-5. [DOI] [PubMed] [Google Scholar]
- 8.Lin G.L., Nagaraja S., Filbin M.G., Suvà M.L., Vogel H., Monje M. Non-inflammatory tumor microenvironment of diffuse intrinsic pontine glioma. Acta Neuropathol. Commun. 2018;6:51. doi: 10.1186/s40478-018-0553-x. [DOI] [PMC free article] [PubMed] [Google Scholar]
- 9.Lieberman N.A.P., Degolier K., Kovar H.M., Davis A., Hoglund V., Stevens J., Winter C., Deutsch G., Furlan S.N., Vitanza N.A., et al. Characterization of the immune microenvironment of diffuse intrinsic pontine glioma: implications for development of immunotherapy Key Points. Neuro Oncol. 2019;21:83–94. doi: 10.1093/neuonc/noy145. [DOI] [PMC free article] [PubMed] [Google Scholar]
- 10.Monney L., Sabatos C.A., Gaglia J.L., Ryu A., Waldner H., Chernova T., Manning S., Greenfield E.A., Coyle A.J., Sobel R.A., et al. Th1-specific cell surface protein Tim-3 regulates macrophage activation and severity of an autoimmune disease. Nature. 2002;415:536–541. doi: 10.1038/415536a. [DOI] [PubMed] [Google Scholar]
- 11.Liu J.F., Wu L., Yang L.L., Deng W.W., Mao L., Wu H., Zhang W.F., Sun Z.J. Blockade of TIM3 relieves immunosuppression through reducing regulatory T cells in head and neck cancer. J. Exp. Clin. Cancer Res. 2018;37:44–48. doi: 10.1186/s13046-018-0713-7. [DOI] [PMC free article] [PubMed] [Google Scholar]
- 12.So E.C., Khaladj-ghom A., Ji Y., Amin J., Song Y., Burch E., Zhou H., Sun H., Chen S., Bentzen S., et al. Immunobiology NK cell expression of Tim-3 : First impressions matter. Immunobiology. 2019;224:362–370. doi: 10.1016/j.imbio.2019.03.001. [DOI] [PubMed] [Google Scholar]
- 13.Ndhlovu L.C., Lopez-Vergès S., Barbour J.D., Jones R.B., Jha A.R., Long B.R., Schoeffler E.C., Fujita T., Nixon D.F., Lanier L.L. Tim-3 marks human natural killer cell maturation and suppresses cell-mediated cytotoxicity. 2012;119:3734–3743. doi: 10.1182/blood-2011-11-392951. [DOI] [PMC free article] [PubMed] [Google Scholar]
- 14.Fonslow B.R., Stein B.D., Webb K.J., Xu T., Choi J., Park S.K., Yates J.R., 3rd Tumor-infiltrating DCs suppress nucleic acid–mediated innate immune responses through interactions between the receptor TIM-3 and the alarmin HMGB1. Nat. Methods. 2013;10:54–56. doi: 10.1038/ni.2376. [DOI] [PMC free article] [PubMed] [Google Scholar]
- 15.Dixon K.O., Tabaka M., Schramm M.A., Xiao S., Tang R., Dionne D., Anderson A.C., Rozenblatt-Rosen O., Regev A., Kuchroo V.K. TIM-3 restrains anti-tumour immunity by regulating inflammasome activation. Nature. 2021;595:101–106. doi: 10.1038/s41586-021-03626-9. [DOI] [PMC free article] [PubMed] [Google Scholar]
- 16.Komohara Y., Morita T., Annan D.A., Horlad H., Ohnishi K., Yamada S., Nakayama T., Kitada S., Suzu S., Kinoshita I., et al. The Coordinated Actions of TIM-3 on Cancer and Myeloid Cells in the Regulation of Tumorigenicity and Clinical Prognosis in Clear Cell Renal Cell Carcinomas. Cancer Immunol. Res. 2015;3:999–1007. doi: 10.1158/2326-6066.CIR-14-0156. [DOI] [PubMed] [Google Scholar]
- 17.Chen Z.Q., Yu H., Li H.Y., Shen H.T., Li X., Zhang J.Y., Zhang Z.W., Wang Z., Chen G. Negative regulation of glial Tim-3 inhibits the secretion of inflammatory factors and modulates microglia to antiinflammatory phenotype after experimental intracerebral hemorrhage in rats. CNS Neurosci. Ther. 2019;25:674–684. doi: 10.1111/cns.13100. [DOI] [PMC free article] [PubMed] [Google Scholar]
- 18.Koh H.S., Chang C.Y., Jeon S.B., Yoon H.J., Ahn Y.H., Kim H.S., Kim I.H., Jeon S.H., Johnson R.S., Park E.J. The HIF-1/glial TIM-3 axis controls inflammation-associated brain damage under hypoxia. Nat. Commun. 2015;6:6340–6415. doi: 10.1038/ncomms7340. [DOI] [PMC free article] [PubMed] [Google Scholar]
- 19.Wiener Z., Kohalmi B., Pocza P., Jeager J., Tolgyesi G., Toth S., Gorbe E., Papp Z., Falus A. TIM-3 Is Expressed in Melanoma Cells and Is Upregulated in TGF-Beta Stimulated Mast Cells. J. Invest. Dermatol. 2007;127:906–914. doi: 10.1038/sj.jid.5700616. [DOI] [PubMed] [Google Scholar]
- 20.Shang Y., Li Z., Li H., Xia H., Lin Z. TIM-3 expression in human osteosarcoma: Correlation with the expression of epithelial-mesenchymal transition-specific biomarkers. Oncol. Lett. 2013;6:490–494. doi: 10.3892/ol.2013.1410. [DOI] [PMC free article] [PubMed] [Google Scholar]
- 21.Schatton T., Itoh Y., Martins C., Rasbach E., Singh P., Silva M., Mucciarone K., Heppt M.V., Geddes-Sweeney J., Stewart K., et al. Inhibition of melanoma cell-intrinsic Tim-3 stimulates MAPK-dependent tumorigenesis. Cancer Res. 2022;82:3774–3784. doi: 10.1158/0008-5472.CAN-22-0970. [DOI] [PMC free article] [PubMed] [Google Scholar]
- 22.Zhang H., Song Y., Yang H., Liu Z., Gao L., Liang X., Ma C. Tumor cell-intrinsic Tim-3 promotes liver cancer via NF-κB/IL-6/STAT3 axis. Oncogene. 2018;37:2456–2468. doi: 10.1038/s41388-018-0140-4. [DOI] [PubMed] [Google Scholar]
- 23.Guo Q., Shen S., Guan G., Zhu C., Zou C., Cao J., Cheng W., Xu X., Yu J., Lin Z., et al. Cancer cell intrinsic TIM-3 induces glioblastoma progression. iScience. 2022;25:105329. doi: 10.1016/j.isci.2022.105329. [DOI] [PMC free article] [PubMed] [Google Scholar]
- 24.Filbin M.G., Tirosh I., Hovestadt V., Shaw M.L., Escalante L.E., Mathewson N.D., Neftel C., Frank N., Pelton K., Hebert C.M., et al. Developmental and oncogenic programs in H3K27M gliomas dissected by single-cell RNA-seq. Science (1979) 2018;360:331–335. doi: 10.1126/science.aao4750. [DOI] [PMC free article] [PubMed] [Google Scholar]
- 25.Liu I., Jiang L., Samuelsson E.R., Marco Salas S., Beck A., Hack O.A., Jeong D., Shaw M.L., Englinger B., LaBelle J., et al. The landscape of tumor cell states and spatial organization in H3-K27M mutant diffuse midline glioma across age and location. Nat. Genet. 2022;54:1881–1894. doi: 10.1038/s41588-022-01236-3. [DOI] [PMC free article] [PubMed] [Google Scholar]
- 26.Miklja Z., Yadav V.N., Cartaxo R.T., Siada R., Thomas C.C., Cummings J.R., Mullan B., Stallard S., Paul A., Bruzek A.K., et al. Everolimus improves the efficacy of dasatinib in PDGFRα-driven glioma. J. Clin. Invest. 2020;130:5313–5325. doi: 10.1172/JCI133310. [DOI] [PMC free article] [PubMed] [Google Scholar]
- 27.Du Chatinier A., Meel M.H., Das A.I., Metselaar D.S., Waranecki P., Bugiani M., Breur M., Simonds E.F., Lu E.D., Weiss W.A., et al. Generation of immunocompetent syngeneic allograft mouse models for pediatric diffuse midline glioma. Neurooncol. Adv. 2022;4 doi: 10.1093/noajnl/vdac079. vdac079-12. [DOI] [PMC free article] [PubMed] [Google Scholar]
- 28.Di Ruscio V., Del Baldo G., Fabozzi F., Vinci M., Cacchione A., de Billy E., Megaro G., Carai A., Mastronuzzi A. Pediatric Diffuse Midline Gliomas: An Unfinished Puzzle. Diagnostics. 2022;12 doi: 10.3390/diagnostics12092064. [DOI] [PMC free article] [PubMed] [Google Scholar]
- 29.Warren K.E. Beyond the blood: Brain barrier: The importance of central nervous system (CNS) pharmacokinetics for the treatment of CNS tumors, including diffuse intrinsic pontine glioma. Front. Oncol. 2018;8:239. doi: 10.3389/fonc.2018.00239. [DOI] [PMC free article] [PubMed] [Google Scholar]
- 30.Gállego Pérez-Larraya J., Garcia-Moure M., Labiano S., Patiño-García A., Dobbs J., Gonzalez-Huarriz M., Zalacain M., Marrodan L., Martinez-Velez N., Puigdelloses M., et al. Oncolytic DNX-2401 Virus for Pediatric Diffuse Intrinsic Pontine Glioma. N. Engl. J. Med. 2022;386:2471–2481. doi: 10.1056/NEJMoa2202028. [DOI] [PubMed] [Google Scholar]
- 31.Vitanza N.A., Wilson A.L., Huang W., Seidel K., Brown C., Gustafson J.A., Yokoyama J.K., Johnson A.J., Baxter B.A., Koning R.W., et al. 2023. Intraventricular B7-H3 CAR T Cells for Diffuse Intrinsic Pontine Glioma: Preliminary First-In-Human Bioactivity and Safety. 10.1158/2159-8290.CD-22-0750/3232584/cd-22-0750.pdf. [DOI] [PMC free article] [PubMed] [Google Scholar]
- 32.Szychot E., Walker D., Collins P., Hyare H., Shankar A., Bienemann A., Hollingworth M., Gill S. Clinical experience of convection-enhanced delivery (CED) of carboplatin and sodium valproate into the pons for the treatment of diffuse intrinsic pontine glioma (DIPG) in children and young adults after radiotherapy. Int. J. Clin. Oncol. 2021;26:647–658. doi: 10.1007/s10147-020-01853-0. [DOI] [PubMed] [Google Scholar]
- 33.Heiss J.D., Jamshidi A., Shah S., Martin S., Wolters P.L., Argersinger D.P., Warren K.E., Lonser R.R. Phase I trial of convection-enhanced delivery of IL13-Pseudomonas toxin in children with diffuse intrinsic pontine glioma. J. Neurosurg. Pediatr. 2018;23:333–342. doi: 10.3171/2018.9.PEDS17225. [DOI] [PMC free article] [PubMed] [Google Scholar]
- 34.Fu B., Wang F., Sun R., Ling B., Tian Z., Wei H. CD11b and CD27 reflect distinct population and functional specialization in human natural killer cells. Immunology. 2011;133:350–359. doi: 10.1111/j.1365-2567.2011.03446.x. [DOI] [PMC free article] [PubMed] [Google Scholar]
- 35.van Hooren L., Vaccaro A., Ramachandran M., Vazaios K., Libard S., van de Walle T., Georganaki M., Huang H., Pietilä I., Lau J., et al. Agonistic CD40 therapy induces tertiary lymphoid structures but impairs responses to checkpoint blockade in glioma. Nat. Commun. 2021;12:4127. doi: 10.1038/s41467-021-24347-7. [DOI] [PMC free article] [PubMed] [Google Scholar]
- 36.Omuro A., Vlahovic G., Lim M., Sahebjam S., Baehring J., Cloughesy T., Voloschin A., Ramkissoon S.H., Ligon K.L., Latek R., et al. Nivolumab with or without ipilimumab in patients with recurrent glioblastoma: Results from exploratory phase i cohorts of CheckMate 143. Neuro Oncol. 2018;20:674–686. doi: 10.1093/neuonc/nox208. [DOI] [PMC free article] [PubMed] [Google Scholar]
- 37.De Groot J., Penas-Prado M., Alfaro-Munoz K., Hunter K., Pei B.L., O’Brien B., Weathers S.P., Loghin M., Kamiya Matsouka C., Yung W.K.A., et al. Window-of-opportunity clinical trial of pembrolizumab in patients with recurrent glioblastoma reveals predominance of immune-suppressive macrophages. Neuro Oncol. 2020;22:539–549. doi: 10.1093/neuonc/noz185. [DOI] [PMC free article] [PubMed] [Google Scholar]
- 38.Medikonda R., Dunn G., Rahman M., Fecci P., Lim M. A review of glioblastoma immunotherapy. J. Neuro Oncol. 2021;151:41–53. doi: 10.1007/s11060-020-03448-1. [DOI] [PubMed] [Google Scholar]
- 39.Persson M.L., Douglas A.M., Alvaro F., Faridi P., Larsen M.R., Alonso M.M., Vitanza N.A., Dun M.D. The intrinsic and microenvironmental features of diffuse midline glioma: Implications for the development of effective immunotherapeutic treatment strategies. Neuro Oncol. 2022;24:1408–1422. doi: 10.1093/neuonc/noac117. 15. [DOI] [PMC free article] [PubMed] [Google Scholar]
- 40.Mount C.W., Majzner R.G., Sundaresh S., Arnold E.P., Kadapakkam M., Haile S., Labanieh L., Hulleman E., Woo P.J., Rietberg S.P., et al. Potent antitumor efficacy of anti-GD2 CAR T cells in H3-K27M+ diffuse midline gliomas letter. Nat. Med. 2018;24:572–579. doi: 10.1038/s41591-018-0006-x. [DOI] [PMC free article] [PubMed] [Google Scholar]
- 41.Martínez-Vélez N., Garcia-Moure M., Marigil M., González-Huarriz M., Puigdelloses M., Gallego Pérez-Larraya J., Zalacaín M., Marrodán L., Varela-Guruceaga M., Laspidea V., et al. The oncolytic virus Delta-24-RGD elicits an antitumor effect in pediatric glioma and DIPG mouse models. Nat. Commun. 2019;10:2235. doi: 10.1038/s41467-019-10043-0. [DOI] [PMC free article] [PubMed] [Google Scholar]
- 42.Laspidea V., Puigdelloses M., Labiano S., Marrodán L., Garcia-Moure M., Zalacain M., Gonzalez-Huarriz M., Martínez-Vélez N., Ausejo-Mauleon I., de la Nava D., et al. Exploiting 4-1BB immune checkpoint to enhance the efficacy of oncolytic virotherapy for diffuse intrinsic pontine gliomas. JCI Insight. 2022;7 doi: 10.1172/jci.insight.154812. [DOI] [PMC free article] [PubMed] [Google Scholar]
- 43.Majzner R.G., Ramakrishna S., Yeom K.W., Patel S., Chinnasamy H., Schultz L.M., Richards R.M., Jiang L., Barsan V., Mancusi R., et al. GD2-CAR T cell therapy for H3K27M-mutated diffuse midline gliomas. Nature. 2022;603:934–941. doi: 10.1038/s41586-022-04489-4. [DOI] [PMC free article] [PubMed] [Google Scholar]
- 44.Meel M.H., de Gooijer M.C., Metselaar D.S., Sewing A.C.P., Zwaan K., Waranecki P., Breur M., Buil L.C.M., Lagerweij T., Wedekind L.E., et al. Combined Therapy of AXL and HDAC Inhibition Reverses Mesenchymal Transition in Diffuse Intrinsic Pontine Glioma. Clin. Cancer Res. 2020;26:3319–3332. doi: 10.1158/1078-0432.CCR-19-3538. [DOI] [PubMed] [Google Scholar]
- 45.Kim H.-S., Chang C.Y., Yoon H.J., Kim K.S., Koh H.S., Kim S.S., Lee S.-J., Kane L.P., Park E.J. Glial TIM-3 modulates immune responses in the brain tumor microenvironment. Cancer Res. 2020;80:1833–1845. doi: 10.1158/0008-5472.CAN-19-2834. [DOI] [PMC free article] [PubMed] [Google Scholar]
- 46.Jurga A.M., Paleczna M., Kuter K.Z. Overview of General and Discriminating Markers of Differential Microglia Phenotypes. Front. Cell. Neurosci. 2020;14:198–218. doi: 10.3389/fncel.2020.00198. [DOI] [PMC free article] [PubMed] [Google Scholar]
- 47.Wang S., Mustafa M., Yuede C.M., Salazar S.V., Kong P., Long H., Ward M., Siddiqui O., Paul R., Gilfillan S., et al. Anti-human TREM2 induces microglia proliferation and reduces pathology in an Alzheimer’s disease model. J. Exp. Med. 2020;217 doi: 10.1084/jem.20200785. [DOI] [PMC free article] [PubMed] [Google Scholar]
- 48.Tan W., Su P.Y.P., Leff J., Gao X., Chen J., Guan A.K., Kalyanasundaram G., Ma A., Guan Z. Distinct phases of adult microglia proliferation: a Myc-mediated early phase and a Tnfaip3-mediated late phase. Cell Discov. 2022;8:34. doi: 10.1038/s41421-022-00377-3. [DOI] [PMC free article] [PubMed] [Google Scholar]
- 49.Huang Y., Xu Z., Xiong S., Sun F., Qin G., Hu G., Wang J., Zhao L., Liang Y.X., Wu T., et al. Repopulated microglia are solely derived from the proliferation of residual microglia after acute depletion. Nat. Neurosci. 2018;21:530–540. doi: 10.1038/s41593-018-0090-8. [DOI] [PubMed] [Google Scholar]
- 50.Gallizioli M., Miró-Mur F., Otxoa-de-Amezaga A., Cugota R., Salas-Perdomo A., Justicia C., Brait V.H., Ruiz-Jaén F., Arbaizar-Rovirosa M., Pedragosa J., et al. Dendritic Cells and Microglia Have Non-redundant Functions in the Inflamed Brain with Protective Effects of Type 1 cDCs. Cell Rep. 2020;33:108291. doi: 10.1016/j.celrep.2020.108291. [DOI] [PMC free article] [PubMed] [Google Scholar]
- 51.Joly-Amado A., Hunter J., Quadri Z., Zamudio F., Rocha-Rangel P.V., Chan D., Kesarwani A., Nash K., Lee D.C., Morgan D., et al. CCL2 Overexpression in the Brain Promotes Glial Activation and Accelerates Tau Pathology in a Mouse Model of Tauopathy. Front. Immunol. 2020;11:997–1017. doi: 10.3389/fimmu.2020.00997. [DOI] [PMC free article] [PubMed] [Google Scholar]
- 52.Škuljec J., Sun H., Pul R., Bénardais K., Ragancokova D., Moharregh-Khiabani D., Kotsiari A., Trebst C., Stangel M. CCL5 induces a pro-inflammatory profile in microglia in vitro. Cell. Immunol. 2011;270:164–171. doi: 10.1016/j.cellimm.2011.05.001. [DOI] [PubMed] [Google Scholar]
- 53.Mowat C., Mosley S.R., Namdar A., Schiller D., Baker K. Anti-tumor immunity in mismatch repair-deficient colorectal cancers requires type I IFN–driven CCL5 and CXCL10. J. Exp. Med. 2021;218 doi: 10.1084/jem.20210108. [DOI] [PMC free article] [PubMed] [Google Scholar]
- 54.House I.G., Savas P., Lai J., Chen A.X.Y., Oliver A.J., Teo Z.L., Todd K.L., Henderson M.A., Giuffrida L., Petley E.V., et al. Macrophage-derived CXCL9 and CXCL10 are required for antitumor immune responses following immune checkpoint blockade. Clin. Cancer Res. 2020;26:487–504. doi: 10.1158/1078-0432.CCR-19-1868. [DOI] [PubMed] [Google Scholar]
- 55.Peranzoni E., Lemoine J., Vimeux L., Feuillet V., Barrin S., Kantari-Mimoun C., Bercovici N., Guérin M., Biton J., Ouakrim H., et al. Macrophages impede CD8 T cells from reaching tumor cells and limit the efficacy of anti–PD-1 treatment. Proc. Natl. Acad. Sci. USA. 2018;115:E4041–E4050. doi: 10.1073/pnas.1720948115. [DOI] [PMC free article] [PubMed] [Google Scholar]
- 56.Wang C., Cui A., Bukenya M., Aung A., Pradhan D., Whittaker C.A., Agarwal Y., Thomas A., Liang S., Amlashi P., et al. Reprogramming NK cells and macrophages via combined antibody and cytokine therapy primes tumors for elimination by checkpoint blockade. Cell Rep. 2021;37:110021. doi: 10.1016/j.celrep.2021.110021. [DOI] [PMC free article] [PubMed] [Google Scholar]
- 57.Molgora M., Esaulova E., Vermi W., Hou J., Chen Y., Luo J., Brioschi S., Bugatti M., Omodei A.S., Ricci B., et al. TREM2 Modulation Remodels the Tumor Myeloid Landscape Enhancing Anti-PD-1 Immunotherapy. Cell. 2020;182:886–900.e17. doi: 10.1016/j.cell.2020.07.013. [DOI] [PMC free article] [PubMed] [Google Scholar]
Associated Data
This section collects any data citations, data availability statements, or supplementary materials included in this article.
Supplementary Materials
Data Availability Statement
RNA-seq data have been deposited in GEO and are publicly available as of the date of publication. Accession numbers are listed in the key resources table. The microscopy data reported in this paper will be shared by the lead contact upon request. Any additional information required to reanalyze the data reported in this paper is available from the lead contact upon request.