

Abstract
Background:
With the rising prevalence of obesity worldwide, it is becoming imperative to detect disturbed glucose metabolism as early as possible in order to prevent type 2 diabetes (T2D) development.
Study design:
The present retrospective observational study aimed to evaluate the relationship between BMI and glucose metabolism, insulin secretion and sensitivity indices, derived from glucose tolerance test (OGTT), in β -TM female patients who were overweight (BMI 25-29.9 kg/m2) and follow its outcome over time.
Subjects and Methods:
Eleven overweight and 11 females with ideal weight and β -TM, matched for age, were recruited. OGTT was undertaken and different indices for β-cell function, insulin sensitivity and insulin secretion were calculated.
Results:
At first evaluation, 7 of 11 overweight β -TM patients (63.6%) and 3 of 11 normal weight β-TM patients (27.2%) had glucose dysregulation (GD) during OGTT. Overweight patients with β-TM had increased HOMA-IR and QUICKI indices associated with decreased Matsuda WBISI index. The mean ± SD duration of follow-up was 4.5 ± 1.2 years. At last observation, 2/11 overweight patients had developed T2D (18.1%). In patients with normal weight, GD increased from 3/11 (27.2%) to 5/11 (45.4%), but none developed T2DM. The difference between SF at first and last observation (1,220 ± 702 vs.1,091 ± 454 ng/mL; P: 0.61) was not significant.
Conclusion:
Overweight seems to be an additional risk factor for the development of GD in β-TM patients. This is particularly important in clinical practice, due to the lack of appropriate guidelines dedicated to this group of patients. (www.actabiomedica.it)
Keywords: excess weight, oral glucose tolerance test, glucose homeostasis, insulin secretion and sensitivity, β-thalassemia major
Introduction
Over the last half of the 20th century, the deleterious effects of complications mainly due to iron overload (IOL) in transfusion-dependent thalassemia (TDT), also known as β thalassemia major (β -TM), have been well recognized and studied. At present, endocrine complications constitute a major health issue in a high proportion of β-TM patients, particularly with advanced age (1-4).
In addition to IOL (1-4), other risk factors predisposing to glucose dysregulation (GD) in β -TM include liver dysfunction (5), high body mass index (BMI) (6), zinc deficiency (7,8), genetic factors (9), splenectomy (10,11) and possibly low insulin growth factor -1 (IGF-1) (12). Therefore, it is recommended that patients with β-TM should undergo annual screening for glucose abnormalities, according to international recommendations, starting from the age of 10 years to identify high-risk patients before irreversible pancreatic damage occurs. OGTT remains the preferred screening method as it is more sensitive for GD than fasting plasma glucose (FPG), although it is poorly reproducible (2).
Over the last few decades, the percentage of populations who are overweight or obese has increased worldwide and become a major public health challenge not only in high-income countries but also in middle- and low-income ones. In 2010, the prevalence of overweight and obesity, based on the body mass index (BMI) assessment, in a group of 160 adolescents and adult patients with β -TM was 8.7% and 3.1%, respectively. 57% of the overweight patients were females (De Sanctis V, unpublished data). A recent study of a group of 200 Egyptian patients aged 18– > 32 years with β -TM reported normal BMI in 134 patients (67%), underweight in 47 (23.5%) and overweight in 19 (9.5%). No obese patients were reported (6).
The present retrospective observational study, performed in a single outpatient endocrine clinic, aimed to evaluate the relationship between BMI and glucose metabolism, insulin secretion and sensitivity indices, derived from the oral glucose tolerance test (OGTT), in β -TM female patients who were overweight and to ascertain the outcome of glucose metabolism over time, since, to the best of our knowledge, relative published data are lacking on this subject.
Subjects and methods
Study population and design
Data of β -TM patients ≥ 18 years who were referred, from October 2010 to December 2022, for consultation or second opinion for endocrinological and metabolic problems to an Italian centre (Pediatric and Adolescent Outpatient Clinic, Private Accredited Quisisana Hospital, Ferrara, Italy) were reviewed. Eligible criteria for study inclusion were: (a) β -TM female patients receiving routine blood transfusion and chelation treatment; (b) chronological age > 18 years; (c) BMI between 25 and 29.99 kg/m2; (d) availability of a 3-h OGTT, including plasma glucose (PG) and serum insulin, on first observation and (e) a regular follow-up for a period not less than 3 years.
Exclusion criteria included: non-transfusion-dependent thalassemia (NTDT) patients, subjects previously diagnosed with diabetes mellitus (DM) or on steroid treatment, subjects with incomplete data.
Participants
Eleven female and five male β -TM patients who were overweight were recruited. As there is evidence that gender affects response to OGTT (13), male patients was excluded from the retrospective study. Thus, as a reference group served 11 normal -weight β -TM female patients, matched for age.
The following data were collected in both groups of patients on first observation: demographic characteristics, age at first transfusion, medical history, details of iron chelation therapy, family history of diabetes, splenectomy, physical activity (classified into four categories: sedentary, light exercise, moderate exercise, and heavy exercise) (14), vital signs (blood pressure, heart rate, blood pressure), pubertal status and associated endocrine complications.
Auxological parameters, classifications and definitions
BMI was calculated as body weight/body height2 (Kg/m2). A subject is considered underweight when the BMI is < 18.5, normal when 18.5-24.9 Kg/m2, overweight between 25.0-29.9 Kg/m2, and obese when the BMI is ≥30 Kg/m2 (15). Obesity is subclassified into class 1 (30–34.9 Kg/m2), class 2 (35–39.9 Kg/m2) and class 3 (≥ 40 Kg/m2). At the population level, health complications from excess body fat increase as BMI increases. The presence of associated endocrine complications was defined according to the I-CET guidelines, published in 2013 (16).
Standard 3-h oral glucose tolerance test (OGTT)
OGTT was performed after a 10 h fast, using 1.75 g/kg (75 g dextrose monohydrate in 250 mL water) Venous blood samples were collected at 0, 30, 60,90,120 and 180 min to determine plasma glucose and insulin concentrations. Plasma glucose (PG) was assessed using the glucose oxidase method and the insulin concentration assays by the chemiluminescence immunoassay method using commercial kits.
Normal glucose tolerance (NGT), impaired fasting glucose (IFG), impaired glucose tolerance (IGT) and DM were defined using the criteria of the American Diabetes Association (ADA) (17).
In addition, an isolated 1-hour post-load PG value ≥155 mg/dl (H-NGT) was considered an index of reduced β-cell function (18) and a normal fasting PG and normal 2- h post challenge glucose with any intermediate OGTT plasma glucose level ≥ 200 mg/dL was defined as indeterminate glucose tolerance (INDET) (19).
Although recent evidence shows that hemoglobin A1c (HbA1c) levels rise before the clinical diagnosis of diabetes, allowing diagnosis of GD before the onset of diabetes mellitus (DM) (17), HbA1c was not assessed in this study because its interpretation is still debated, particularly in patients with β -TM (20) and in subjects who are overweight or obese (21).
Calculation of insulin secretion and sensitivity indices derived from OGTT
The detailed methodology has been published previously (2,12,18). Insulin secretion was evaluated by two methods: (a) Early-phase insulin secretion index (IGI: Δ 0-30 insulin/Δ 0-30 glucose min) (22) and (b) corrected insulin response (CIR) [I30 .100/G30 (G30-70)] (23). CIR describes the β-cell secretion capacity; lower CIRs suggest insulin hyposecretion for the glucose level, and higher CIR suggests insulin hypersecretion. The trapezoidal rule was used to calculate the incremental area under the curve (AUC) for AUCGlu 0-120 and insulin (AUCIns 0-120).
For the determination of insulin sensitivity/resistance the following indices were used: (a) Homeostatic Model Assessment of Insulin Resistance (HOMA- IR), (b) Quantitative Insulin sensitivity Check Index (QUICKI), and (c) Matsuda Whole Body Insulin Sensitivity Index (WBISI) (24-26). The latter index combines both hepatic and peripheral tissue insulin sensitivity. It is calculated from plasma glucose (mg/dL) and insulin (μIU/mL) concentrations in the fasting state and during OGTT.
The hyperbolic relationship between β-cell response and insulin sensitivity (IS) is called disposition index (DI). A decrease in DI is an indication of altered β-cell function, resulting in inability to compensate for decreased IS (e.g., impaired glucose tolerance and type 2 diabetes mellitus). Oral disposition index (oDI) was calculated as the product of Matsuda WBISI index and IGI obtained during the OGTT (27).
Other collected data
Other collected data included: alanine aminotransferase (ALT, IU/L), thyroid function (free thyroxine-FT4 and thyrotropin-TSH), morning insulin-like growth factor 1 (IGF-1), basal serum cortisol, gonadotropins (LH and FSH) and estradiol (E2). All parameters were measured by commercial immunoassay kits. Iron overload (IOL) was assessed by serum ferritin (SF) levels and was arbitrarily classified as mild (SF: < 1,000 ng/mL), moderate (SF: >1,000 ng/mL and < 2,000 ng/mL) or severe (SF: >2, 000 ng/mL) (28).
Statistical analysis
All numeric variables were expressed as mean ± standard deviation (SD), range, median and quartile. Comparison of different variables in the two groups was made using unpaired student t-test and Mann-Whitney test for normal and non-parametric variables, respectively. Chi-square (χ2) test was used to compare the frequency of qualitative variables among the different groups. The data obtained were analyzed using Pearson’s correlation test for those with normal distribution or Spearman correlation test for the ones with an abnormal (non- parametric) distribution. For the statistical analysis, a software program was used and validated, according to Alder and Roesser (29).
A P value < 0.05 was considered statistically significant.The correlation coefficient was considered as follows: <0.4 as weak, from ≥ 0.4 to 0.59 moderate, from ≥ 0.6 to 0.79 strong, and ≥ 0.8 very strong, according to Swinscow (30).
Ethics
All procedures were in accordance with the 1975 Helsinki declaration and its later amendment in 2000 (http://www.wma.net). Ethics approval for a retrospective study was not required because patients underwent only routine diagnostic procedures according to the current recommendations or guidelines (2,16,31). Moreover, in our retrospective study, no identifiable private patient’s information was collected, and an anonymized dataset was analyzed (32).
Results
At first consultation (baseline)
Patients’ characteristics: The study included 11 β -TM female overweight patients (BMI range: 26.2- 28.9 Kg/m2) and 11 β -TM female normal -weight patients (BMI range:19.2-23.7 kg/m2), matched for age. IOL assessed by SF in overweight β -TM patients was mild in 5/11(45.4%), moderate in 4/11 (36.3%), and severe in 2/11 patients (18.1%). In β -TM normal weight patients, SF was mild in 8/11 (72.7%), moderate in 1/11 (9.0%), and severe in 2/11 patients (18.1%). After the first evaluation, the referring Centers were invited to check OGTT annually and to require a second consultation if the attending physician thought necessary. Moreover, the patients were recommended to follow regular iron chelation therapy associated with a balanced diet and regular daily physical activity to ensure a healthy lifestyle. Baseline study group characteristics are presented in Table 1.
Table 1.
Comparison of baseline clinical characteristics, laboratory and diagnostic results between 11 overweight β-TM patients and 11 normal-weight β-TM patients, assessed by body mass index (BMI). Data are expressed as mean ± SD and percentages.
| Variables | 11 overweight β-TM patients | 11 normal weight β-TM patients |
P value |
|---|---|---|---|
| Number of β-TM patients | 11 | 11 | - |
| Age (yrs) | 24.1 ± 4.7 | 24.7 ± 2.4 | 0.71 |
| Family history of diabetes | 2/11 | 2/11 | 1.000 |
| Number of splenectomized patients | 3/11 | 5/11 | 0.37 |
| Body Mass Index (kg/m2), range | 27.1 ± 1.1 26.2 - 29.4 |
21.2 ± 1.5 19.2 -23.7 |
<0.0001 - |
| Physical activity (light- moderate) | 11/11 | 11/11 | - |
|
Iron chelation therapy: Desferrioxamine (DFO) (n) Deferiprone (DFP) (n) Deferasirox (DFX) (n) DFO+DFP (n) |
- 4 2 3 2 |
- 5 2 3 1 |
. - - - - |
| SF at first consultation (ng/mL), range | 1,220 ± 702 306 -1,757 |
1,076 ± 659.6 437-1,871 |
0.62 - |
| ALT (normal values: < 40 IU/L) | 30.9 ± 13.8 | 29.2 ± 13 | 0.76 |
| IGF-1 (ng/mL) | 82.7 ± 42.4 (9) | 103.9 ± 38.1 (10) | 0.26 |
PG during OGTT, endocrine complications, final height:
|
- - 4 (36.3%) 4 (36.3%) 1 (9.0%) 0 (0%) 1 (9.0%) 1 (9.0%) 0 (0%) 1/11 (9.0%) 2/11 (18.1%) 5/11 (45.4%) 1/11 (9.0%) 0/11 (0%) 6/11 (54.5%) |
- - 8 (72.7%) 0 (0%) 2 (18.1%) 0 (0%) 0 (0%) 1 (9.0%) 0 (0%) 0/11 (0%) 5/11(45.4%) 4/11 (36.3%) 0/11(0%) 0/11 (0%) 2/11 (18.1%) |
- - 0.08 0.02 0.53 - 0.30 1 - 0.30 0.023 0.66 0.30 - 0.076 |
Abbreviations: SF: serum ferritin; ALT: alanine aminotransferase; IGF-1: Insulin Growth Factor-1; PG: plasma glucose; HH: hypogonadotropic hypogonadism; N.A.: not available.
Plasma glucose, insulin levels and surrogate markers of insulin secretion and sensitivity during OGTT at first consultation (baseline): Seven of 11 overweight β-TM patients (63.6%) and 3/11 normal weight β-TM patients (27.2%) had GD during OGTT at first consultation (baseline). The key difference in glucose regulation, discriminating overweight from normal-weight individuals, was IFG (P:0.023). No statistically significant differences were found during OGTT when we compared the PG and serum insulin levels in the two groups of patients.
Nevertheless, the insulin sensitivity/resistance indices: HOMA- IR, QUICKI, and Matsuda WBISI index, as well as AUCIns 0-120 and ratio AUCIns 0-120 /AUCGlu 0-120, differed significantly between the two groups of patients. A detailed presentation of results is reported in table 2.
Table 2.
Baseline characteristics during OGTT in 11 β-TM overweight patients and 11 β-TM normal weight patients. Data are expressed as mean ± SD.
| Variables | 11 overweight β-TM patients | 11 normal weight β-TM patients | P value |
|---|---|---|---|
| Fasting plasma glucose (PG) (mg/dL) | 97.1± 8.9 | 92.6 ± 5.1 | 0.16 |
| PG 30 min. after OGTT (mg/dL) | 150.0 ± 26.2 | 135.6 ± 22.0 | 0.17 |
| PG 1-h after OGTT (mg/dL) | 152.1± 32.2 | 132.5 ± 34.0 | 0.18 |
| PG 2- h after OGTT (mg/dL) | 128.6 ± 24.4 | 113.8 ± 16.8 | 0.11 |
| PG 3-h after OGTT (mg/dL) | 99.7 ± 26.2 | 99.1 ± 16.9 | 0.95 |
| AUCGlu 0-120 (mg/dL) | 462.3 ± 140.7 | 437.4 ± 74.9 | 0.61 |
| Fasting insulin (μU/mL) | 8.3 ± 3.3 | 5.5 ± 1.6 | 0.019 |
| Insulin 30 min after OGTT (μU/mL) | 64.4 ± 34.2 | 44.0 ± 22.8 | 0.11 |
| Insulin 1-h after OGTT (μU/mL) | 65.8 ± 32.0 | 40.5 ± 26.9 | 0.058 |
| Insulin 2-h after OGTT (μU/mL) | 44.7 ± 31.7 | 26.9 ± 12.1 | 0.097 |
| Insulin 3-h after OGTT (μU/mL) | 26.6 ± 27.8 | 14.1 ± 6.6 | 0.16 |
| AUCIns 0-120 (μU/mL) | 189.7 ± 84.7 | 80.6 ± 35.0 | 0.0008 |
| Ratio AUCIns 0-120 /AUCGlu 0-120 | 0.48 ± 0.35 | 0.18 ± 0.07 | 0.011 |
| HOMA-IR | 2.0 ± 0.77 | 1.27 ± 0.40 | 0.011 |
| QUICKI | 0.34 ± 0.022 | 0.37 ± 0.019 | 0.0027 |
| Insulinogenic index (IGI) | 1.18 ± 0.82 | 1.15 ± 1.11 | 0.94 |
| CIR | 0.30 ± 0.18 | 0.25 ± 0.14 | 0.47 |
| Matsuda WBISI index | 5.5 ± 1.2 | 7.38 ± 1.63 | 0.0059 |
| Oral disposition index (oDI) | 4.9 ± 2.5 | 8.25 ± 7.52 | 0.17 |
The most common associated growth and endocrine complications noted in overweight β -TM patients were short stature and secondary amenorrhea, and acquired hypogonadotropic hypogonadism in normal weight β -TM patients (Table 1). In 2 overweight β -TM, the short stature was familial and in other 2 overweight β -TM patients were associated to excellent compliance to iron chelation therapy with DFO.
Correlations: Interestingly, BMI was correlated with HOMA-IR, QUICKI, Matsuda WBISI index and AUCIns 0-120. Moreover, IGF-1 was correlated with ratio AUCIns 0-120 /AUCGluc 0-120,
Insulinogenic Index (IGI) was strongly correlated with CIR and the latter with QUICKI and AUCGlu 0-120. Moreover, a significant direct correlation was observed between HOMA-IR and QUICKI and an inverse correlation was present between Matsuda WBISI index and AUCIns 0-120 /AUCGlu 0-120 ratio (Table 3).
Table 3.
Correlations between insulin sensitivity and insulin secretion using surrogate measurements from the OGTT, at baseline.
| Indices | BMI | IGI | HOMA -IR | QUICKI | AUCGlu 0-120 | IGF-1 |
|---|---|---|---|---|---|---|
| HOMA-IR |
R= 0.4887; P: 0.021 |
N.S. | - |
R=-0.9428; P:< 0.00001 |
N.S. | N.S. |
| QUICKI |
R= - 0.526; P: 0.011 |
N.S. |
R:- 0.9428;
P: 0.00001 |
- | N.S. | N.S. |
| Insulinogenic Index (IGI) | N.S. | - | N.S. | R= -0.414; P:0.055 |
R= 0.4385; P: 0.041 |
N.S. |
| CIR | N.S. |
R=0.901; P: 0.0001 |
N.S. |
R=- 0.4603; P:0.031 |
R=- 0.4331; P: 0.044 |
N.S. |
| Matsuda WBISI index |
R=- 0.7051; P:0.0002 |
N.S. |
R=-0.6172; P:0.0022 |
R= 0.6659; P:0.00071 |
N.S. | N.S. |
| Oral disposition Index (oDI) | N.S. | N.S. | N.S. | N.S. |
R=-0.5277 P: 0.011 |
N.S. |
| AUC Ins 0-120 |
R= 0.6299; P: 0.0016 |
N.S. | N.S. | N.S. | N.S. | N.S. |
| Ratio AUCIns 0-120 /AUCGlu 0-120 |
R=- 0.480; P:0.023 |
N.S. |
R=-0.4422; P:0.039 |
R=0.4134; P: 0.056 |
N.S. |
R=0.5065; P: 0.026 |
No correlation was observed between SF and ALT on the one side and all the included clinical and OGTT parameters (PG, insulin secretion and insulin sensitivity) on the other side.
Outcomes of glucose metabolism at last observation
Overweight patients: The mean duration of follow-up was 5.2 ± 1.9 years. (range: 3.1-9.11 years). The detailed evolution of glucose tolerance in these patients is illustrated in Figure 1.
Figure 1.
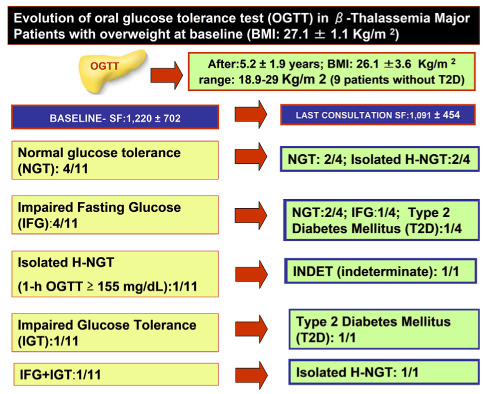
Changes in category of glucose homeostasis from baseline to the last consultation in overweight β-TM patients.
Two of 11 β-TM overweight patients developed T2D (18.1%). Their BMI increased from 24 to 31 Kg/m 2 and from 29 to 39 Kg/m2, respectively. Their SF values were 1,260 ng/mL and 1,620 ng/mL, respectively.
Interestingly, patient 1 with IGT at first consultation developed T2 D, after 6 years of follow-up, and patient 2 with IFG developed T2-DM, after 7.6 years of follow-up. One year before the diagnosis of T2-D, their OGTT was compatible with IFG and IGT, respectively (Figure 2 and Figure 3).
Figure 2.
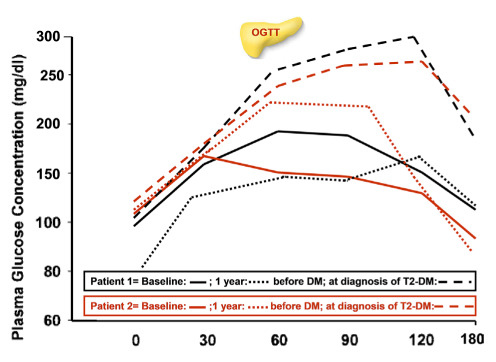
Plasma glucose concentrations during OGTT in two patients who developed type 2 diabetes at baseline, 1 year before T2D and at diagnosis of T2D.
Figure 3.

Plasma insulin concentrations during OGTT in two patients who developed type 2 diabetes on baseline, on year before T2D and at diagnosis of T2D.
The difference between SF at first and last observation (1,220 ± 702 vs.1,091 ± 454 ng/mL; P: 0.61) was not significant.
Patients with normal weight: The mean duration of follow-up was 4.5 ± 1.2 years. No statistical difference was found in duration of follow-up compared to that of overweight β-TM patients (P: 0.27). The detailed evolution of glucose tolerance abnormalities in 11 β-TM patients is illustrated in figure 4. No patient developed DM. Their mean BMI at last observation was 21.4 ± 1.5 Kg/m2
Figure 4.

Changes in glucose homeostasis from baseline to the last consultation in normal weight β-TM patients.
The difference between SF at first and last observation (1,018 ± 550 vs.1,076 ± 659 ng/mL; P: 0.82) in 11 normal weight β-TM patients was nonsignificant (P:0.73).
Discussion
The present study is based on data collected during an ongoing retrospective study on GD in patients with β -TM promoted by the International Network of Clinicians for Endocrinopathies in Thalassemia and Adolescent Medicine (ICET-A) in January 2023. To our knowledge, this is the first reported study that has investigated the changes of PG, insulin secretion and sensitivity in OGTT in overweight β-TM female patients compared to sex and age matched β-TM patients with normal weight.
In the general population, obesity is a risk factor for the development of T2D and cardiovascular disease (33). High BMI, either overweight or obesity, is frequently associated with insulin resistance (IR) and abnormalities in insulin secretion (34). The hyperinsulinemic–euglycemic clamp and the hyperglycemic clamp are considered the best methods for measuring insulin sensitivity and pancreatic β-cell function, respectively (35). However, as these procedures are invasive and labor intensive, many metabolic markers and indices, most of them calculated using fasting and stimulated levels of PG and insulin, have been used to assess β-cell function and insulin sensitivity/resistance (36). This is especially important in clinical practice, due to the lack of appropriate guidelines dedicated to this high-risk group of patients with high BMI. Therefore, it is important to understand the concepts and relative merits and limitations underlying each method in order to interpret the data for measuring insulin secretion and sensitivity.
Several interesting observations emerged from this single-center retrospective study in TDT adult female patients. In particular:
In the initial consultation, more than half (63.6%) of the overweight β-TM female patients had different stages of glucose metabolism dysregulation, according to classic diagnostic criteria (17) and supplemented by 1-h isolated H-NGT, compared to 27.2% of sex and age matched β-TM patients with normal weight.
Overweight β-TM patients had increased HOMA-IR and QUICKI indices associated with decreased Matsuda WBISI index compared to β-TM patients with normal weight (Table 2). Considering that Matsuda WBISI index encompasses both hepatic and peripheral tissue insulin sensitivity, we assumed that overweight associated with reduced physical activity may have induced a reduced muscle mass and insulin sensitivity, as reported in sarcopenic obese subjects (37).
CIR and IGI. were used as surrogate indices of early phase insulin secretion of β-cell in response to OGTT. These findings suggest that in β-TM patients the first phase of pancreatic β-cell response to glucose load is compromised and is unable to compensate for IR. Furthermore, it has been reported that the reduced early insulin response during OGTT is closely associated with the occurrence of subsequent prediabetes and T2D (38,39). These observations open the question of whether early treatment of mild alterations of glucose metabolism with insulin secretagogues or short-action insulin may lead to improvement of glucose homeostasis in β-TM patients (31,40).
It is noteworthy that the oral disposition index (oDI) in overweight β-TM patients was lower compared to that in 8 healthy adult female subjects (4.9 ± 2.5 vs. 13.6 ± 9.9; P: 0.027) reported in a previous study (41), while no difference was found in oDI between overweight and normal weight β-TM patients (P: 0.21) in this study. The oDI index provides a measure of β-cell function adjusted for insulin sensitivity and has been shown to be predictive for describing the risk for, and progression of, diabetes in the general population (27).
Interestingly, insulin-like growth factor 1 (IGF-1) levels were correlated with AUCIns 0-120 /AUCGlu 0-120 ratio (R=0.5065; P: 0.026) supporting the notion that circulating IGF-1 levels may further influence the control of glucose homeostasis (42). Clinical studies in humans and experimental animals support the conclusion that IGF-1 is necessary for normal insulin sensitivity, and impairment of IGF-1 synthesis results in a worsening state of IR (43).
At last consultation, 6 out of a total 22 (27.2%) participants with β-TM presented with an isolated 1-hour post-load PG value ≥155 mg/dl (H-NGT). It has been suggested that hyperglycemia at 1-h PG during an OGTT may be considered a relevant biomarker for identifying subjects with IR and β-cell dysfunction and may be a predictor of future development of T2D (44).
Finally, during an average follow-up of 4.5± 1.2 years range, our OGTT data suggest that being overweight may contribute to further deterioration of glucose homeostasis. Noticeably, at baseline two overweight patients with IGT and IFG, and two normal weight β-TM patients with NGT and 1-hour H-NGT presented IGI and CIR values below the first quartile found in the 22 β-TM patients enrolled in the study (<0.585 and < 0.1575, respectively). Reduced first phase insulin release may impair adipocyte metabolism, leading to increased lipolysis and elevated levels of non-esterified fatty acid (NEFA). Elevation of NEFA and glucose can work together to impair islet health and insulin action. Therefore, this process may slowly progress forward to develop T2D (45).
A further well-designed prospective study is essential to validate the combination of these 2 indices as a simple method of identifying patients at risk for deterioration of glucose homeostasis.
In conclusion, being overweight in the context of β-TM was related with a significantly higher likelihood of dysglycemia, especially IFG. Longitudinal data analysis also suggested a link between being overweight and risk for the future development of T2D. Although a pertinent conclusion cannot be made as only a small number of patients were evaluated, our data suggest that the development of strategies for weight reduction/maintenance and behavioral modification is a high priority, especially in a certain subgroup of β-TM patients. Although lifestyle modification and weight loss are highly recommended, pharmacological treatments to increase insulin secretion and/or sensitivity should be considered in selected cases. Finally, based on the current
Understanding, the pathophysiology of GD in β-TM patients is complex and requires a multidisciplinary approach. It is important that clinicians recognize that “glucose tolerance and insulin sensitivity are not equivalent concepts because the OGTT test provides useful information about glucose tolerance but not insulin secretion, incretin effects, and other factors contributing to glucose tolerance” (46).
Acknowledgements:
We thank all the participants in the study. We are also indebted to our colleagues for their help in facilitating this study.
Conflict of Interest Statement:
Each author declares that he or she has no commercial associations (e.g. consultancies, stock ownership, equity interest, patent/licensing arrangement etc.) that might pose a conflict of interest in connection with the submitted article.
Author Contributions:
Conceptualization: All the Authors; VDS conducted the statistical analyses and wrote the first draft of manuscript; All Co-Authors reviewed the manuscript and contributed to discussion; VDS is the guarantor of work and takes responsibility for the integrity of data analysis. All authors contributed to the article and approved the submitted version.
References
- Bannerman RM, Keusch G, Kreimer-Birnbaum M, Vernon K, Vance VK, Vaughan S. Thalassemia intermedia, with iron overload, cardiac failure, diabetes mellitus, hypopituitarism and porphyrinuria. Am J Med. 1967;42(3):476–8. doi: 10.1016/0002-9343(67)90276-8. doi:101016/0002-9343(67)90276-8. [DOI] [PubMed] [Google Scholar]
- Farmakis D, Porter J, Taher A, Cappellini MD, Angastiniotis M, Eleftheriou A. 2021. Thalassaemia International Federation guidelines for the management of transfusion-dependent thalassemia. Hemasphere. 2022;6(8):e732. doi: 10.1097/HS9.0000000000000732. doi:10.1097/HS9.0000000000000732. [DOI] [PMC free article] [PubMed] [Google Scholar]
- Kattamis A, Kwiatkowski JL, Aydinok Y. Thalassemia. Lancet. 2022;399(10343):2310–24. doi: 10.1016/S0140-6736(22)00536-0. doi:10.1016/ S0140-6736(22)00536-0. [DOI] [PubMed] [Google Scholar]
- Noetzli LJ, Papudesi J, Coates TD, Wood JC. Pancreatic iron loading predicts cardiac iron loading in thalassemia major. Blood. 2009;114(19):4021–6. doi: 10.1182/blood-2009-06-225615. doi: 10.1182/blood-2009-06-225615. [DOI] [PMC free article] [PubMed] [Google Scholar]
- Patel S, Jinjuvadia R, Patel R, Liangpunsakul S. Insulin Resistance is associated with significant liver fibrosis in chronic hepatitis C patients: a systemic review and meta-analysis. J Clin Gastroenterol. 2016;50(1):80–4. doi: 10.1097/MCG.0000000000000400. doi: 10.1097/MCG.0000000000000400. [DOI] [PMC free article] [PubMed] [Google Scholar]
- Ibrahim AS, Abd El-Fatah AH, Abd El-Halim AF, Mohamed FF. Serum ferritin levels and other associated parameters with diabetes mellitus in adult patients suffering from beta thalassemia major. J Blood Med. 2023;14:67–81. doi: 10.2147/JBM.S390666. doi: 10.2147/JBM.S390666. [DOI] [PMC free article] [PubMed] [Google Scholar]
- Goldberg EK, Lal A, Fung EB. Nutrition in thalassemia: a systematic review of deficiency, relations to morbidity, and supplementation recommendations. J Pediatr Hematol Oncol. 2022;44(1):1–11. doi: 10.1097/MPH.0000000000002291. doi: 10.1097/MPH.0000000000002291. [DOI] [PMC free article] [PubMed] [Google Scholar]
- Fung EB, Gildengorin G, Talwar S, Hagar L, Lal A. Zinc status affects glucose homeostasis and insulin secretion in patients with thalassemia. Nutrients. 2015;7(6):4296–307. doi: 10.3390/nu7064296. doi: 10. 3390/nu7064296. [DOI] [PMC free article] [PubMed] [Google Scholar]
- Saudek CD, Hemm RM, Peterson CM. Abnormal glucose tolerance in β-thalassemia major. metabolism. 1977;26(1):43–52. doi: 10.1016/0026-0495(77)90126-3. doi.org/10.1016/0026-0495(77)90126-3. [DOI] [PubMed] [Google Scholar]
- Matter RM, Allam KE, Sadony AM. Gradient-echo magnetic resonance imaging study of pancreatic iron overload in young Egyptian beta-thalassemia major patients and effect of splenectomy. Diabetol Metab Syndr. 2010;2:23. doi: 10.1186/1758-5996-2-23. doi: 10.1186/1758-5996-2-23. [DOI] [PMC free article] [PubMed] [Google Scholar]
- Bordbar M, Bozorgi H, Saki F, et al. Prevalence of endocrine disorders and their associated factors in transfusion-dependent thalassemia patients: a historical cohort study in Southern Iran. J Endocrinol Invest. 2019;42:1467–76. doi: 10.1007/s40618-019-01072-z. doi:10.1007/s40618-019-01072-z. [DOI] [PubMed] [Google Scholar]
- De Sanctis V, Soliman A, Daar S, et al. Insulin-Like Growth Factor -1 (IGF-1) and Glucose Dysregulation in Young Adult Patients with β-Thalassemia Major: Causality or Potential Link? Acta Biomed. 2022;93(6):e2022331. doi: 10.23750/abm.v93i6.13288. doi: 10.23750/abm.v93i6.13288. [DOI] [PMC free article] [PubMed] [Google Scholar]
- Mauvais-Jarvis F. Gender differences in glucose homeostasis and diabetes. Physiol Behav. 2018;187:20–3. doi: 10.1016/j.physbeh.2017.08.016. doi:10.1016/j.physbeh.2017.08.016. [DOI] [PMC free article] [PubMed] [Google Scholar]
- Tuomilehto J, Lindström J, Eriksson JG, et al. Prevention of type 2 diabetes mellitus by changes in lifestyle among subjects with impaired glucose tolerance. N Engl J Med. 2001;344:1343–50. doi: 10.1056/NEJM200105033441801. doi:10.1056/ NEJM 200 105033441801. [DOI] [PubMed] [Google Scholar]
- Yumuk V, Tsigos C, Fried M, et al. European guidelines for obesity management in adults. Obes Facts. 2015;8:402–24. doi: 10.1159/000442721. doi: 10.1159/000442721. [DOI] [PMC free article] [PubMed] [Google Scholar]
- De Sanctis V, Soliman AT, Elsedfy H, et al. Growth and endocrine disorders in thalassemia: The international network on endocrine complications in thalassemia (I-CET) position statement and guidelines. Indian J Endocrinol Metab. 2013;17(1):8, 18. doi: 10.4103/2230-8210.107808. doi:10.4103/2230-8210.107808. [DOI] [PMC free article] [PubMed] [Google Scholar]
- American Diabetes Association. Classification and diagnosis of diabetes: standards of medical care in diabetes - 2020. Diabetes Care. 2020;43(Suppl.1):S14–S31. doi: 10.2337/dc20-S002. doi.org/10.2337/dc20-S002. [DOI] [PubMed] [Google Scholar]
- De Sanctis V, Soliman A, Tzoulis P, et al. The clinical characteristics, biochemical parameters and insulin response to oral glucose tolerance test (OGTT) in 25 transfusion dependent β-thalassemia (TDT) patients recently diagnosed with diabetes mellitus (DM): Diabetes mellitus in β-thalassemia. Acta Biomed. 2022;92(6):e2021488. doi: 10.23750/abm.v92i6.12366. doi.org/10.2 3750/abm.v92i6.12366. [DOI] [PMC free article] [PubMed] [Google Scholar]
- Kasim N, Khare S, Sandouk Z, Chan C. Impaired glucose tolerance and indeterminate glycemia in cystic fibrosis. J Clin Transl Endocrinol. 2021;26:100275. doi: 10.1016/j.jcte.2021.100275. doi: 10.1016/ j. jcte.2021.100275. [DOI] [PMC free article] [PubMed] [Google Scholar]
- Chen Z, Shao L, Jiang M, Ba X, Ma B, Zhou T. Interpretation of HbA1c lies at the intersection of analytical methodology, clinical biochemistry and hematology (Review) Exp Ther Med. 2022;24(6):707. doi: 10.3892/etm.2022.11643. doi: 10.3892/ etm.2022.11643. [DOI] [PMC free article] [PubMed] [Google Scholar]
- Chatzianagnostou K, Di Piazza S, Tirelli AS, et al. Low concordance between HbA1c and OGTT to diagnose prediabetes and diabetes in overweight or obesity. Clin Endocrinol. 2019;91(3):411–6. doi: 10.1111/cen.14043. doi.org /10.1111/cen.14043. [DOI] [PubMed] [Google Scholar]
- Matsuda M, DeFronzo RA. Insulin sensitivity indices obtained from oral glucose tolerance testing: comparison with the euglycemic insulin clamp. Diabetes Care. 1999;22(9):1462–70. doi: 10.2337/diacare.22.9.1462. doi:10.2337/ diacare. 22.9.1462. [DOI] [PubMed] [Google Scholar]
- Sluiter WJ, Erkelens DW, Reitsma WD, Doorenbos H. Glucose tolerance and insulin release, a mathematical approach I. Assay of the β-cell response after oral glucose loading. Diabetes. 1976;25:241–4. doi: 10.2337/diab.25.4.241. doi: 10.2337/diab.25.4.245. [DOI] [PubMed] [Google Scholar]
- Gutch M, Kumar S, Razi SM, Gupta KK, Gupta A. Assessment of insulin sensitivity/ resistance. Indian J Endocr Metab. 2015;19:160–4. doi: 10.4103/2230-8210.146874. doi: 10.4103/2230-8210.146874. [DOI] [PMC free article] [PubMed] [Google Scholar]
- Park SY, Gautier JF, Suk Chon S. Assessment of Insulin Secretion and Insulin Resistance in Human. Diabetes Metab J. 2021;45:641–54. doi: 10.4093/dmj.2021.0220. doi: 10.4093/ dmj. 2021.0220. [DOI] [PMC free article] [PubMed] [Google Scholar]
- Hayashi T, Boyko EJ, Sato KK, et al. Patterns of insulin concentration during the OGTT predict the risk of type 2 diabetes in Japanese Americans. Diabetes Care. 2013;36(5):1229–35. doi: 10.2337/dc12-0246. doi:10.2337/ dc12-0246. [DOI] [PMC free article] [PubMed] [Google Scholar]
- Utzschneider KM, Prigeon RL, Faulenbach MV, et al. Oral disposition index predicts the development of future diabetes above and beyond fasting and 2-h glucose levels. Diabetes Care. 2009;32(2):335–41. doi: 10.2337/dc08-1478. doi: 10.2337/dc08-1478. [DOI] [PMC free article] [PubMed] [Google Scholar]
- De Sanctis V, Elsedfy H, Soliman AT, et al. Clinical and biochemical data of adult thalassemia major patients (TM) with multiple endocrine complications (MED) versus TM patients with normal endocrine functions: a long-term retrospective study (40 years) in a tertiary care center in Italy. Mediterr J Hematol Infect Dis. 2016;8(1):e2016022. doi: 10.4084/MJHID.2016.022. doi: 10.4084/ MJHID. 2016.022. [DOI] [PMC free article] [PubMed] [Google Scholar]
- Alder R, Roesser EB. Introduction to probability and statistics. WH Freeman and Company Eds. Sixth Edition. San Francisco (USA): 1975. PMID:1674139. [Google Scholar]
- Swinscow TDV. Statistics at square one. XVI-The chi squared 2 tests. BMJ. 1976;2:573–4. doi: 10.1136/bmj.2.6035.573. doi: 10. 1136/ bmj.2. 6035. 573. [DOI] [PMC free article] [PubMed] [Google Scholar]
- Tzoulis P. Review of Endocrine Complications in Adult Patients with β-thalassaemia Major. Thalass Rep. 2014;4(3):4871. doi: 10.4081/thal.2014.4871. [Google Scholar]
- De Sanctis V, Soliman AT, Daar S, Tzoulis P, Fiscina B, Kattamis C. international network of clinicians for endocrinopathies in thalassemia and adolescence medicine (ICET-A). Retrospective observational studies: lights and shadows for medical writers. Acta Biomed. 2022;93(5):e2022319. doi: 10.23750/abm.v93i5.13179. doi:10.23750/abm.v93i5.13179. [DOI] [PMC free article] [PubMed] [Google Scholar]
- Fontbonne A, Currie A, Tounian P, et al. Prevalence of overweight and obesity in france: the 2020 obepi-roche study by the “Ligue Contre l’Obésité”. J Clin Med. 2023;12(3):925. doi: 10.3390/jcm12030925. doi:10.3390/ jcm 12030925. [DOI] [PMC free article] [PubMed] [Google Scholar]
- Kahn SE. The relative contributions of insulin resistance and beta-cell dysfunction to the pathophysiology of Type 2 diabetes. Diabetologia. 2003;46:3–19. doi: 10.1007/s00125-002-1009-0. doi:10.1007/s00125-002-1009-0. [DOI] [PubMed] [Google Scholar]
- DeFronzo RA, Tobin JD, Andres R. Glucose clamp technique: a method for quantifying insulin secretion and resistance. Am J Physiol. 1979;237:E214–E23. doi: 10.1152/ajpendo.1979.237.3.E214. PIMD:382871. [DOI] [PubMed] [Google Scholar]
- Singh B, Saxena A. Surrogate markers of insulin resistance: a review. World J Diabetes. 2010;1(2):36–47. doi: 10.4239/wjd.v1.i2.36. doi:10.4239/wjd.v1.i2.36. [DOI] [PMC free article] [PubMed] [Google Scholar]
- Srikanthan P, Hevener AL, Karlamangla AS. Sarcopenia exacerbates obesity-associated insulin resistance and dysglycemia: findings from the national health and nutrition examination survey III. PLoS ONE. 2010;5(5):e10805. doi: 10.1371/journal.pone.0010805. doi:10.1371/journal.pone.0010805. [DOI] [PMC free article] [PubMed] [Google Scholar]
- Seltzer HS, Allen EW, Herron AL Jr, Brennan MT. Insulin secretion in response to glycemic stimulus: relation of delayed initial release to carbohydrate intolerance in mild diabetes mellitus. J Clin Invest. 1967;46(3):323–35. doi: 10.1172/JCI105534. doi: 10.1172/JCI105534. [DOI] [PMC free article] [PubMed] [Google Scholar]
- Kosaka K, Kuzuya T, Yoshinaga H, Hagura R. A prospective study of health check examinees for the development of non-insulin-dependent diabetes mellitus: relationship of the incidence of diabetes with the initial insulinogenic index and degree of obesity. Diabetic Medicine. 1996;13(9) Suppl. 6:S120–S6. PIMD:8894495. [PubMed] [Google Scholar]
- Ferrannini E. Insulin resistance versus insulin deficiency in non-insulin-dependent diabetes mellitus: problems and prospects. Endocr Rev. 1998;19:477–90. doi: 10.1210/edrv.19.4.0336. doi: 10.1210/edrv.19.4.0336. [DOI] [PubMed] [Google Scholar]
- De Sanctis V, Soliman AT, Tzoulis P, et al. Glucose metabolism and insulin response to oral glucose tolerance test (OGTT) in prepubertal patients with transfusion-dependent β-thalassemia (TDT): a long-term retrospective analysis. Mediterr J Hematol Infect Dis. 2021;13:e2021051. doi: 10.4084/MJHID.2021.051. doi: 10.4084/MJHID.2021.051. [DOI] [PMC free article] [PubMed] [Google Scholar]
- De Sanctis V, Soliman A, Daar S, et al. Insulin-Like Growth Factor -1 (IGF-1) and glucose dysregulation in young adult patients with β-thalassemia major: causality or potential link? IGF-1 and glucose dysregulation in thalassemia. Acta Biomed. 2022;93(6):e2022331. doi: 10.23750/abm.v93i6.13288. doi: 10.23750/abm.v92i6.13288. [DOI] [PMC free article] [PubMed] [Google Scholar]
- Clemmons DR. Role of Insulin-Like Growth Factor I in maintaining normal glucose homeostasis. Horm Res. 2005;62(Suppl. 1):77–82. doi: 10.1159/000080763. doi: 10.1159000080763. [DOI] [PubMed] [Google Scholar]
- Jagannathan R, Neves JS, Dorcely B, et al. The oral glucose tolerance test:100 years later. Syndr Obes. 2020;13:387–3805. doi: 10.2147/DMSO.S246062. doi: 10.2147/DMSO.S246062. [DOI] [PMC free article] [PubMed] [Google Scholar]
- Kahn SE, Hull RL, Utzschneider KM. Mechanisms linking obesity to insulin resistance and type 2 diabetes. Nature. 2006;444(7121):840–6. doi: 10.1038/nature05482. doi: 10.1038/nature05482. [DOI] [PubMed] [Google Scholar]
- Muniyappa R, Madan R, Varghese RT. Assessing Insulin Sensitivity and Resistance in Humans. MDText.com, Inc. 2021:PIMD25905189. [Google Scholar]