Abstract
Background
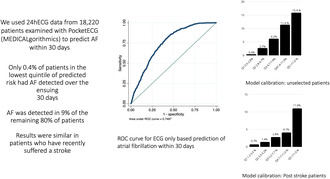
Access to long‐term ambulatory recording to detect atrial fibrillation (AF) is limited for economical and practical reasons. We aimed to determine whether 24 h ECG (24hECG) data can predict AF detection on extended cardiac monitoring.
Methods
We included all US patients from 2020, aged 17–100 years, who were monitored for 2–30 days using the PocketECG device (MEDICALgorithmics), without AF ≥30 s on the first day (n = 18,220, mean age 64.4 years, 42.4% male). The population was randomly split into equal training and testing datasets. A Lasso model was used to predict AF episodes ≥30 s occurring on days 2–30.
Results
The final model included maximum heart rate, number of premature atrial complexes (PACs), fastest rate during PAC couplets and triplets, fastest rate during premature ventricular couplets and number of ventricular tachycardia runs ≥4 beats, and had good discrimination (ROC statistic 0.7497, 95% CI 0.7336–0.7659) in the testing dataset. Inclusion of age and sex did not improve discrimination. A model based only on age and sex had substantially poorer discrimination, ROC statistic 0.6542 (95% CI 0.6364–0.6720). The prevalence of observed AF in the testing dataset increased by quintile of predicted risk: 0.4% in Q1, 2.7% in Q2, 6.2% in Q3, 11.4% in Q4, and 15.9% in Q5. In Q1, the negative predictive value for AF was 99.6%.
Conclusion
By using 24hECG data, long‐term monitoring for AF can safely be avoided in 20% of an unselected patient population whereas an overall risk of 9% in the remaining 80% of the population warrants repeated or extended monitoring.
Keywords: ambulatory ECG, atrial fibrillation, prediction, risk score, stroke
By using data from 24hECG, we were able to predict atrial fibrillation episodes within the subsequent 30 days in an unselected patient cohort and in poststroke patients. Our prediction model can be used to triage patients to longer or shorter monitoring durations.
1. INTRODUCTION
Ambulatory ECG is widely used for the detection of atrial fibrillation (AF). Monitoring durations for AF detection vary widely, from single‐day full disclosure Holter ECGs to several years of intermittent recordings using implantable devices. The diagnostic yield depends on recording quality and duration (Dziubinski et al., 2021), but longer recordings are associated with higher costs, as well as with potential discomfort to the patient, and access to long‐term ECG monitoring is limited by some insurance providers.
At the same time, some data that can be obtained from 24‐h ECG monitoring can predict incident AF. The occurrence of PACs, for example, is well known to be associated with incident clinical AF in prospective cohort studies (Binici et al., 2010; Johnson et al., 2015, 2018; Persson et al., 2020), as are mean and resting heart rate (Persson et al., 2020). Furthermore, in a poststroke population in the EMBRACE trial, PACs predicted AF detected on 30‐day monitoring with an external loop recorder (Gladstone et al., 2015). This implies that prediction of clinically relevant arrhythmic events using information obtained from an initial shorter duration recording has potential to rationalize monitoring duration, so that patients in whom an initial 24‐h ECG indicates a higher risk of AF can be referred for longer monitoring, whereas long monitoring durations can be avoided in patients with low risk.
This study aimed to determine whether a risk prediction model based on ECG data obtained in sinus rhythm during the initial 24 h of ambulatory ECG monitoring could be used to predict AF on a 30‐day long mobile cardiac telemetry, in an unselected mobile cardiac telemetry population as well as among patients monitored for the indication of stroke or transient ischemic attack (TIA).
2. METHODS
The study population was derived from patients who had recorded an ambulatory ECG with a duration of 2–30 full days of registration, using the PocketECG device (MEDICALgorithmics, Warsaw, Poland) in the United States in 2017 (n = 19,947). The Pocket ECG device records and transmits a full disclosure ambulatory ECG continuously, with beat to beat labeling of the entire recording, for up to 31 days. The index day was defined as the first full day of recording. Patients with AF or atrial flutter on the index day were excluded (n = 1719) as were subjects aged >100 years (n = 8). The final study population consisted of 18,220 patients and was randomly divided into equally sized training and testing datasets (n = 9110 each). The outcome was AF detected on recording day 2–30. In 1492 individuals, the indication for monitoring was given as stroke or TIA. The ethics review board of Sweden has waived the need for approval for studies using this database since all analyses are done on de‐identified data (decision number 2019‐03227).
All arrhythmias were algorithmically detected using a deep learning algorithm and manually verified. AF was defined as ≥30s of irregular rhythm without discernible P‐waves. Premature atrial complexes (PACs) were defined as premature complexes (QRS duration <120 ms) with incomplete compensatory pauses. Wide complex PACs due to aberrant conduction were defined as such. Premature ventricular complexes (PVCs) were defined as premature wide complexes with complete compensatory pauses. In both instances, prematurity was defined as a beat preceded by an interval rate >20 beats per minute faster than the preceding normal to normal interval rate.
Maximum, mean, and minimum heart rates were based on sinus rhythm beats and measured over 60‐s duration in beats per minute. The maximum heart rate during arrhythmia events was computed from the shortest RR interval during each arrhythmic event. In order to avoid the introduction of missing data to the model in variables describing heart rate during arrhythmia, fastest heart rate was set to 0 for those without any occurrences of the arrhythmia in question. Supraventricular ectopy occurrence patterns were further classified as PAC singles, couplets, triplets, or supraventricular tachycardias (SVTs, a series of ≥4 PACs), and ventricular ectopy was similarly classified, except for an additional subcategory of accelerated idioventricular rhythm (AIVR) defined as a series of wide complexes not initiated by discernible P‐waves and a heart rate < 100 beats per minute.
2.1. Statistical methods
All statistics were performed using Stata for Mac v17.0 (Statacorp). A Lasso model with cross‐validation and penalized coefficients was derived in a random 50% of the cohort (the training dataset) with AF as outcome. For inclusion, we specified a total of 28 predictors: age, sex, and ECG‐derived variables including mean, minimum, and maximum heart rate during sinus rhythm; the lowest heart rate during bradycardia; the rate and pattern of occurrence of PACs and PVCs as singles, couplets, triplets, SVTs, and VTs, as well as heart rate during couplets, triplets, and SVT, AIVR, or VT events. Arrhythmia frequencies were derived from total diagnostic signal time. In order to account for possible nonlinear relationship and highly skewed data, heart rate variables and variables describing the frequency of PAC and PVC occurrence were stratified according to deciles; the resulting strata were entered into the model as continuous variables. This model was denoted the “full model.” For comparison, we also derived an “‘ECG‐only’ model” based only on ECG‐derived variables, without age and sex.
The penalized coefficients from the final Lasso model were then used to compute the individual predicted risk for each study subject, and the predicted risk was entered in a logistic regression model in the remaining 50% of the cohort (testing dataset). Model discrimination was assessed with receiver operating characteristic (ROC) curves and ROC statistics with 95% confidence intervals. ROC curves and statistics were also computed for a logistic regression model with AF as outcome and including only age and sex as predictors, as well as a model with age, sex, and excessive supraventricular ectopic activity (ESVEA, defined as the presence of >720 PACs or an SVT run with a duration of ≥20 beats) on the first registration day (Binici et al., 2010).
Calibration in the testing dataset was assessed in the same logistic regression model with the Hosmer–Lemeshow test using 10 equally sized bins. Plots of observed versus expected events were produced using the Stata plugin pmcalplot, using 10 bins and with estimation of calibration in the large, slope, and expected/observed ratio.
We also calculated ROC statistics with 95% confidence for the full model and the ECG only model among patients monitored due to stroke or TIA, in the testing dataset. In a separate analysis, we specifically analyzed the full poststroke/TIA cohort to investigate if simplified criteria among low‐risk AF patients could be identified to not warrant additional ECG screening. To do so, we defined normal 24‐h ECG findings as <1000 PACs and < 200 PVCs, as well as no couplets, triplets, or runs of PACs or PVCs during the index day. Differences in incidence of AF during subsequent recording days were calculated with Pearson's chi‐squared test.
Since the Lasso model is a parsimonious model based on goodness of fit, the selected variables may not include all clinically relevant 24‐h ECG risk markers. We therefore wanted to analyze differences in the 24‐h ECG pattern among patients with a high risk of AF compared to patients with a low risk of AF. In order to do so, we performed a nested case–control study where “high‐risk” patients defined as predicted AF risk ≥10% were matched on age in 5‐year strata, sex, and recording duration, to “low‐risk” patients, defined as predicted AF risk <5%, using the stata plugin ccmatch. The resulting matches were then compared to each other using conditional logistic regression analysis adjusted for age, sex, and recording duration.
3. RESULTS
Study population characteristics are reported in Table 1. The mean (standard deviation (SD)) of age was 64.4 (18.3) years, with a range of 17–100 years, and 42.4% were male. Among patients monitored for stroke/TIA (n = 1492), the mean age was 71.1 years and 46.7% of the population was male. The mean (SD) monitoring duration was 18.6 (9.6) days overall and 23.5 (7.7) days among patients monitored for stroke/TIA. During follow‐up, there were 1290 AF events (7.1%) after a median recording duration of 5 days (interquartile range (IQR) 2–11). Among patients monitored for stroke/TIA, there were 55 AF events (3.7%) after a median recording duration of 11 days (IQR 5–16). On the first monitoring day, 19.7% of the overall population had ESVEA.
TABLE 1.
Study population characteristics.
| Full population | Poststroke/TIA patients | |
|---|---|---|
| Number | 18,220 | 1492 |
| Age, mean (SD) | 64.4 (17.3) | 71.1 (11.8) |
| Male sex | 3862 (42.4%) | 697 (46.7%) |
| Mean heart rate, mean (SD) | 72.8 (11.3) | 71.9 (10.1) |
| Maximum heart rate, mean (SD) | 112.0 (20.9) | 107.6 (16.9) |
| Minimum heart rate, mean (SD) | 56.1 (9.4) | 56.8 (9.1) |
| Total beats, mean (SD) | 94,588 (21,007) | 91,878 (21,246) |
| Total PACs, median (IQR) | 54 (11, 315) | 63.0 (16.0, 272.5) |
| Single PACs, median (IQR) | 41 (8, 238) | 47 (13, 211) |
| PAC couplets, median (IQR) | 1 (0, 6) | 1 (0, 6) |
| PAC triplets, median (IQR) | 0 (0, 2) | 0 (0, 2) |
| SVTs ≥4 beats, median (IQR) | 0 (0, 2) | 1 (0, 2) |
| AIVR beats, median (IQR) | 0 (0, 0) | 0 (0, 0) |
| Total PVC count, median (IQR) | 19 (2, 245) | 29 (3, 238) |
| Single PVC count, median (IQR) | 18 (1, 236) | 28 (2, 230) |
| PVC couplets, median (IQR) | 0 (0, 1) | 0 (0, 1) |
| PVC triplets, median (IQR) | 0 (0, 0) | 0 (0, 0) |
| VT runs ≥4 beats, median (IQR) | 0 (0, 0) | 0 (0, 0) |
3.1. Prediction model discrimination, calibration, and goodness of fit
Odds ratios (OR) and penalized coefficients for the full model and the ECG only model are reported in Table 2, along with the formula with which one can calculate the PocketECG risk score for AF using the β‐coefficients in the table. The full model included eight covariates and the “ECG‐only” model included seven. Cross‐validation plots for Lasso model selection are shown in Figures S1 and S2. In the testing dataset, the main model and the “ECG‐only” model both had good, and almost identical, discrimination, full model ROC statistic 0.7497 (95% CI 0.7336–0.7658), and “ECG‐only” model ROC statistic 0.7497 (95% CI 0.7336–0.7659). The ROC curves for the logistic regression model in the testing dataset based on the predicted risk of outcome are presented in Figures 1 and 2. A model based only on age and sex had substantially poorer discrimination, ROC statistic 0.6542 (95% CI 0.6364–0.6720) (Figure 3), as did a model including age, sex, and ESVEA; ROC statistic 0.6990 (95% CI 0.6827–0.7152).
TABLE 2.
Penalized odds ratios and coefficients for AF risk.
| Main model | “ECG‐only” model | |||
|---|---|---|---|---|
| Odds ratio | β‐coefficient | Odds ratio | β‐coefficient | |
| Age, per year | 1.033 | 0.0324 | – | – |
| Male sex | – | – | – | – |
| Mean heart rate, per bpm | – | – | – | – |
| Maximum heart rate, per bpm | 0.734 | −0.3091 | 0.726 | −0.3200 |
| Minimum heart rate, per bpm | – | – | – | – |
| Lowest rate during bradycardia, per bpm | – | – | – | – |
| Single PACs, per decile of population distribution a | 1.514 | 0.4150 | 1.526 | 0.4226 |
| Number of PAC couplets | – | – | – | – |
| Fastest rate during PAC couplet, per bpm | 1.036 | 0.0351 | 1.040 | 0.0390 |
| Number of PAC triplets | – | – | – | – |
| Fastest rate during PAC triplet, per bpm | 1.179 | 0.1648 | 1.181 | 0.1664 |
| Number of SVTs ≥4 beats | – | – | – | – |
| Longest duration of SVT, per beat | 1.022 | 0.0221 | 1.022 | 0.0222 |
| Fastest rate during SVT ≥4 beats, per bpm | – | – | – | – |
| Total number of AIVR events | – | – | – | – |
| Fastest rate during AIVR, per bpm | – | – | – | – |
| Longest duration of AIVR, per beat | – | – | – | – |
| Total PVC count, per 1 beat | – | – | – | – |
| Single PVC count, per 1 beat | – | – | – | – |
| Total number of PVC couplets | – | – | – | – |
| Fastest rate during PVC couplet, per bpm | 1.040 | 0.0394 | 1.042 | 0.0411 |
| Number of PVC triplets | – | – | – | – |
| Fastest rate during PVC triplet, per bpm | – | – | – | – |
| VT runs ≥4 beats | 1.032 | 0.0315 | 1.032 | 0.0314 |
| Fastest rate during VT run ≥4 beats, per bpm | – | – | – | – |
| Longest duration of VT run, per beat | – | – | – | – |
Note: Predicted risk for the models can be calculated as .
Abbreviations: AIVR, accelerated idioventricular rhythm; Bpm, beats per minute; PAC, premature atrial complex; PVC, premature ventricular complex; SVT, supraventricular tachycardia.
Decile cut points at 0, 1, 3, 7, 18, 50, 140, 406, and 1680.
FIGURE 1.
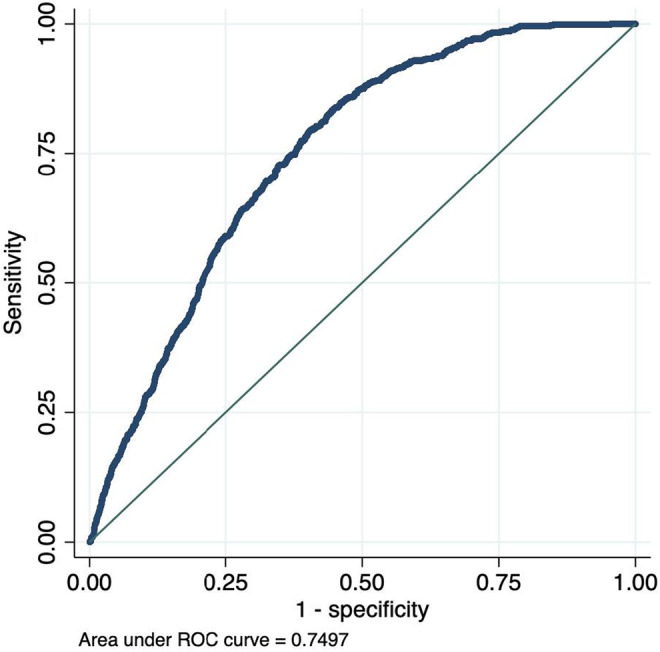
ROC curves for AF occurrence by predicted risk on 24hECG, full model.
FIGURE 2.
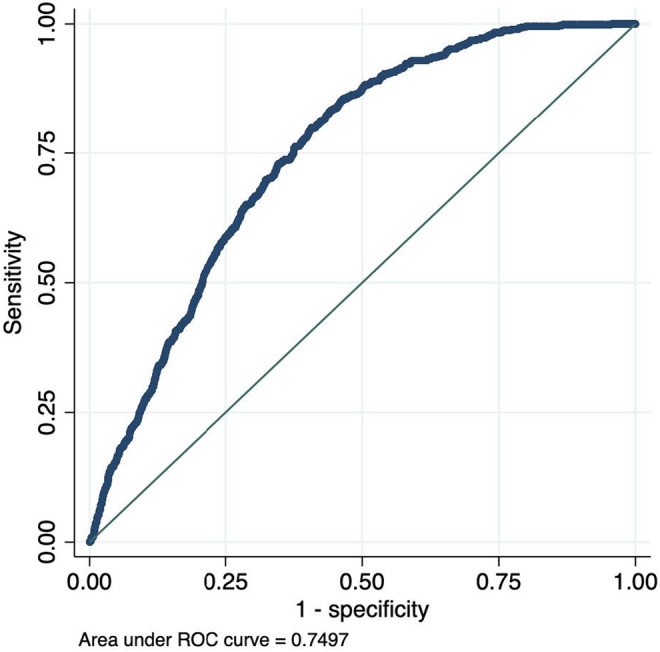
ROC curve for AF occurrence by predicted risk on 24hECG, “ECG‐only” model.
FIGURE 3.
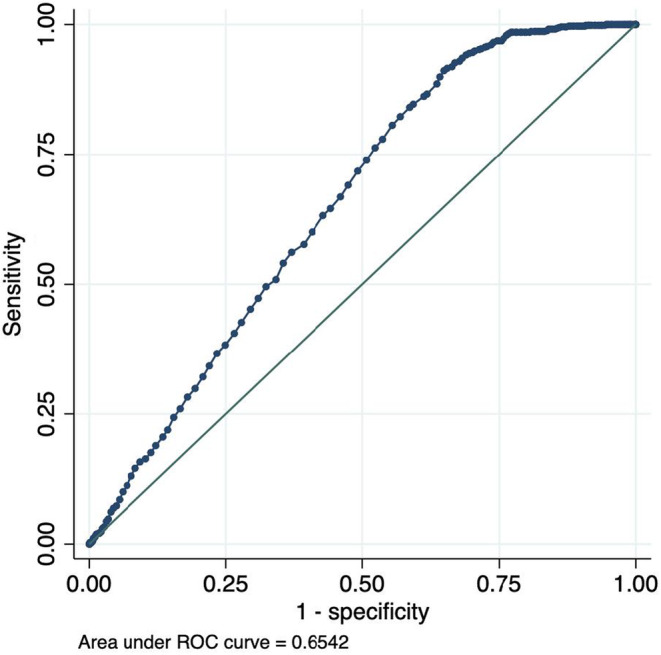
ROC curve for AF occurrence by predicted risk using age and sex only model.
Table 3 reports the observed AF events across quintiles of predicted risk in the testing dataset for each model. Both models tended to slightly lower observed than predicted risk in the lowest quintile, and somewhat higher observed than expected events in quintile 4. The calibration plots (Figures 3, 4, 5) indicate some underfitting for both the full model and the “ECG‐only” model (slope 1.423 and 1.416, respectively). Both models resulted in higher observed than expected event rates in the top decile of predicted risk. A calibration plot for the age and sex only model is presented in Figure 6.
TABLE 3.
Detection of atrial fibrillation by quintiles of predicted probability, computed in the testing dataset (n = 9110 in the full population and n = 728 in the poststroke/TIA population).
| Full population | |||||
|---|---|---|---|---|---|
| Full model | Q1 (n = 1822) | Q2 (n = 1822) | Q3 (n = 1822) | Q4 (n = 1822) | Q5 (n = 1822) |
| Predicted risk, % | 0.5–2.8 | 2.8–4.7 | 4.7–7.4 | 7.4–10.9 | >10.0 |
| Observed AF events, n (%) | 4 (0.22) | 51 (2.8) | 113 (6.2) | 209 (11.5) | 289 (15.9) |
| Mean age (SD), years | 41.8 (15.7) | 61.4 (14.1) | 69.7 (10.4) | 73.0 (9.6) | 76.3 (8.8) |
| Age ≥65 years, % | 11.7 | 50.4 | 77.9 | 87.8 | 93.3 |
| Male sex, % | 35.7 | 43.0 | 43.9 | 43.4 | 45.8 |
| ECG only model | Q1 (n = 1816) | Q2 (n = 1828) | Q3 (n = 1822) | Q4 (n = 1822) | Q5 (n = 1822) |
| Predicted risk, % | 0.5–2.8 | 2.8–4.7 | 4.7–7.4 | 7.4–11.0 | >11.0 |
| Observed AF events, n (%) | 7 (0.4) | 49 (2.7) | 113 (6.2) | 208 (11.4) | 289 (15.9) |
| Mean age | 42.4 (16.1) | 61.3 (14.5) | 69.4 (11.0) | 72.9 (9.8) | 76.0 (8.9) |
| Age ≥65 years, % | 13.1 | 51.0 | 76.6 | 87.6 | 92.8 |
| Male sex, % | 35.8 | 42.7 | 44.0 | 43.6 | 45.9 |
| Poststroke/TIA patients | |||||
|---|---|---|---|---|---|
| Full model | Q1 (n = 145) | Q2 (n = 146) | Q3 (n = 145) | Q4 (n = 146) | Q5 (n = 146) |
| Predicted risk, % | 1.2–3.5 | 3.5–5.3 | 5.3–7.8 | 7.8–11.1 | >11.1 |
| Observed AF events, n (%) | 1 (0.7) | 2 (1.4) | 4 (2.8) | 6 (4.1) | 16 (11.0) |
| Mean age (SD), years | 58.6 (14.4) | 69.8 (9.4) | 73.3 (7.8) | 76.4 (7.4) | 78.5 (8.4) |
| Age ≥65 years, % | 39.3 | 78.1 | 90.3 | 94.5 | 96.6 |
| Male sex, % | 50.0 | 48.6 | 46.2 | 50.7 | 45.9 |
| ECG only model | |||||
| Predicted risk, % | 1.2–3.5 | 3.5–5.2 | 5.2–7.7 | 7.7–11.0 | >11.0 |
| Observed AF events, n (%) | 1 (0.7) | 2 (1.4) | 4 (2.8) | 6 (4.1) | 16 (11.0) |
| Mean age | 54.8 (16.0) | 67.0 (10.4) | 72.2 (9.2) | 75.6 (7.7) | 78.2 (8.4) |
| Age ≥65 years, % | 29.0 | 68.1 | 85.9 | 92.6 | 96.1 |
| Male sex, % | 43.4 | 51.3 | 47.9 | 48.6 | 47.4 |
FIGURE 4.
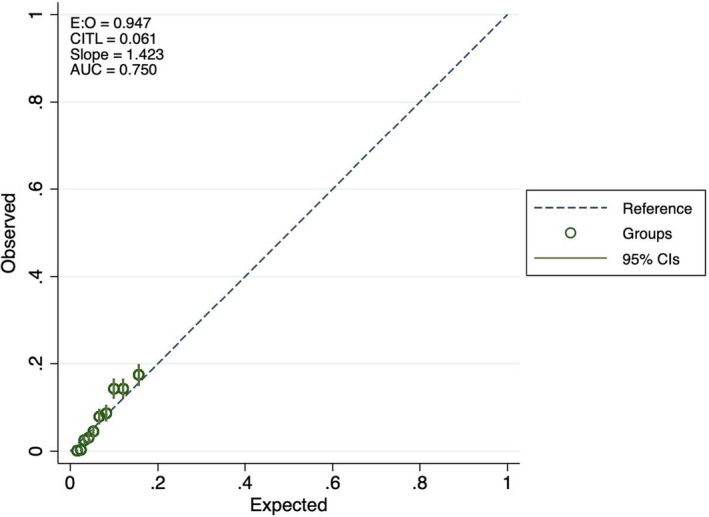
Calibration plots for atrial fibrillation prediction, full model.
FIGURE 5.
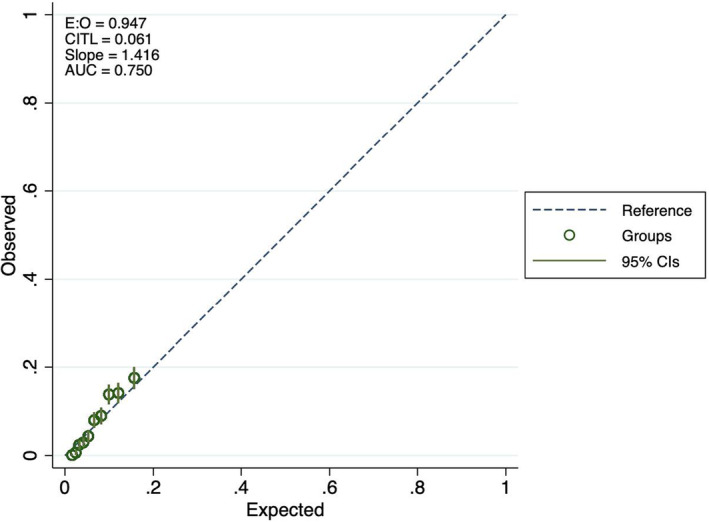
Calibration plots for atrial fibrillation prediction, ECG only model.
FIGURE 6.
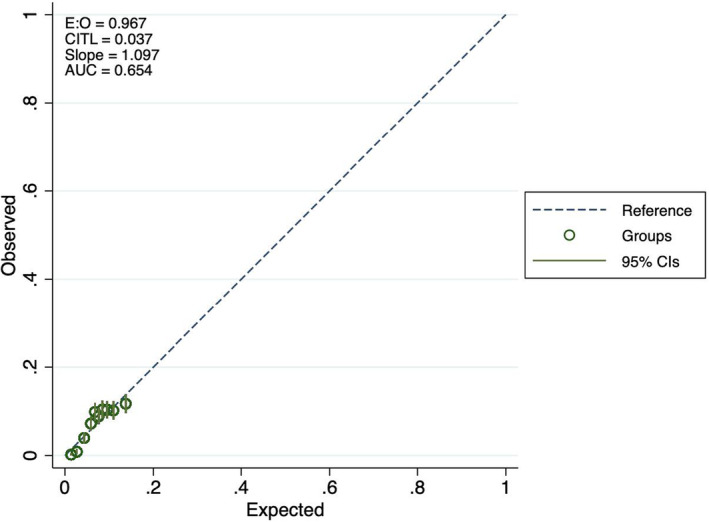
Calibration plots for atrial fibrillation prediction, age and sex only model.
The deviance statistic and deviance ratio did not indicate substantially poorer fit in the testing than in the training dataset, 0.4611 and 0.077 in the training dataset and 0.4726 and 0.097 in the testing dataset for the full model, and 0.4727 and 0.0965 in the testing dataset for the “ECG‐only” model. The Hosmer–Lemeshow test chi2 was 92.3, p < .0001, in the testing dataset for the full model and 87.03, p < .0001 for the ECG model.
3.2. Poststroke/TIA patients
We also tested the performance of the full model and the ECG only model among patients monitored with stroke/TIA as an indication. The testing dataset included 738 patients and 26 events. The discrimination in this subpopulation was good, 0.7365 for the full model and 0.7355 (95% CI 0.6494–0.8216) for the ECG only model. The observed AF events across quintiles of predicted risk are reported in Table 3. The Hosmer–Lemeshow test chi2 was 8.93, p = .35 for the full model and 17.4, p = .03 for the ECG only model.
In the full poststroke/TIA population, 17.3% of patients (258/1492) had a normal 24 h ECG according to prespecified criteria. The risk of AF was significantly lower in this group, with only one case of incident AF during the subsequent monitoring (0.4%) compared to a rate of 4.4% in the rest of the stroke/TIA population (p = 0.002), resulting in a negative predictive value of 99.6%. The patients with normal 24 h ECG findings were substantially younger (60.8 (14.1) years compared to 73.3 (10.0) years, p < .0001), but there were no significant differences in sex or recording duration (both p > .5).
3.3. Characteristics of patients with high versus “low‐risk” of AF
Using predicted probabilities of AF from the “ECG‐only” model, a successful match was created between 2465 “high‐risk” and “low‐risk” pairs, with a similar gender distribution as the larger cohort and a mean age of 72 years (Table 4). Median (IQR) predicted probability of AF was 12.5% in the high‐risk group and 3.8% in the “low‐risk” group, while the observed rates of AF occurrence during mobile cardiac telemetry monitoring were five times more common in the “high‐risk” group (15.4%) compared to 3.5%. The “high‐risk” group differed substantially from the “low‐risk” group as regards mean, maximum, and minimum heart rate, which were all significantly lower, as well as the occurrence of PACs, which were significantly more common. The median PAC count in the “high‐risk” group was relatively low, at 1049 PACs per 24 h. In contrast, the median PAC count in the “low‐risk” group was 15. There were also substantial differences as regards the occurrence of PAC couplets, triplets, and runs of four beats or more, all of which were substantially more common among “high‐risk” compared to “low‐risk” patients. Finally, in “high‐risk” patients, we also observed significantly higher heart rates during couplets and triplets of PACs compared to “low‐risk” patients.
TABLE 4.
Characteristics of patients with high versus low risk of AF during ≤30 days of monitoring, matched for age, sex, and recording duration.
| Low risk | High risk | p‐Value | |
|---|---|---|---|
| N | 2465 | 2465 | |
| Age, mean (SD) | 71.5 (8.2) | 71.6 (8.1) | Matching variable |
| Probability of AF, median (IQR) | 3.8 (3.1–4.4) | 12.5 (11.1–14.5) | |
| Observed AF outcome events, % | 3.5% | 15.4% | <.001 |
| Male sex | 1089 (44.2) | 1089 (44.2) | Matching variable |
| Mean heart rate, mean (SD) | 75.4 (9.8) | 67.3 (10.0) | <.001 |
| Max heart rate, mean (SD) | 114.7 (16.7) | 99.3 (14.8) | <.001 |
| Minimum heart rate, mean (SD) | 59.0 (9.0) | 53.0 (8.6) | <.001 |
| Total PACs, median (IQR) | 15 (6, 30) | 1049 (311, 3799) | <.001 |
| Single PACs, median (IQR) | 12 (5, 23) | 839 (233, 3069) | <.001 |
| Occurrence of any PAC couplet, n (%) | 4.9 | 72.9 | <.001 |
| Number of PAC couplets, median (IQR) | 0 (0, 1) | 14 (5, 54) | <.001 |
| Occurrence of any PAC triplet, n (%) | 8.5 | 90.9 | <.001 |
| Number of PAC triplets, median (IQR) | 0 (0, 0) | 3 (1, 10) | <.001 |
| Occurrence of any SVT ≥4 beats, n (%) | 216 (8.7) | 2254 (91.3) | <.001 |
| SVTs ≥4 beats, median (IQR) | 0 (0, 0) | 3 (1, 8) | <.001 |
| AIVR events, median (IQR) | 0 (0, 0) | 0 (0, 0) | .23 |
| Total PVCs, median (IQR) | 18 (2, 202) | 88 (11, 566) | .96 |
| Single PVCs, median (IQR) | 17 (2, 198) | 84 (10, 548) | .60 |
| Occurrence of any PVC couplet, n (%) | 41.3 | 67.6 | <.001 |
| Number of PVC couplets, median (IQR) | 0 (0, 0) | 0 (0, 3) | .08 |
| Occurrence of any PVC triplet, n (%) | 47.8 | 69.4 | <.001 |
| Number of PVC triplets, median (IQR) | 0 (0, 0) | 0 (0, 0) | .01 |
| Occurrence of any VT run ≥4 beats | 79 (3.2) | 218 (8.8) | <.001 |
| Number of VT runs ≥4 beats, median (IQR) | 0 (0, 0) | 0 (0, 0) | .002 |
| Fastest pair interval rate of PAC couplet, bpm mean (SD) | 123 (22) | 137 (26) | <.001 |
| Fastest rate of PAC triplets, mean (SD) | 116 (22) | 130 (26) | <.001 |
| Fastest rate of SVT runs, mean (SD) | 127 (24) | 132 (24) | .003 |
| Fastest pair interval rate of PVC couplet, mean (SD) | 136 (32) | 135 (32) | .74 |
| Fastest rate of PVC triplets, mean (SD) | 125 (29) | 122 (34) | .80 |
| Fastest rate of VT runs, mean (SD) | 129 (23) | 134 (26) | .69 |
4. DISCUSSION
Using a large clinical database of full disclosure mobile cardiac telemetry recordings, we show that the occurrence of AF can be predicted using standard ECG variables obtained with a 24‐h ambulatory ECG recording, both in an unselected patient population referred to MCT monitoring and among patients referred poststroke/TIA. The model discrimination was good, and calibration was acceptable; if anything, the observed risk for “high‐risk” patients was even higher than predicted, which further motivates extended ECG monitoring. The PocketECG risk score for concurrent AF could be computed automatically based on data from any full disclosure ambulatory ECG device, and be used to alert clinicians to patients with increased risk of AF, who could then be selected for extended or repeated monitoring. At the same time, in the lowest quintile of the score, AF was detected in only one of 250 patients, resulting in a negative predictive value of 99.6%. The mean age in this quintile was lower, but more than one in eight patients was older than 65 years. The results were similar among poststroke/TIA patients, where the negative predictive value in the lower quintile of the score was 99.3%. These are patients who may not benefit from extended monitoring regardless of age, even in the poststroke setting. We also hypothesized that simplified 24hECG‐based criteria to identify poststroke patients without need of long‐term monitoring could be derived, although this finding needs to be confirmed in external population samples.
A previous study has applied a machine learning approach to predict AF based on shorter ambulatory monitoring, which did not result in substantially better ROC statistics (Singh et al., 2022). An advantage of the present approach is its comparative simplicity, and the fact that the relation between ECG features and AF risk is described. Several of the ECG features associated with AF risk have been found to predict incident AF over longer follow‐up periods. For example, PACs and supraventricular tachycardia episodes (SVTs) predict AF in both population‐based and clinical samples (Grundvold et al., 2013; Johnson et al., 2015; Xiao et al., 2021), and PACs originating in the pulmonary veins are known to trigger AF episodes (Haissaguerre et al., 1998). Low resting heart rate, as well as mean heart rate during ambulatory ECG, is also known to predict later incident AF (Grundvold et al., 2013; Persson et al., 2020). Besides showing that these factors can be used to predict concurrent paroxysmal AF that can be detected with extended monitoring, our study is the first to show that the pattern of occurrence of PACs and PVCs has clinical relevance: PAC couplets and triplets were significantly more common, and had higher maximal heart rate in “high‐risk” compared to “low‐risk” patients. This is a novel finding. Besides the number of PACs, the rate of couplets, triplets, and SVTs as well as the duration of SVTs were the only variables included in the ECG only model.
The addition of age and sex to ECG variables resulted in selection of more variables, but did not improve discrimination or calibration. This indicates that much of the effect of biological age on AF risk can be described by these simple ambulatory ECG variables. The mean age across quintiles of predicted risk was similar for both the full model and the “ECG only” model, with a slight difference toward younger patients in the lowest quintile of the full model. Both models including ECG variables performed substantially better than a model based either only on age and sex, or with the addition of the binary variable ESVEA. Briefly, a 24hECG that indicates a higher risk of AF is one with modestly increased PACs and PVCs occurring as fast couplets, triplets, and SVTs, as well as a low mean heart rate. Further improvement in AF prediction could perhaps be achieved with more detailed ECG data, such as p‐wave indices, or with the addition of clinical data.
Ambulatory ECG recordings of a duration of one or a few days are commonly performed, but studies that inform clinical management of patients with ambulatory ECG findings that indicate AF risk have been lacking. There is also uncertainty regarding at what level an increased PAC rate should be considered an abnormal finding that indicates elevated risk. We found a moderately increased PAC rate in patients with high risk, suggesting an appropriate cutoff point for PACs that indicate increased AF risk at approximately 1000/24 h. This is in accordance with previous studies, notably the EMBRACE trial, in which the risk of AF detected by mobile cardiac telemetry (MCT) associated with 24 h PAC counts plateaued after approximately 1000–1500 PACs in poststroke patients (Gladstone et al., 2015).
Some evidence suggests that atrial myopathy, that is, electrical and morphological factors that predispose to AF (Goldberger et al., 2015; Yaghi & Kamel, 2017), may be independently related to stroke risk, regardless of whether AF episodes with a duration of ≥30 s occur or not. For example, PACs are independently related to stroke in patients with sinus rhythm (Larsen et al., 2015), as is left atrial enlargement (Overvad et al., 2016). It is therefore possible that this AF risk score based on ECG parameters could be used to assess stroke risk; future studies of this topic would be interesting (Gladstone et al., 2015).
A major limitation of this study is that we do not have access to clinical data on the study population. One can argue that most ambulatory ECGs are interpreted independently of other clinical risk factors or clinical risk score, but it would be highly interesting to assess whether the ECG‐based score is useful across strata of CHA2DS2‐Vasc scores (Lip et al., 2010), or in conjunction with other clinical AF risk scores such as the CHARGE score (Alonso et al., 2013), or the ABC‐AF score (Benz et al., 2021).
5. CONCLUSION
Data derived from a 24‐h ambulatory ECG recording can be used to predict the occurrence of AF on a subsequent up to 30‐day ambulatory ECG, and identify patients with both high and low risk of AF, and thus rationalize the use of extended ECG monitoring, including in the poststroke/TIA setting.
AUTHOR CONTRIBUTION
LSJ conceived the study with MD, performed the analyses and drafted the manuscript. All other authors provided critical revisions of the manuscript.
FUNDING INFORMATION
Dr Johnson is supported by the Swedish Society of Medicine. Dr Johnson and Dr Engström are supported by the Swedish Heart and Lung Foundation and the Swedish Research Council.
CONFLICT OF INTEREST STATEMENT
MS, AG, and OW are MEDICALgorithmics employees. MD is a MEDICALgorithmics equity holder. NN is a previous MEDICALgorithmics employee. LJ has received consulting fees from MEDICALgorithmics; JSH GE, SB, JB, LS none declared.
ETHICS STATEMENT
The study conforms to the declaration of Helsinki.
Supporting information
Figures S1‐S2
Johnson, L. S. , Måneheim, A. , Slusarczyk, M. , Grotek, A. , Witkowska, O. , Bacevicius, J. , Sörnmo, L. , Dziubinski, M. , Bhavnani, S. , Healey, J. S. , & Engström, G. (2023). Can 24 h of ambulatory ECG be used to triage patients to extended monitoring? Annals of Noninvasive Electrocardiology, 28, e13090. 10.1111/anec.13090
DATA AVAILABILITY STATEMENT
The data underlying this article were provided by MEDICALgorithmics by permission to Lund University. Data will be shared on reasonable request to the corresponding author with permission of MEDICALgorithmics.
REFERENCES
- Alonso, A. , Krijthe, B. P. , Aspelund, T. , Stepas, K. A. , Pencina, M. J. , Moser, C. B. , Sinner, M. F. , Sotoodehnia, N. , Fontes, J. D. , Janssens, A. C. , Kronmal, R. A. , Magnani, J. W. , Witteman, J. C. , Chamberlain, A. M. , Lubitz, S. A. , Schnabel, R. B. , Agarwal, S. K. , McManus, D. D. , Ellinor, P. T. , … Benjamin, E. J. (2013). Simple risk model predicts incidence of atrial fibrillation in a racially and geographically diverse population: The CHARGE‐AF consortium. Journal of the American Heart Association, 2, e000102. 10.1161/JAHA.112.000102 [DOI] [PMC free article] [PubMed] [Google Scholar]
- Benz, A. P. , Hijazi, Z. , Lindback, J. , Connolly, S. J. , Eikelboom, J. W. , Oldgren, J. , Siegbahn, A. , & Wallentin, L. (2021). Biomarker‐based risk prediction with the ABC‐AF scores in patients with atrial fibrillation not receiving oral anticoagulation. Circulation, 143, 1863–1873. 10.1161/CIRCULATIONAHA.120.053100 [DOI] [PubMed] [Google Scholar]
- Binici, Z. , Intzilakis, T. , Nielsen, O. W. , Kober, L. , & Sajadieh, A. (2010). Excessive supraventricular ectopic activity and increased risk of atrial fibrillation and stroke. Circulation, 121, 1904–1911. 10.1161/CIRCULATIONAHA.109.874982 [DOI] [PubMed] [Google Scholar]
- Dziubinski, M. , Napiorkowski, N. , Witkowska, O. , Swiecak, M. A. , Grotek, A. M. , & Johnson, L. S. (2021). Diagnostic yield is dependent on monitoring duration. Insights from a full‐disclosure mobile cardiac telemetry system. Kardiologia Polska, 80, 49–55. 10.33963/KP.a2021.0182 [DOI] [PubMed] [Google Scholar]
- Gladstone, D. J. , Dorian, P. , Spring, M. , Panzov, V. , Mamdani, M. , Healey, J. S. , Thorpe, K. E. , & EMBRACE Steering Committee and Investigators . (2015). Atrial premature beats predict atrial fibrillation in cryptogenic stroke: Results from the EMBRACE trial. Stroke, 46, 936–941. 10.1161/STROKEAHA.115.008714 [DOI] [PubMed] [Google Scholar]
- Goldberger, J. J. , Arora, R. , Green, D. , Greenland, P. , Lee, D. C. , Lloyd‐Jones, D. M. , Markl, M. , Ng, J. , & Shah, S. J. (2015). Evaluating the atrial myopathy underlying atrial fibrillation: Identifying the arrhythmogenic and thrombogenic substrate. Circulation, 132, 278–291. 10.1161/circulationaha.115.016795 [DOI] [PMC free article] [PubMed] [Google Scholar]
- Grundvold, I. , Skretteberg, P. T. , Liestol, K. , Erikssen, G. , Engeseth, K. , Gjesdal, K. , Kjeldsen, S. E. , Arnesen, H. , Erikssen, J. , & Bodegard, J. (2013). Low heart rates predict incident atrial fibrillation in healthy middle‐aged men. Circulation. Arrhythmia and Electrophysiology, 6, 726–731. 10.1161/CIRCEP.113.000267 [DOI] [PubMed] [Google Scholar]
- Haissaguerre, M. , Jais, P. , Shah, D. C. , Takahashi, A. , Hocini, M. , Quiniou, G. , Garrigue, S. , Le Mouroux, A. , Le Metayer, P. , & Clementy, J. (1998). Spontaneous initiation of atrial fibrillation by ectopic beats originating in the pulmonary veins. The New England Journal of Medicine, 339, 659–666. 10.1056/NEJM199809033391003 [DOI] [PubMed] [Google Scholar]
- Johnson, L. S. , Juhlin, T. , Juul‐Moller, S. , Hedblad, B. , Nilsson, P. M. , & Engstrom, G. (2015). A prospective study of supraventricular activity and incidence of atrial fibrillation. Heart Rhythm, 12, 1898–1904. 10.1016/j.hrthm.2015.04.042 [DOI] [PubMed] [Google Scholar]
- Johnson, L. S. B. , Persson, A. P. , Wollmer, P. , Juul‐Moller, S. , Juhlin, T. , & Engstrom, G. (2018). Irregularity and lack of p waves in short tachycardia episodes predict atrial fibrillation and ischemic stroke. Heart Rhythm, 15, 805–811. 10.1016/j.hrthm.2018.02.011 [DOI] [PubMed] [Google Scholar]
- Larsen, B. S. , Kumarathurai, P. , Falkenberg, J. , Nielsen, O. W. , & Sajadieh, A. (2015). Excessive atrial ectopy and short atrial runs increase the risk of stroke beyond incident atrial fibrillation. Journal of the American College of Cardiology, 66, 232–241. 10.1016/j.jacc.2015.05.018 [DOI] [PubMed] [Google Scholar]
- Lip, G. Y. , Nieuwlaat, R. , Pisters, R. , Lane, D. A. , & Crijns, H. J. (2010). Refining clinical risk stratification for predicting stroke and thromboembolism in atrial fibrillation using a novel risk factor‐based approach: The Euro Heart Survey on atrial fibrillation. Chest, 137, 263–272. 10.1378/chest.09-1584 [DOI] [PubMed] [Google Scholar]
- Overvad, T. F. , Nielsen, P. B. , Larsen, T. B. , & Sogaard, P. (2016). Left atrial size and risk of stroke in patients in sinus rhythm. A systematic review. Thrombosis and Haemostasis, 116, 206–219. 10.1160/TH15-12-0923 [DOI] [PubMed] [Google Scholar]
- Persson, A. P. , Fedorowski, A. , Hedblad, B. , Persson, M. , Juul‐Moller, S. , Engstrom, G. , & Johnson, L. S. B. (2020). Heart rate and premature atrial contractions at 24hECG independently predict atrial fibrillation in a population‐based study. Heart, 106, 287–291. 10.1136/heartjnl-2019-315119 [DOI] [PubMed] [Google Scholar]
- Singh, J. P. , Fontanarava, J. , de Massé, G. , Carbonati, T. , Li, J. , Henry, C. , & Fiorina, L. (2022). Short term prediction of atrial fibrillation from ambulatory monitoring ECG using a deep neural network. European Heart Journal ‐ Digital Health, 3, 208–217. 10.1093/ehjdh/ztac014 [DOI] [PMC free article] [PubMed] [Google Scholar]
- Xiao, J. , Persson, A. P. , Engstrom, G. , & Johnson, L. S. B. (2021). Supraventricular arrhythmia, N‐terminal pro‐brain natriuretic peptide and troponin T concentration in relation to incidence of atrial fibrillation: A prospective cohort study. BMC Cardiovascular Disorders, 21, 134. 10.1186/s12872-021-01942-6 [DOI] [PMC free article] [PubMed] [Google Scholar]
- Yaghi, S. , & Kamel, H. (2017). Stratifying stroke risk in atrial fibrillation: Beyond clinical risk scores. Stroke, 48, 2665–2670. 10.1161/STROKEAHA.117.017084 [DOI] [PMC free article] [PubMed] [Google Scholar]
Associated Data
This section collects any data citations, data availability statements, or supplementary materials included in this article.
Supplementary Materials
Figures S1‐S2
Data Availability Statement
The data underlying this article were provided by MEDICALgorithmics by permission to Lund University. Data will be shared on reasonable request to the corresponding author with permission of MEDICALgorithmics.


