

Abstract
Cellular inhibitor of apoptosis proteins (cIAPs) are RING‐containing E3 ubiquitin ligases that ubiquitylate receptor‐interacting protein kinase 1 (RIPK1) to regulate TNF signalling. Here, we established mice simultaneously expressing enzymatically inactive cIAP1/2 variants, bearing mutations in the RING domains of cIAP1/2 (cIAP1/2 mutant RING, cIAP1/2MutR). cIap1/2 MutR/MutR mice died during embryonic development due to RIPK1‐mediated apoptosis. While expression of kinase‐inactive RIPK1D138N rescued embryonic development, Ripk1 D138N/D138N /cIap1/2 MutR/MutR mice developed systemic inflammation and died postweaning. Cells expressing cIAP1/2MutR and RIPK1D138N were still susceptible to TNF‐induced apoptosis and necroptosis, implying additional kinase‐independent RIPK1 activities in regulating TNF signalling. Although further ablation of Ripk3 did not lead to any phenotypic improvement, Tnfr1 gene knock‐out prevented early onset of systemic inflammation and premature mortality, indicating that cIAPs control TNFR1‐mediated toxicity independent of RIPK1 and RIPK3. Beyond providing novel molecular insights into TNF‐signalling, the mouse model established in this study can serve as a useful tool to further evaluate ongoing therapeutic protocols using inhibitors of TNF, cIAPs and RIPK1.
Keywords: cIAP1, cIAP2, RIPK1, TNF, ubiquitin
Subject Categories: Autophagy & Cell Death, Signal Transduction
New mouse models show that ubiquitin ligase activities of cIAP1/2 are required to regulate RIPK1 kinase activity for embryonic survival and to control tissue inflammation in adult mice without involving RIPK1 kinase activity.

Introduction
Cellular inhibitor of apoptosis protein 1 and 2 (cIAP1 and cIAP2) are baculoviral inhibitor of apoptosis protein homologs encoded by the closely linked Birc2 and Birc3 genes and were first identified as components of the tumour necrosis factor receptor (TNFR) signalling complex (Rothe et al, 1995; Liston et al, 1996; Uren et al, 1996). The association of cIAPs with TNFR1 and TNFR2 requires interaction with TNF receptor‐associated factor 2 (TRAF2; Rothe et al, 1995; Shu et al, 1996), which upon binding mediates TNF‐induced gene expression via mitogen‐activated protein kinases (MAPK) and nuclear factor κB (NFκB) signalling (Yeh et al, 1997). cIAP1 and cIAP2 exhibit high homology in their amino acid sequence and domain structures composed of three tandem amino‐terminal baculovirus IAP repeats (BIRs) followed by a caspase recruitment domain (CARD) and a carboxy‐terminal RING finger domain. Although the BIR domains direct the interaction with different factors such as TRAF2 (Samuel et al, 2006; Varfolomeev et al, 2006), the RING domain of cIAP1/2 catalyses ubiquitylation of target proteins, including autoubiquitylation, and controls increasingly complex and diverse cellular actions (Vaux & Silke, 2005). Accordingly, cIAPs ubiquitylate receptor‐interacting protein kinase 1 (RIPK1), thereby blocking its kinase activity, and to inhibit TNF‐mediated cell death, while promoting prosurvival signalling downstream of TNFR1 (Park et al, 2004; Bertrand et al, 2008; Mahoney et al, 2008; Varfolomeev et al, 2008; Moulin et al, 2012). In addition, cIAPs are known to promote the ubiquitylation and subsequent proteasomal degradation of NFκB‐inducing kinase (NIK) to block noncanonical NFκB signalling in resting cells (Varfolomeev et al, 2007; Vince et al, 2007, 2009).
IAP antagonists that bind in the BIR2 and 3 grooves of cIAPs rapidly activate their E3 ubiquitin ligase activity leading to their autoubiquitylation. Ubiquitylated cIAPs then undergo rapid proteasomal degradation which, in turn, causes NIK accumulation on the one hand and RIPK1 kinase activity‐dependent TNF‐induced cell death on the other hand (Varfolomeev et al, 2007; Vince et al, 2007). Mice lacking either cIAP1 or cIAP2 are essentially normal (Conze et al, 2005; Conte et al, 2006) raising the possibility that cIAPs have redundant, or at least partially overlapping functions (Silke & Vaux, 2015). Loss of both cIAP1 and cIAP2 (cIap1 −/− /cIap2 −/− ) causes lethality around embryonic day 10.5 (E10.5) indicating that cIAPs are required for embryonic development (Moulin et al, 2012). Deletion of Tnfr1 allowed cIap1 −/− /cIap2 −/− embryos to develop until birth and cIap1 −/− /cIap2 −/− embryos lacking either Ripk1 or Ripk3 survived until E12.5 or E15.5, respectively. These data suggest that cIAPs limit TNFR1‐induced RIPK1/3‐dependent cell death during embryonic development (Moulin et al, 2012). A recent independent study showed that cIap1 −/− /cIap2 −/− embryos lacking Caspase‐8 and Mlkl only survived to birth suggesting that cIAPs also control cell death‐independent processes in mouse embryos that can cause perinatal lethality (Zhang et al, 2019a). Conditional deletion of cIap1/2 in adult mice caused inflammation and acute lethality, which was significantly alleviated, but not fully prevented with a combined deletion of Caspase‐8 and Ripk3 (Zhang et al, 2019a). While these studies show that control of TNF‐induced cell death is a major physiological role of cIAPs, deficiency in cell death signalling could not completely rescue the knock‐out phenotype. Thus, there is a still undefined role for cIAP1/2 in cell fate decisions.
Results
cIAP1/2 E3 ubiquitin ligase activity is required for embryonic development
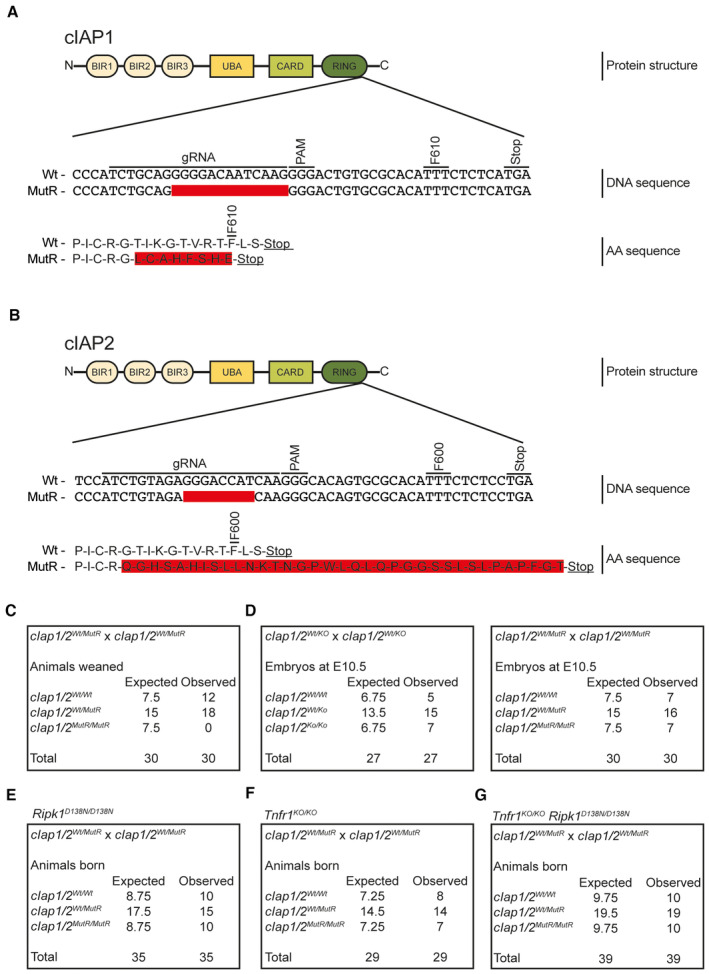
In order to investigate the physiologic role of the E3 ubiquitin ligase activity of cIAPs, both cIap1/2 genes were targeted in parallel using CRISPR/Cas9 gene editing aiming to replace the critical phenylalanine by alanine at position 610 and 600 in cIAP1 and cIAP2, respectively (Mace et al, 2008; Haas et al, 2009; Feltham et al, 2011). Sanger sequencing of the founder population revealed that none of the animals harboured the specific knock‐in mutations; however, one female was found to carry small deletions on both loci. For cIap1, a 13 bp deletion was identified leading to a frameshift that shortens the protein by three amino acids introducing a premature stop codon at position 610 (T602LfsTer7; Fig EV1A). The cIap2 locus harboured an 8 bp deletion introducing a frameshift, which prolonged the mutant protein by 23 amino acids changing the phenylalanine at position 600 to a leucine (G601QfsTer34) (Fig EV1B). The founder female was backcrossed three times to C57BL/6N wild‐type mice to eliminate possible CRISPR/Cas9‐mediated off‐target effects. Hereafter, the mutations introduced are termed cIAP1/2 mutant RING (cIAP1/2MutR).
Figure EV1. Generation of cIAP1/2 mutant mouse lines.
-
ASchematic depiction of the cIAP1 protein structure. Upper DNA sequence displays the binding site of the sgRNA targeting the cIap1 locus and its location upstream of the phenylalanine (F) at position 610. Lower DNA sequence shows the 13 bp deletion (red area) introduced by the CRISPR/Cas9 system. The respective amino acid sequence presents a comparison between the wild‐type (Wt) (upper sequence) and the mutated sequence (lower sequence, red area).
-
BSchematic illustration of the cIAP2 protein structure. Upper DNA sequence displays the binding site of the sgRNA targeting the cIap2 locus and its location upstream of the phenylalanine (F) at position 600. Lower DNA sequence shows the 8 bp deletion (red area) introduced by the CRISPR/Cas9 system. The respective amino acid sequence presents a comparison between the Wt (upper sequence) and prolonged sequence of the mutant protein (lower sequence, red area).
-
CExpected and observed animal numbers at weaning age per genotype derived from the indicated crosses (expected numbers are based on Mendelian ratios).
-
DExpected and observed embryo numbers at E10.5 per genotype derived from the indicated crosses (expected numbers are based on Mendelian ratios).
-
E–GExpected and observed animal numbers at weaning age per genotype derived from the indicated crosses (expected numbers are based on Mendelian ratios).
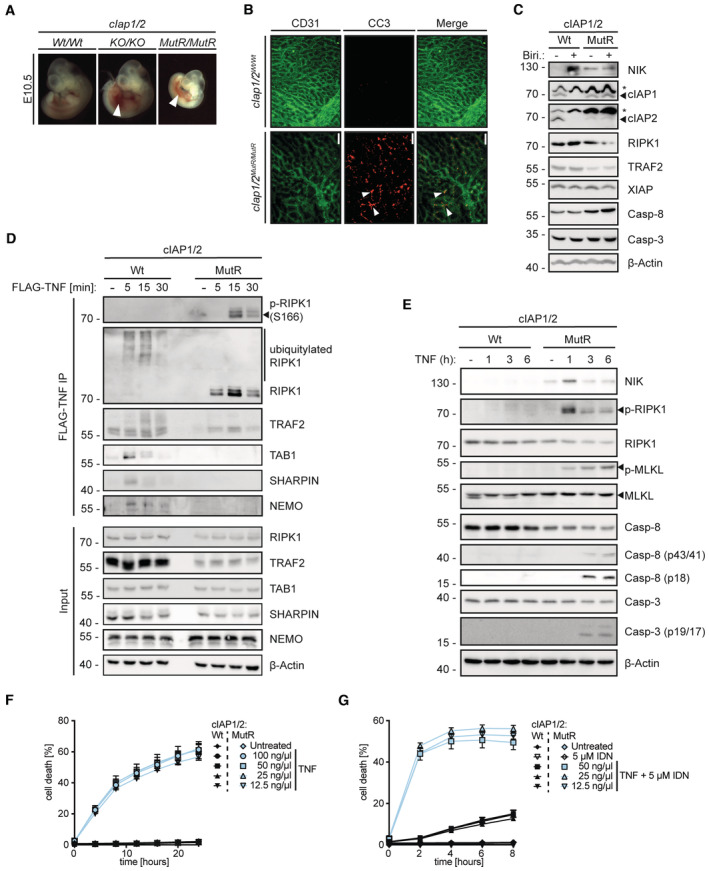
Intercrossing heterozygous cIap1 Wt/MutR /cIap2 Wt/MutR mice failed to produce progeny carrying homozygous cIAP1/2 RING mutations (cIap1 MutR/MutR /cIap2 MutR/MutR ; Fig EV1C) indicating that these mice die during embryonic development. Further analyses showed that similar to cIap1 KO/KO /cIap2 KO/KO double knock‐out (DKO) embryos, cIap1 MutR/MutR /cIap2 MutR/MutR embryos were present at the expected Mendelian frequencies (Fig EV1D) but showed signs of haemorrhage indicative of defects in vascular development between E10.5 and E11.5 (Fig 1A). Yolk sacs isolated from embryos at E10.5 exhibited reduced vascularisation while showing excessive caspase‐3 cleavage (Fig 1B), suggesting that the E3 ubiquitin ligase activity of cIAP1/2 is required to prevent uncontrolled endothelial cell apoptosis during embryonic development. Our in vitro analyses using mouse embryonic fibroblasts (MEFs) showed that cIAP1 and cIAP2 MutR variants resisted birinapant‐induced degradation (Fig 1C). Furthermore, cIAP1/2MutR MEFs accumulated NIK, providing confirmation that the cIAP1/2MutR proteins lack E3 ubiquitin ligase activity (Fig 1C). In Wt MEFs, NIK could only be detected after birinapant treatment. Furthermore, the expression levels of cIAP2MutR and TRAF2 appeared lower in cIAP1/2MutR MEFs, which may additionally contribute to NIK stabilisation as it requires a coordinated assembly of cIAP1/2 and TRAF2/3 protein complex (Zarnegar et al, 2008; Dumetier et al, 2020).
Figure 1. cIAP1/2 E3 ubiquitin ligase activity is required for embryonic development.
-
ARepresentative images of cIAP1/2 Wt/Wt (n = 5), cIAP1/2 KO/KO (n = 6), and cIAP1/2 MutR/MutR (n = 6) embryos isolated at E10.5. Arrowheads indicate haemorrhages.
-
BWhole‐mount yolk sacs isolated at E10.5 from cIAP1/2 Wt/Wt (n = 4), and cIAP1/2 MutR/MutR (n = 3) embryos, stained for CD31 (green) and cleaved caspase‐3 (CC3) (red). White arrowheads indicate apoptotic endothelial cells. Scale bar: 100 μm.
-
CWestern blotting (WB) of cIAP1/2Wt and cIAP1/2MutR MEFs. Cells were pretreated for 3 h with either DMSO or 20 μM birinapant (Biri.). Cell lysates were analysed for the expression of the indicated proteins (* indicates unspecific bands).
-
DMEFs were treated with FLAG‐TNF (1 μg/ml) for the indicated times. TNFR1 protein complex was purified and analysed by WB.
-
EMEFs were treated with TNF (100 ng/ml) for the indicated times. Cell lysates were analysed by WB.
-
FIncuCyte analysis to determine % cell death in MEFs after treatment with increasing concentrations of TNF at indicated time points.
-
GIncuCyte analysis to determine % cell death in MEFs after co‐treatment with 5 μM IDN‐6556 (IDN) and increasing concentrations of TNF at indicated time points.
Data information: Data points in (F) and (G) represent mean ± SEM of three technical replicates.
Source data are available online for this figure.
Consistent with previous reports (Haas et al, 2009; Vince et al, 2009; Annibaldi et al, 2018), our analysis of the TNFR1 multiprotein complex using FLAG‐tagged‐TNF (FLAG‐TNF) pull‐down assay revealed the successful recruitment of TAB1, TRAF2, NEMO, the LUBAC component SHARPIN and RIPK1 to TNFR1 in Wt MEFs (Fig 1D). RIPK1 polyubiquitylation appeared 5 min after stimulation. In contrast, in cIAP1/2MutR MEFs, neither TAB1, NEMO nor SHARPIN were detectably associated with the TNFR1 signalling complex. RIPK1 and TRAF2 were still present at the receptor complex; however, no polyubiquitylation pattern was observed. Instead, in the cIAP1/2MutR MEFs, autophosphorylation of RIPK1 (S166) was detected 15 min after stimulation (Fig 1D) followed by caspase‐8 and downstream caspase‐3 cleavage at 3 h (Fig 1E). Additionally, MLKL phosphorylation was detected within 1 h of TNF stimulation, indicative of contemporaneous activation of necroptotic and apoptotic pathways in cIAP1/2MutR MEFs (Fig 1E). Delayed IκBα phosphorylation/degradation, JNK and p38 MAPK signalling were detected in cIAP1/2MutR compared with Wt MEFs (Fig EV2A), implying that cIAP1/2MutR cells fail to adequately induce TNF‐dependent NFκB and MAPK signalling. Instead, lack of ubiquitylation leads to RIPK1 autophosphorylation and activation of necroptotic and apoptotic signalling. Accordingly, cIAP1/2MutR MEFs were highly susceptible to different concentrations of TNF (Fig 1F). Caspase inhibition by IDN‐6556 (IDN) further facilitated TNF‐induced cytotoxicity as a sign of ongoing necroptosis (Fig 1G). Additional studies using birinapant to deplete cIAPs in Wt MEFs revealed similar results considering the activation of caspase‐8 and ‐3 (Fig EV2B). Phosphorylation of MLKL was, however, hardly detectable in Wt MEFs exposed to birinapant. Importantly, birinapant potentiated TNF‐induced cell death in Wt MEFs (after 6 h); however, the susceptibility to TNF was markedly lower than cIAP1/2MutR MEFs (Fig EV2C). When caspase activity was blocked, birinapant‐treated Wt MEFs were killed as efficiently as cIAP1/2MutR MEFs exposed to TNF. Birinapant could also increase TNF‐induced cell death in cIAP1/2MutR MEFs, presumably due to its inhibitory activity towards XIAP. The RIPK1 inhibitor necrostatin‐1S (Nec‐1S) efficiently inhibited TNF‐induced cell death (Fig EV2C), indicating that the loss of cIAP1/2 E3 ubiquitin ligase activity provokes susceptibility towards TNF‐induced cell death controlled by RIPK1 kinase activity.
Figure EV2. Loss of E3 ligase activity alters the TNF‐response in MEFs.
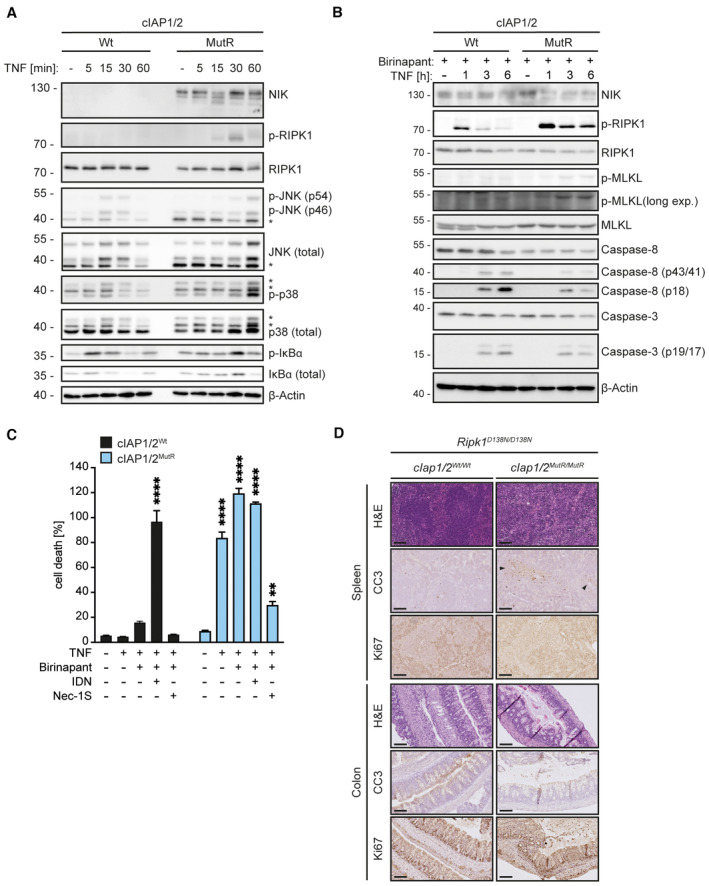
- MEFs were treated with TNF for the indicated times. Cell lysates were analysed by WB (*indicates non‐specific bands). WB of cIAP1Wt/Wt MEFs treated with TNF for the indicated time points.
- Cells were pre‐treated with 20 μM birinapant 3 h prior to TNF stimulation as indicated. Cell lysates were analysed by WB.
- IncuCyte analysis to determine % cell death in MEFs after 6‐h treatment as indicated. Bars represent mean ± SEM. P‐values were calculated using one‐way ANOVA followed by Bonferroni post analysis. **P < 0.01 and ****P < 0.0001. MEFs were treated with combinations of TNF (100 ng/ml), IDN (5 μM), Nec‐1S (20 μM) and birinapant (20 μM) for 6 h; n = 3; technical replicate shown.
- Representative images of spleen and colon sections from mice at 2 weeks of age. Black arrowheads indicate areas of apoptotic cells. Scale bars: 100 μm. Sections were stained with haematoxylin and eosin (H&E), cleaved caspase‐3 (CC3), or Ki67.
E3 ubiquitin ligase activity of cIAPs controls RIPK1 kinase activity‐induced embryonic lethality
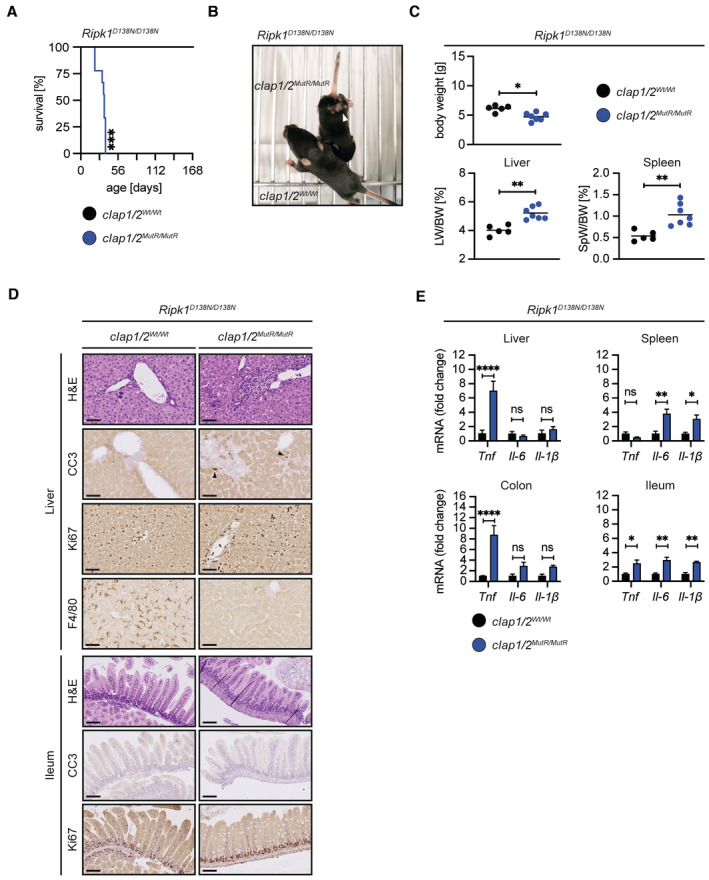
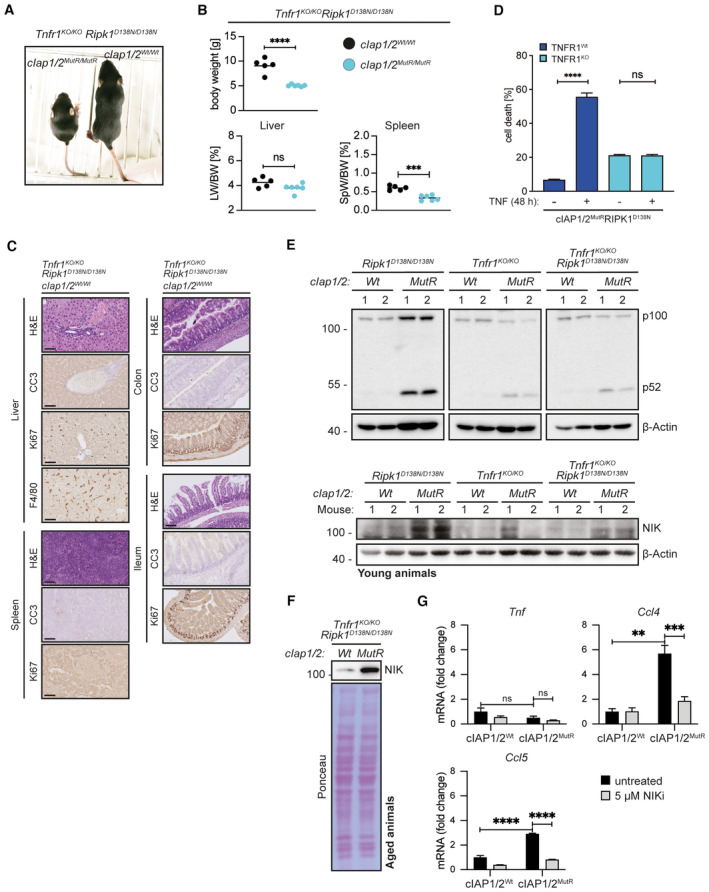
Based on our results obtained in cultured MEFs (Fig EV2C), RIPK1 kinase‐inactive mice (Ripk1 D138N/D138N ; Polykratis et al, 2014) were crossed into the cIap1 Wt/MutR /cIap2 Wt/MutR background. Ripk1 D138N/D138N /cIap1 MutR/MutR /cIap2 MutR/MutR mice survived embryonic development and were born at the expected Mendelian ratios (Fig EV1E). Yet, these mice had a significantly impaired median survival of only 35 days (Fig 2A). At birth, Ripk1 D138N/D138N /cIap1 MutR/MutR /cIap2 MutR/MutR mice were indistinguishable from control animals (Ripk1 D138N/D138N littermates); however, starting 7–10 days of postpartum, these mice appeared smaller. When analysed at 12–25 days of age, these mice were runted, developed skin lesions (Fig 2B) and had a significantly reduced body weight compared with Ripk1 D138N/D138N littermates (Fig 2C).
Figure 2. E3 ubiquitin ligase activity of cIAPs controls RIPK1 kinase activity‐induced embryonic lethality.
-
AKaplan–Meier survival curves of Ripk1 D138N/D138N /cIap1/2 Wt/Wt (n = 7) and Ripk1 D138N/D138N /cIap1 MutR/MutR /cIap2 MutR/MutR (n = 9) mice. P‐values were calculated with a log‐rank (Mantel–Cox) test.
-
BRepresentative pictures of Ripk1 D138N/D138N /cIap1/2 Wt/Wt and Ripk1 D138N/D138N /cIap1 MutR/MutR /cIap2 MutR/MutR mice at 2 weeks of age (white arrowhead indicates skin inflammation).
-
CBody weight, liver weight/body weight ratios (LW/BW), spleen weight/body weight ratios (SpW/BW) from age‐matched mice of the indicated genotypes.
-
DRepresentative images of liver (upper panel) and ileum (lower panel) sections from mice at 2 weeks of age. Black arrowheads indicate apoptotic cells. Scale bars: 50 μm. Sections were stained with haematoxylin and eosin (H&E), cleaved caspase‐3 (CC3), Ki67, or F4/80.
-
ERelative mRNA expression of the indicated genes from liver, spleen, colon, and ileum derived from Ripk1 D138N/D138N /cIap1/2 Wt/Wt (n = 3) and Ripk1 D138N/D138N /cIap1 MutR/MutR /cIap2 MutR/MutR (n = 4) mice at 2 weeks of age measured by qPCR.
Data information: Dots in (C) represent individual mice and lines the mean. In (E), bars represent mean ± SEM. P‐values were calculated by one‐way (C) or two‐way (E) ANOVA with Bonferroni's postanalysis. *P < 0.05; **P < 0.01; ***P < 0.001; ****P < 0.0001 and ns, not significant.
Source data are available online for this figure.
Livers from Ripk1 D138N/D138N /cIap1 MutR/MutR /cIap2 MutR/MutR mice were significantly enlarged (Fig 2C) and histological examination (H&E) of liver sections revealed an inflammatory environment indicated by immune cell infiltrates (Fig 2D) and upregulated Tnf mRNA levels (Fig 2E). No excessive apoptosis or compensatory proliferation was detected in these livers. Remarkably, Ripk1 D138N/D138N /cIap1 MutR/MutR /cIap2 MutR/MutR mice had a complete loss of liver resident Kupffer cells (Fig 2D). Similar to the livers, spleens from Ripk1 D138N/D138N /cIap1 MutR/MutR /cIap2 MutR/MutR mice were enlarged (Fig 2C). Furthermore, spleen architecture was altered, and focal areas showed increased apoptosis (Fig EV2D). Il6 and Il1b, but not Tnf, levels were strongly enhanced in spleens from Ripk1 D138N/D138N /cIap1 MutR/MutR /cIap2 MutR/MutR animals (Fig 2E) indicating that the inflammatory conditions in the spleen were distinct from those in the liver. In contrast to liver and spleen, intestines isolated from Ripk1 D138N/D138N /cIap1 MutR/MutR /cIap2 MutR/MutR mice at 12–25 days of age were histologically normal, and H&E sections revealed no obvious immune cell infiltration (Figs 2D and EV2D). However, mild increased expression of inflammatory cytokines including Tnf, Il6 and Il1b was detected in the ileum (Fig 2E). Furthermore, Tnf expression was increased in the colon of Ripk1 D138N/D138N /cIap1 MutR/MutR /cIap2 MutR/MutR mice compared with Ripk1 mutant mice (Fig 2E). These data indicated that RIPK1 kinase activity is the main driver of the embryonic lethality in cIap1 MutR/MutR /cIap2 MutR/MutR mice, whereas the postweaning multi‐organ inflammation and the mortality of Ripk1 D138N/D138N /cIap1 MutR/MutR /cIap2 MutR/MutR premature mice are mediated by RIPK1 kinase‐independent processes.
TNF induces apoptosis and necroptosis in cIAP1/2MutR /RIPK1D138N cells without involving RIPK1 kinase activity
Consistent with data using RIPK1 inhibitor Nec‐1S in cIAP1/2MutR MEFs (Fig EV2C), expression of enzymatically inactive RIPK1D138N efficiently blocked TNF‐induced cell death in cIAP1/2MutR/RIPK1D138N MEFs at early time points (up to 30 h post‐treatment) (Figs 3A and EV3A). At late time points (beyond 30 h post‐treatment), however, lack of RIPK1 kinase activity could not prevent TNF‐induced cell death in either cIAP1/2MutR/RIPK1D138N MEFs or cIAP1/2MutR MEFs cotreated with Nec‐1S (Fig 3A). Western blotting (WB) showed that the lack of RIPK1 kinase activity efficiently reduced/delayed, but did not completely diminish, caspase activation in cells expressing cIAP1/2MutR (Fig 3B).
Figure 3. TNF induces apoptosis and necroptosis in cIAP1/2MutR/RIPK1D138N cells without involving RIPK1 kinase activity.
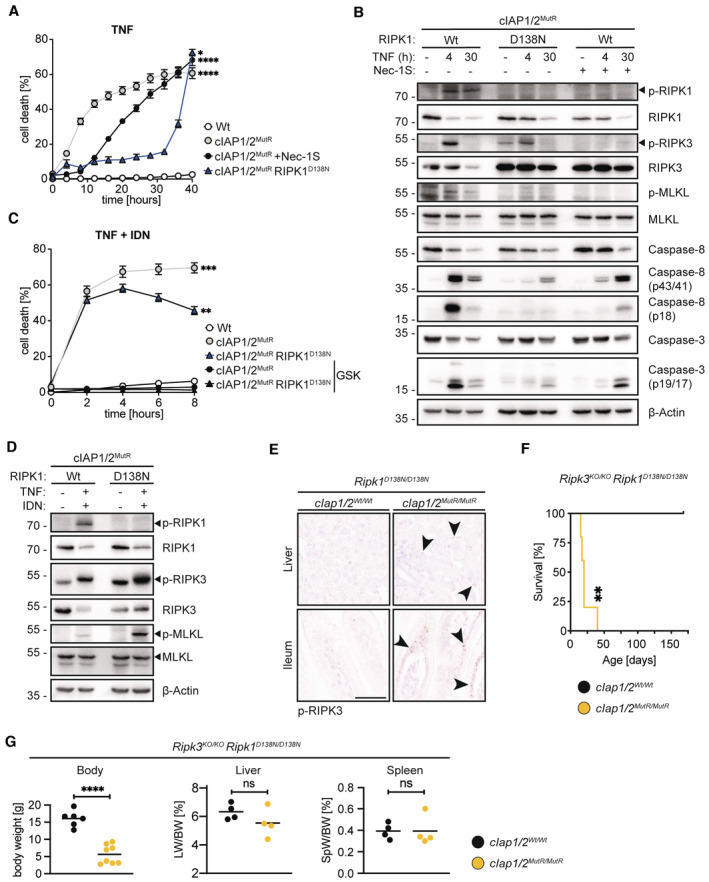
- IncuCyte analysis to determine % cell death in MEFs treated with TNF (100 ng/ml) and TNF + Nec‐1S (20 μM) at indicated time points.
- MEFs were treated with TNF (100 ng/ml) and Nec‐1S (20 μM) for the indicated times. Cell lysates were analysed by WB.
- IncuCyte analysis to determine % cell death of MEFs treated with TNF (100 ng/ml) and IDN‐6556 (IDN) (5 μM) and TNF, IDN and GSK‐872 (GSK) (5 μM), at indicated time points.
- MEFs were treated with TNF/IDN for 4 h. Cell lysates were analysed by WB.
- Representative images of liver and ileum sections from mice at 2 weeks of age. Black arrowheads indicate cells expressing phosphorylated RIPK3. Scale bars: 50 μm.
- Kaplan–Meier survival curves of Ripk3 KO/KO /Ripk1 D138N/D138N /cIAP1/2 Wt/Wt (n = 4) and Ripk3 KO/KO /Ripk1 D138N/D138N /cIap1 MutR/MutR /cIap2 MutR/MutR (n = 5) mice. P‐values were calculated with a log‐rank (Mantel–Cox) test.
- Body weight, liver weight/body weight ratios (LW/BW), spleen weight/body weight ratios (SpW/BW) from age‐matched mice of the indicated genotypes.
Data information: In (A) and (C), data is represented as mean of three technical replicates ± SEM. P‐values were calculated by repeated measures one‐way ANOVA with Bonferroni's post analysis. Dots in (G) represent individual mice and lines the means. P‐values calculated by unpaired Student's t‐test. *P < 0.05; **P < 0.01; ***P < 0.001; ****P < 0.0001 and ns, not significant.
Source data are available online for this figure.
Figure EV3. Role of cIAP1/2 E3 ligase activity in the apoptotic and necroptotic machinery independent of RIPK1 kinase activity.
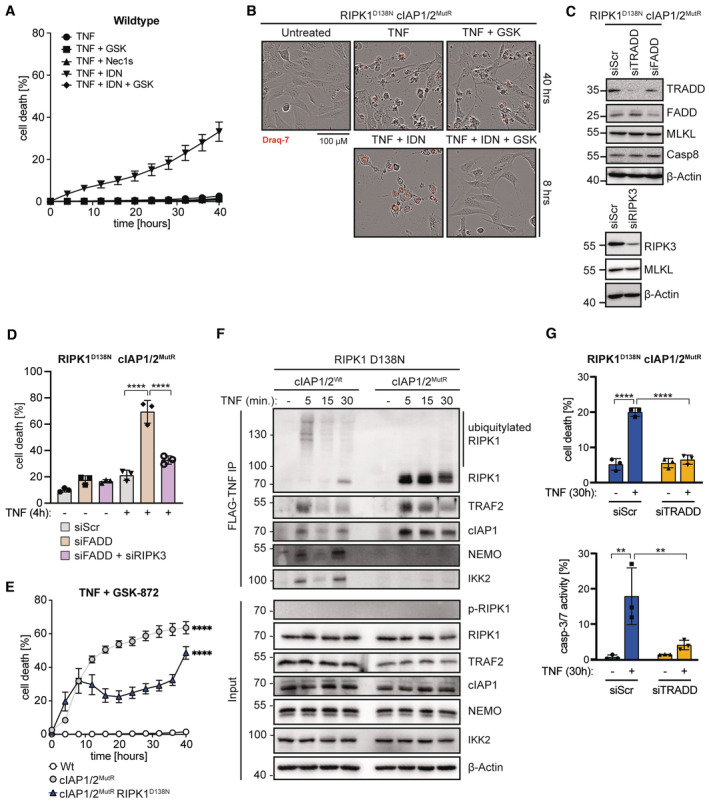
- IncuCyte analysis to determine % cell death in Wt MEFs treated with TNF (100 ng/ml), TNF + GSK (5 μM), TNF + Nec‐1S (20 μM), TNF + IDN (5 μM), or TNF + GSK + IDN at indicated time points.
- Cell lysates from MEFs transfected with the respective siRNA for 24 h were analysed by WB.
- IncuCyte analysis to determine % cell death in cIAP1/2MutR/RIPK1D138N MEFs transfected with the respective siRNA and treated with TNF (100 ng/ml) for 30 h.
- IncuCyte analysis to determine % cell death in MEFs treated with TNF (100 ng/ml) and GSK (5 μM) at indicated time points.
- MEFs were treated with FLAG‐TNF (1 μg/ml) for the indicated times. TNFR1 protein complex was purified and analysed by WB.
- IncuCyte analysis to determine % cell death in cIAP1/2MutR/RIPK1D138N MEFs transfected with the respective siRNA and treated with TNF (100 ng/ml) for 30 h. Caspase‐3/7 (Casp‐3/7) activity was measured by IncuCyte analysis. Fluorescence signal of CellEvent Casp‐3/7‐positive cells was quantified and normalised to cell number.
Data information: In (A) and (E), data are represented as mean ± SEM of three technical replicates. P‐values in (E) were calculated by repeated measures one‐way ANOVA with Bonferroni's postanalysis. Bars in (D) and (G) represent mean ± SEM of three technical replicates. P‐values were determined by one‐way ANOVA with Bonferroni's postanalysis. **P < 0.01; ***P < 0.001; ****P < 0.0001.
If the residual caspase activity is responsible for TNF‐induced late cell death of cIAP1/2MutR/RIPK1D138N MEFs, caspase inhibitor IDN should be able to diminish susceptibility of cells to TNF. Surprisingly, when caspase activity was blocked, TNF exposure caused massive cell death (Figs 3C and EV3A and B) suggesting an increased necroptotic propensity of cIAP1/2MutR/RIPK1D138N MEFs which was controlled by cIAPs but did not require RIPK1 kinase activity. WB analysis revealed a marked accumulation of phosphorylated RIPK3 in cIAP1/2MutR/RIPK1D138N MEFs, which was further increased upon TNF (Fig 3B) or TNF/IDN (Fig 3D) treatment and followed by MLKL phosphorylation. These data collectively indicated that the lack of E3 ubiquitin ligase activity of cIAP1/2 potentiates apoptosis and, if caspase activity is inhibited, necroptosis in response to TNF which is not dependent on RIPK1 kinase activity. RIPK1 kinase‐independent necroptosis (after TNF/IDN treatment) was efficiently blocked in cIAP1/2MutR/RIPK1D138N MEFs when RIPK3 kinase activity was inhibited by GSK‐872 (GSK) (Figs 3C and EV3A and B). Additional studies utilising specific knock‐down of FADD in cIAP1/2MutR/RIPK1D138N MEFs confirmed the data obtained by using IDN (Fig EV3C and D). FADD knock‐down increased the susceptibility of cIAP1/2MutR/RIPK1D138N to TNF (4‐h treatment). Combined knock‐down of FADD and RIPK3 in these cells efficiently diminished the susceptibility to TNF, further validating the data obtained by using IDN and GSK (Fig EV3C and D).
In agreement with our cell culture analyses, elevated phosphorylation of RIPK3 was also detected in the intestine and liver sections derived from Ripk1 D138N/D138N /cIap1 MutR/MutR /cIap2 MutR/MutR mice (Fig 3E). In order to address the role of RIPK3 and necroptosis, we established Ripk3 KO/KO /Ripk1 D138N/D138N /cIap1 MutR/MutR /cIap2 MutR/MutR mice. Lack of RIPK3 expression, however, did not ameliorate the observed phenotype. Ripk3 KO/KO /Ripk1 D138N/D138N /cIap1 MutR/MutR /cIap2 MutR/MutR mice were runted and died prematurely resembling similar phenotypic alterations seen in Ripk1 D138N/D138N /cIap1 MutR/MutR /cIap2 MutR/MutR mice (Fig 3F and G). These data indicated that necroptosis is not the driver of tissue inflammation and early lethality in Ripk1 D138N/D138N /cIap1 MutR/MutR /cIap2 MutR/MutR mice. Notably, whereas the exposure to both GSK‐872 and IDN could efficiently block TNF‐induced cytotoxicity (Fig 3C and EV3A and B), GSK‐872 treatment alone could not protect cIAP1/2MutR/RIPK1D138N MEFs against TNF (Fig EV3B and E). These observations suggest that the increased susceptibility to TNF which is independent of RIPK1 kinase activity and RIPK3 may cause the lethal inflammatory phenotype in Ripk1 D138N/D138N /cIap1 MutR/MutR /cIap2 MutR/MutR mice.
TNF binding to TNFR1 primarily triggers the formation of TNFR1‐associated signalling complex called complex I, involving the adaptor protein TNFR1‐associated death domain (TRADD; Hsu et al, 1995) and RIPK1 (Silke, 2011). TRADD and RIPK1 interact with TRAF2 and FADD (Hsu et al, 1996) and direct cIAP1/2‐mediated NF‐κB activation or caspase‐8‐mediated apoptosis, respectively. Previous genetic evidence demonstrated a pivotal interplay between TRADD and RIPK1 in controlling apoptosis (Ermolaeva et al, 2008; Anderton et al, 2019; Dowling et al, 2019). Our analysis of the TNFR1 multiprotein complex revealed the recruitment of TRAF2, NEMO, IKK2 and RIPK1 to TNFR1 in RIPK1D138N MEFs (Fig EV3F). RIPK1 polyubiquitylation appeared 5 min after stimulation. In contrast, in cIAP1/2MutR/RIPK1D138N MEFs, neither NEMO nor IKK2 were detectably associated with the TNFR1 signalling complex, indicating the lack of TNF‐induced NFκB signalling. RIPK1 and TRAF2 were still present at the receptor complex; however, no polyubiquitylation pattern was observed. In cIAP1/2MutR/RIPK1D138N MEFs, autophosphorylation of RIPK1 (S166) was not detectable (Fig EV3F). Thus, the lack of ubiquitin‐mediated NFκB/survival signalling and RIPK1‐mediated cell death in cIAP1/2MutR/RIPK1D138N MEFs may potentiate TRADD‐dependent apoptosis. Indeed, specific knock‐down of TRADD efficiently reduced TNF‐induced cytotoxicity and caspase activity in cIAP1/2MutR/RIPK1D138N MEFs (30‐h treatment; Fig EV3G).
Combined loss of TNFR1 and RIPK1 kinase activity prolongs the lifespan of cIap1 MutR /MutR /cIap2 MutR/MutR animals
To examine the role of TNFR1 in the lethality of cIAP1/2 MutR mice, we first established Tnfr1 KO/KO /cIap1 MutR/MutR /cIap2 MutR/MutR mice. Genetic ablation of the Tnfr1 gene in cIap1 MutR/MutR /cIap2 MutR/MutR mice restored the embryonic development (Fig EV1F) but only resulted in an extension of median survival to 25 days (Fig 4A) similar to Ripk1 D138N/D138N /cIap1 MutR/MutR /cIap2 MutR/MutR mice (Fig 2A). Tnfr1 KO/KO /cIap1 MutR/MutR /cIap2 MutR/MutR mice were runted, but in contrast to Ripk1 D138N/D138N /cIap1 MutR/MutR /cIap2 MutR/MutR mice, did not show obvious signs of skin lesions, hepatomegaly or splenomegaly (Fig EV4A and B). Yet, Tnfr1 KO/KO /cIap1 MutR/MutR /cIap2 MutR/MutR mice contained immune cell infiltrations surrounding the portal areas in the liver and a significant induction of Tnf and Il1b mRNA levels (Fig 4B–D). The appearance of liver macrophages (most likely Kupffer cells) in Tnfr1 KO/KO /cIap1 MutR/MutR /cIap2 MutR/MutR mice is in contrast to the complete loss of liver macrophages in the Ripk1 D138N/D138N /cIap1 MutR/MutR /cIap2 MutR/MutR mice (Fig 4D). Apoptotic areas in the spleen were still present in Tnfr1 KO/KO /cIap1 MutR/MutR /cIap2 MutR/MutR animals (Fig EV4C); however, spleen cytokine levels were not altered compared with control littermates (Fig EV4D). Histological examination of the intestine revealed increased apoptosis in colon and ileum, which was not obvious in intestinal sections derived from Ripk1 D138N/D138N /cIap1 MutR/MutR /cIap2 MutR/MutR mice (Figs 4B and D, and EV4C).
Figure 4. Combined loss of TNFR1 and RIPK1 kinase activity prolongs the lifespan of cIap1 MutR /MutR /cIap2 MutR/MutR animals.
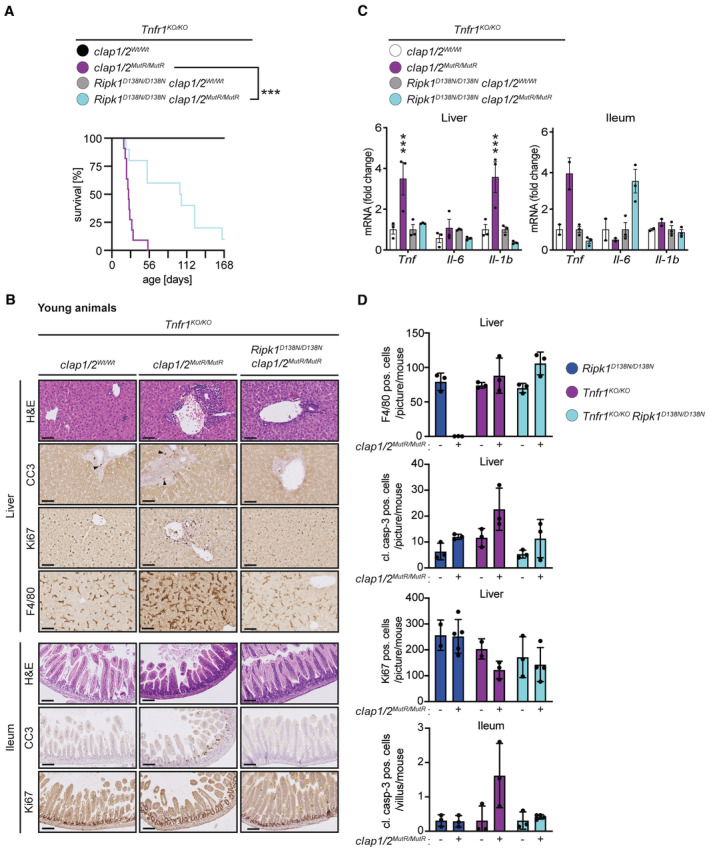
- Kaplan–Meier survival curves of Tnfr1 KO/KO /cIAP1/2 Wt/Wt (n = 7), Tnfr1 KO/KO /cIap1/2 MutR/MutR (n = 11), Tnfr1 KO/KO /Ripk1 D138N/D138N /cIAP1/2 Wt/Wt (n = 10) and Tnfr1 KO/KO /Ripk1 D138N/D138N /cIap1/2 MutR/MutR (n = 10) mice. P‐values were calculated with a log‐rank (Mantel‐Cox) test.
- Representative images of liver and ileum sections from mice at 2 weeks of age. Scale bars: 50 μm. Sections were stained with Hematoxylin and Eosin (H&E), cleaved caspase‐3 (CC3), Ki67, or F4/80. Arrowheads indicate CC3‐positive staining.
- Relative mRNA expression of the indicated genes from liver and ileum measured by qPCR. For ileal tissue samples 2 mice per genotype from Tnfr1 KO/KO /cIAP1/2 Wt/Wt and Tnfr1 KO/KO /cIap1/2 MutR/MutR and 3 mice per genotype from Tnfr1 KO/KO /Ripk1 D138N/D138N /cIAP1/2 Wt/Wt and Tnfr1 KO/KO /Ripk1 D138N/D138N /cIap1/2 MutR/MutR were measured.
- Quantification of cells positive for cleaved caspase‐3 (CC3), Ki67, or F4/80 staining in liver and ileum sections of mice.
Data information: In (C), bars represent mean ± SEM of three mice per genotype for liver samples. P‐values were calculated using two‐way ANOVA followed by Bonferroni postanalysis and significance is visualised in comparison with Tnfr1 KO/KO controls. In (D), each data point represents one mouse and bars indicate mean ± SD. ***P < 0.001.
Source data are available online for this figure.
Figure EV4. Additional loss of Ripk3 does not prolong the lifespan of Tnfr1 KO/KO cIap1 MutR /MutR /cIap2 MutR/MutR animals.
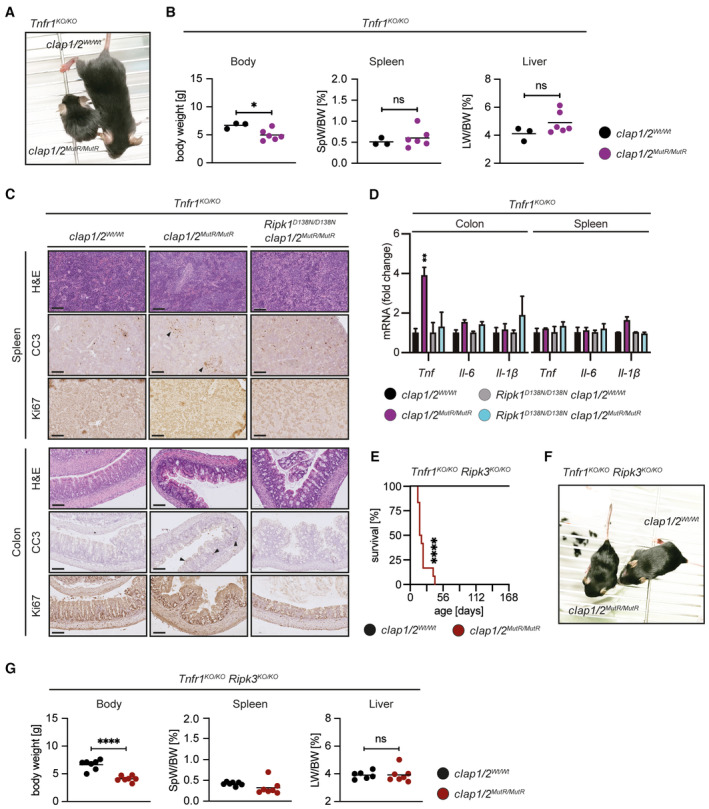
- Representative pictures of Tnfr1 KO/KO /cIAP1/2 Wt/Wt and Tnfr1 KO/KO /cIap1/2 MutR/MutR mice at 2 weeks of age.
- Body weight, liver weight/body weight ratios (LW/BW), spleen weight/body weight ratios (SpW/BW) from age‐matched mice of the indicated genotypes.
- Representative images of spleen and colon sections from mice at 2 weeks of age. Scale bars: 50 μm. Sections were stained with Hematoxylin and Eosin (H&E), cleaved caspase‐3 (CC3), or Ki67. Black arrowheads indicate areas of apoptotic cells.
- Relative mRNA expression of the indicated genes from colon and spleen measured by qPCR.
- Kaplan–Meier survival curves of Tnfr1 KO/KO /Ripk3 KO/KO /cIAP1/2 Wt/Wt (n = 8) and Tnfr1 KO/KO /Ripk3 KO/KO /cIap1/2 MutR/MutR (n = 12) mice. P‐values were calculated with a log‐rank (Mantel‐Cox) test.
- Representative pictures of Tnfr1 KO/KO /Ripk3 KO/KO /cIAP1/2 Wt/Wt and Tnfr1 KO/KO /Ripk3 KO/KO /cIap1/2 MutR/MutR mice at 2 weeks of age.
- Body weight, liver weight/body weight ratios (LW/BW), spleen weight/body weight ratios (SpW/BW) from age‐matched mice of the indicated genotypes.
Data information: In (B) and (G), dots represent individual mice and lines the means. P‐values calculated by one‐way ANOVA with Bonferroni's postanalysis. In (D), bars represent mean of three mice per genotype ± SEM. P‐values were calculated using two‐way ANOVA followed by Bonferroni postanalysis and significance is visualised in comparison with Tnfr1 KO/KO controls. *P < 0.05; **P < 0.01; ***P < 0.001; ****P < 0.0001 and ns, not significant.
Similar to Ripk1 D138N/D138N /cIap1 MutR/MutR /cIap2 MutR/MutR mice, additional ablation of Ripk3 did not provide any phenotypical advantages in Tnfr1 KO/KO /cIap1 MutR/MutR /cIap2 MutR/MutR mice (Fig EV4E–G). Taken together, both Ripk1 D138N/D138N /cIap1 MutR/MutR /cIap2 MutR/MutR and Tnfr1 KO/KO /cIap1 MutR/MutR /cIap2 MutR/MutR mouse lines shared some phenotypic features and died prematurely by multi‐organ inflammation without involving necroptosis. However, they differed in histology and inflammatory responses indicating that cIAPs control nonoverlapping signalling processes downstream of RIPK1 and TNFR1.
The role of RIPK1‐independent TNF‐induced cytotoxicity in cIap1 MutR/MutR /cIap2 MutR/MutR mice was investigated by combined ablation of TNFR1 expression and RIPK1 kinase activity. Consistent with the two individual mutant mouse lines, Tnfr1 KO/KO /Ripk1 D138N/D138N /cIap1 MutR/MutR /cIap2 MutR/MutR mice survived embryogenesis, were viable and born at the expected Mendelian ratios (Fig EV1G). Lack of both TNFR1 and RIPK1 kinase activity significantly increased the survival rate of cIap1 MutR/MutR /cIap2 MutR/MutR mice with a median survival of 100 days (Fig 4A). However, Tnfr1 KO/KO /Ripk1 D138N/D138N /cIap1 MutR/MutR /cIap2 MutR/MutR mice were still runted (Fig EV5A and B). Histological analysis in liver, spleen and intestinal sections derived from Tnfr1 KO/KO /Ripk1 D138N/D138N /cIap1 MutR/MutR /cIap2 MutR/MutR mice at 12–25 days of age showed no obvious alterations (Figs 4B and EV5C). The increased apoptosis seen in the intestinal sections of Tnfr1 KO/KO /cIap1 MutR/MutR /cIap2 MutR/MutR mice was absent upon inactivation of RIPK1 (Fig 4B and D). Likewise, the loss of macrophages in the livers of Ripk1 D138N/D138N /cIap1 MutR/MutR /cIap2 MutR/MutR mice (Fig 2D) was prevented by additional ablation of Tnfr1 (Fig 4B and D). In line with these histological data, there was no pronounced upregulation of proinflammatory cytokines (Figs 4C and EV4D) collectively indicating that the early onset of the systemic inflammation and premature mortality are independently mediated by TNFR1 and RIPK1 kinase activity. Yet, Tnfr1 KO/KO /Ripk1 D138N/D138N /cIap1 MutR/MutR /cIap2 MutR/MutR mice were runty and had a short lifespan.
Figure EV5. Loss of cIAP E3 ligase activity leads to NIK accumulation and activation of non‐canonical NFκB signalling in vivo .
- Representative pictures of Tnfr1 KO/KO /Ripk1 D138N/D138N /cIAP1/2 Wt/Wt and Tnfr1 KO/KO /Ripk1 D138N/D138N /cIap1/2 MutR/MutR mice at 2 weeks of age.
- Body weight, liver weight/body weight ratios (LW/BW), spleen weight/body weight ratios (SpW/BW) from age‐matched mice of the indicated genotypes.
- Representative images of liver, spleen, colon and ileum sections from Tnfr1 KO/KO /Ripk1 D138N/D138N /cIAP1/2 Wt/Wt mice at 2 weeks of age. Scale bars: 50 μm. Sections were stained with Hematoxylin and Eosin (H&E), cleaved caspase‐3 (CC3), Ki67, or F4/80.
- IncuCyte analysis to determine cell death in MEFs after 48 h of TNF treatment (100 ng/ml).
- WB of liver lysates from young mice with the indicated genotypes (2 mice per genotype).
- WB of liver lysates from aged mice with the indicated genotypes (1 mouse per genotype).
- Gene expression analysis of MEFs treated with NIK inhibitor (5 μM) for 24 h, relative mRNA expression of indicated genes was measured by qPCR.
Data information: In (B), dots represent individual mice and lines the means. In (D) and (G), bars represent mean ± SEM of three technical replicates. P‐values were calculated using one‐way (B and D) or two‐way (G) ANOVA followed by Bonferroni postanalysis. *P < 0.05; **P < 0.01; ***P < 0.001; ****P < 0.0001 and ns, not significant.
Although no signs of early systemic inflammation were observed, Tnfr1 KO/KO /Ripk1 D138N/D138N /cIap1 MutR/MutR /cIap2 MutR/MutR mice succumbed to a late‐stage (beyond 100 days) inflammatory phenotype observed predominantly in the liver and ileum (Fig 5A). Liver and ileal tissues taken from aged Tnfr1 KO/KO /Ripk1 D138N/D138N /cIap1 MutR/MutR /cIap2 MutR/MutR mice displayed signs of increased inflammation such as periportal immune infiltrates (Fig 5A). Massive immune cell infiltration was also detected in ileal sections of aged Tnfr1 KO/KO /Ripk1 D138N/D138N /cIap1 MutR/MutR /cIap2 MutR/MutR mice. In line with these findings, mRNA analysis showed an upregulation of Tnf, Il1b and Ccl5 in liver and/or ileal tissues (Fig 5B). Histological investigation did not indicate any increased cell death in these tissues. Similarly, MEFs derived from Tnfr1 KO/KO /Ripk1 D138N/D138N /cIap1 MutR/MutR /cIap2 MutR/MutR mice were resistant to TNF‐induced cell death (Fig EV5D).
Figure 5. Hyperinflammatory phenotype in the aged Tnfr1 KO/KO /Ripk1 D138N/D138N /cIap1/2 MutR/MutR mice.
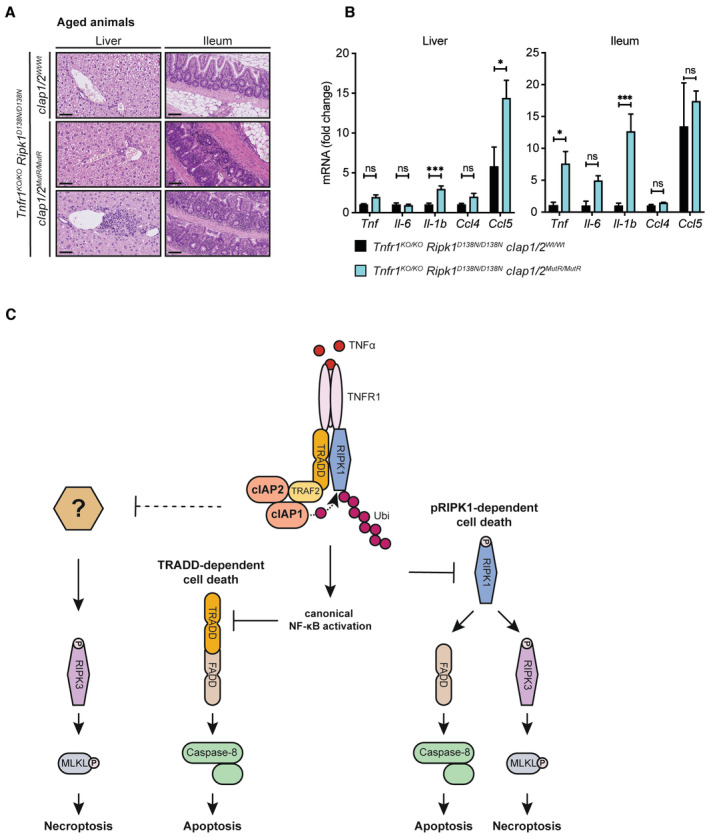
- Representative images of liver and ileum sections from mice with the indicated genotypes at 24 weeks of age. Scale bars: 50 μm (liver) and 100 μm (ileum).
- Relative mRNA expression of the indicated genes from liver and ileum isolated from mice measured by qPCR. Bars represent mean of three mice per genotype ± SEM. P‐values were calculated using two‐way ANOVA followed by Bonferroni postanalysis. *P < 0.05; ***P < 0.001 and ns, not significant.
- Schematic illustration of cIAP‐mediated control of TNFR1‐induced cell death. The ubiquitin ligase activity of cIAP1/2 controls TNF‐induced RIPK1‐mediated apoptosis/necroptosis and provides the molecular platform for the activation of NFκB in response to TNF. Activation of NFκB survival signalling inhibits TNF‐induced TRADD‐mediated apoptosis. cIAP‐mediated ubiquitylation further controls TNF‐induced RIPK3‐dependent and RIPK1‐independent necroptosis. The underlying molecular mechanism remains undetermined.
Source data are available online for this figure.
NFκB‐inducing kinase represents one important target of cIAP1/2 E3 ubiquitin ligase activity, which accumulated in cells expressing cIAP1/2MutR (Fig 1C). Analysis of noncanonical NFκB activation revealed the processing of p100 (NFκB2) to p52 and accumulation of NIK in tissues derived from young and aged mice expressing cIAP1/2MutR (Fig EV5E and F), which could not be completely blocked by ablation of TNFR1 and/or RIPK1 kinase activity. NIK inhibitor (Brightbill et al, 2018; Zhang et al, 2019a) diminished the expression of Ccl4 and Ccl5, but not Tnf, in cIAP1/2MutR MEFs (Fig EV5G) suggesting that NIK may partially contribute to the observed inflammatory phenotype. Its role in the hyperinflammatory phenotype observed in the aged Tnfr1 KO/KO /Ripk1 D138N/D138N /cIap1 MutR/MutR /cIap2 MutR/MutR mice remained unanswered.
Discussion
Previous studies exploring the physiologic role of cIAPs either by utilising chemical inhibitors of IAPs in vivo or by establishing gene knock‐out mouse models indicated that cIAPs are important regulators of the TNF signalling machinery (Conze et al, 2005; Conte et al, 2006; Moulin et al, 2012; Zhang et al, 2019a). cIAP1 and cIAP2 act together with TRAFs and LUBAC to ubiquitylate RIPK1 and activate canonical p65/RelA NFκB in response to TNF. RIPK1 ubiquitylation is also required to block its autophosphorylation and subsequent activation of caspase‐8‐dependent apoptosis as well as RIPK3/MLKL‐dependent necroptosis (Varfolomeev & Vucic, 2022). In general, genetic mouse models have shown that the ablation of cIap1/2 genes caused severe phenotypes and embryonic lethality that are, however, ameliorated only partially when major drivers of TNF‐induced cytotoxicity such as caspase‐8, RIPK3, MLKL or TNFR1 were genetically deleted in mice (Moulin et al, 2012; Zhang et al, 2019a). By establishing cIap1 MutR/MutR /cIap2 MutR/MutR mice specifically lacking cIAP1/2 functional RING domains, we could show that the lack of E3 ubiquitin ligase activity of cIAPs causes embryonic lethality. This embryonic lethality could be rescued to postweaning by solely inactivating RIPK1 kinase activity, and therefore indicate that RIPK1 and particularly its kinase activity is an important target of cIAP1/2's E3 ligase activity. This extends earlier work showing that Ripk1 gene ablation prolonged the embryonic survival of cIap1 −/− /cIap2 −/− mice from E10 to E12.5 (Moulin et al, 2012). It is important to note that our studies involving cell death assays, and protein expression/interaction, ubiquitylation, and phosphorylation conclusively validated the lack of E3 ubiquitin ligase activity of cIAP1/2MutR. These data, however, cannot formally exclude that the introduced mutations in the RING domain of cIAP1/2 may have additional impact on protein function beyond its E3 ubiquitin ligase activity.
RIPK1 kinase activity and its autophosphorylation are crucial for the formation of RIPK1‐containing protein complexes inducing either caspase‐8‐mediated apoptosis or RIPK3‐mediated necroptosis, which have been considered as the major targets of cIAPs (Varfolomeev & Vucic, 2022). Our data, however, showed that in cIAP1/2MutR/RIPK1D138N cells, RIPK1 kinase activity is not required for TNF‐induced apoptosis and necroptosis. On the contrary, the marked necroptotic propensity of cIAP1/2MutR/RIPK1D138N cells was reliant on RIPK3 kinase activity and was associated with elevated levels of phosphorylated RIPK3 in cultured cells and mouse tissues. Nevertheless, the inflammatory tissue damage seen in both Ripk1 D138N/D138N /cIap1 MutR/MutR /cIap2 MutR/MutR and Tnfr1 KO/KO /cIap1 MutR/MutR /cIap2 MutR/MutR mice could not be ameliorated by ablation of the Ripk3 gene, demonstrating that necroptosis is extremely unlikely to contribute to the observed inflammatory phenotype. Notably, recent studies have shown that mutating the ubiquitylation site K376 of RIPK1 (K376R) causes embryonic lethality (Tang et al, 2019; Zhang et al, 2019b; Kist et al, 2021), closely resembling the phenotypic alterations observed in our cIap1 MutR/MutR /cIap2 MutR/MutR mice. The observed embryonic lethality was effectively prevented by treatment of RIPK1 kinase inhibitor and was rescued by deletion of the Tnfr1 gene. Similar to the Tnfr1 KO/KO /cIap1 MutR/MutR /cIap2 MutR/MutR mice in our studies, Tnfr1 KO/KO /Ripk1 K376R/K376R mice displayed systemic inflammation and died within 2 weeks (Tang et al, 2019; Zhang et al, 2019b; Kist et al, 2021), together underscoring cIAP1/2 as the key regulatory E3 ubiquitin ligases targeting K376 of RIPK1. In contrast to Tnfr1 KO/KO /cIap1 MutR/MutR /cIap2 MutR/MutR mice in our study, however, additional deletion of Ripk3 could block inflammatory tissue damage and lethality of Tnfr1 KO/KO /Ripk1 K376R/K376R mice (Zhang et al, 2019b). Our observations clearly indicated that cIAP1/2 not only control TNFR1‐mediated RIPK1‐dependent cytotoxicity and, thus, the lack of cIAP1/2 E3 ubiquitin ligase activity engages RIPK1‐dependent and ‐independent cell death/inflammatory processes ultimately leading to tissue damage (Fig 5C). These observations are consistent with previous studies using various cellular settings and showing that TNF‐induced apoptotic and necroptotic cell death pathways can be RIPK1 independent (Wong et al, 2010; Vanlangenakker et al, 2011; Moujalled et al, 2013). TRADD is a key adaptor protein for TNFR1, which can induce both NFκB and apoptosis in response to TNF (Hsu et al, 1995, 1996). Inhibition of NFκB potentiates TRADD‐mediated apoptosis (Micheau & Tschopp, 2003). Furthermore, previous genetic evidence suggested that RIPK1 limits TRADD‐induced apoptosis (Anderton et al, 2019). Thus, the lack of RIPK1 kinase activity and NFκB activation together can provoke TNF‐induced apoptosis by involving TRADD. Accordingly, the transient knock‐down of TRADD in cIAP1/2MutR/RIPK1D138N cells reduced TNF‐induced cell death (Fig EV3G). However, physiologic relevance of these findings and the role of TRADD in the inflammatory phenotype seen in Ripk1 D138N/D138N /cIap1 MutR/MutR /cIap2 MutR/MutR mice remained unanswered.
The fact that cells or tissues derived from Tnfr1 KO/KO /Ripk1 D138N/D138N /cIap1 MutR/MutR /cIap2 MutR/MutR mice did not show any signs of cell death raises the possibility that the aberrant activation of the noncanonical NFκB pathway may cause systemic inflammation and mortality. This is in line with previous studies characterising cIap2 H570A/H570A mice (Conze et al, 2010). Site‐directed mutagenesis of the Zn2+−coordinating histidine residue in the RING domain of cIAP1 (H582A) or cIAP2 (H570A) do not lead to severe phenotypic alteration in mice and both cIap1 H582A/H582A and cIap2 H570A/H570A mice are viable and fertile (Conze et al, 2010; Giardino Torchia et al, 2013). cIap2 H570A/H570A mice, however, accumulated abnormal B cells with gut‐associated lymphoid hyperplasia (after 6–7 months of age) as a consequence of an elevated noncanonical NFκB signalling, indicating that cIAP2 E3 ubiquitin ligase activity is required to block NIK in lymphoid organs (Conze et al, 2010). Furthermore, keratinocyte‐specific loss of TRAF2 causes psoriasis‐like skin inflammation which can be prevented only by combined ablation of TNF and noncanonical NFκB signalling (Etemadi et al, 2015), further underscoring the eminent role of noncanonical NFκB activation in inflammatory phenotypes induced by alteration of TRAF2 and cIAPs. Interrogating the adverse effects of the noncanonical pathway on Tnfr1 KO/KO /Ripk1 D138N/D138N /cIap1 MutR/MutR /cIap2 MutR/MutR mouse survival requires additional genetic approaches.
The mouse model established in this study represents a suitable model to further investigate the important regulatory functions of cIAP1/2 and can provide new insights in TNF signalling and its impact on human diseases. Given the therapeutic value of cIAPs and RIPK1 in multiple clinical trials (Kashkar, 2010; Morrish et al, 2020; Newton, 2020), mechanistic understanding of how E3 ubiquitin ligases cIAP1/2 control RIPK1 and other signalling moieties may help to identify specific human diseases that would benefit from such targeting strategies.
Materials and Methods
Experimental model and subject details
Mice
TNFR1 KO/KO (Van Hauwermeiren et al, 2013), Ripk1 D138N/D138N (Polykratis et al, 2014) and Ripk3 KO/KO (Newton et al, 2016) mice were described in previous studies. Homozygous cIAP1 KO/KO cIAP2 KO/KO mice have been described previously (Moulin et al, 2012). All mice were housed at the CECAD animal facility (University of Cologne, Germany) under SPF (standard pathogen‐free) conditions with a 12‐h light/dark cycle. Water and food were provided ad libitum. Mouse studies were performed after approval by the local authorities (LANUV, NRW, Germany) and in accordance with the German animal protection laws (Ref. number: AZ84.02.04.2015.A471, AZ84.02.04.2019.A145, AZ84.02.04.2021.A123). Study‐specific calculations regarding group size, randomisation and study blinding were not performed. Mice were grouped according to their genotypes in groups of mixed sexes.
Generation of cIap1/2 MutR /MutR mice
cIap1 MutR/MutR /cIap2 MutR/MutR mice were generated by simultaneous pronuclear injections (PNI) of C57BL/6N zygotes (Fritsch et al, 2019) with two single‐guide RNAs (sgRNAs) targeting Birc2 (cIap1) and Birc3 (cIap2). Gene‐specific sgRNAs (Birc2: 5′‐TCTGCAGGGGGACAATCAAG‐3′; Birc3: 5′‐ATCTGTAGAGGGACCATCAA‐3′) were generated via in vitro transcription (IVT). An injection solution was prepared containing both sgRNAs (each at 10 ng/μl), two single template DNA strands (Birc2: 5′‐CCCCTTCTCTAAGGAAGTGCCCCATCTGCAGGGGGACAATTAAAGGAACTGTGCGCACAGCGCTCTCATGAGTGAAGAATGGTCTGAAAGTATTGTTGGACATCAGAAGCTGTCAGAACA‐3′; Birc3: 5′‐TCCCTCTCTGAGGAAGTGTCCCATCTGTAGA G GGACCATTAAAGGCACAGTGCGCACAGCGCTCTCCTGAACAAGACTAATGGTCCATGGCTGCAACTTCAGCCAGGAGGAAGTTCACTG‐3′) (25 ng/μl), and 30 ng/μl Cas9 mRNA (TriLink Biotechnologies). Pronuclear injections (PNI) were performed at the CECAD in vivo Research Facility (University of Cologne, Germany). One founder animal, carrying short deletions in both genes, was backcrossed for three generations into the C57BL/6N background to eliminate possible off‐target effects.
MEF cell culture
Mouse embryonic fibroblasts (MEFs) were generated from embryos of indicated genotypes harvested at E10.5 (Andree et al, 2014) and cultured in Dulbecco's Modified Eagle Medium (DMEM) (Bio&Sell) supplemented with 10% heat‐inactivated fetal bovine serum (Biowest), 2 mM L‐glutamine (Biochrom), 10 mM HEPES (pH 7.2) (Fisher BioReagents), 1× nonessential amino acids (Merck), 100 U ml−1 penicillin and 100 μg ml−1 streptomycin (Bio&Sell). Mouse embryonic fibroblasts were immortalised using simian virus 40 (SV40) transformation. Afterwards, cells were expanded for several passages before being used in following experiments.
Method details
Embryology and immunofluorescence
For timed breeding, cIap1 Wt/MutR /cIap2 wt/MutR heterozygous animals were paired. Females were screened daily for vaginal plugs and a positive plug determined embryonic day (E) 0.5. Further, a gain in weight by > 2 g after 10 days was used as an additional marker for a potential pregnancy. Embryos were isolated at E10.5. Pictures were taken using a M80 stereomicroscope (Leica) equipped with a IC80 HD microscope camera (Leica). Yolk sacs were collected, washed in phosphate‐buffered saline (PBS) and fixed with 3% PFA (paraformaldehyde). Afterwards, yolk sacs were incubated with anti‐cleaved Caspase‐3 (Rabbit; #9661; Cell Signaling) and anti‐CD31 (Armenian hamster; #ab119341; abcam) (overnight) before adding the secondary antibodies, anti‐Rabbit IgG Alexa Fluor 594 (Goat; #A11012; Life Technologies) and anti‐Armenian hamster IgG FITC (Goat; #ab5739; abcam) for 1 h at room temperature (Schiffmann et al, 2020). Pictures were taken using a motorised inverted Olympus IX81 microscope (CellR Imaging Software). Adobe Photoshop (version 22.1.0) was used for editing.
Immunoprecipitation (IP)
Cells were exposed to 1 μg/ml recombinant FLAG tagged mouse TNF‐α (#ALX‐522‐009; Enzo), rinsed with ice‐cold PBS and placed on ice to stop the stimulation. PBS was removed and 150 μl DISC lysis buffer (30 mM Tris–Hcl, pH 7.5, 150 mM NaCl, 10% glycerol, 1% Triton X‐100, 2 mM EDTA, supplemented with 1× PhosSTOP (Roche), 1× cOmplete™ protease inhibitor (Roche) and 0.5 mg/ml NEM (Sigma‐Aldrich)) was added directly onto the plates. Cells were scraped off, collected in 1.5‐ml tubes and placed on ice for 20 min. The cell suspension was centrifuged for 20 min at 20,000 g at 4°C to remove cell debris. The cleared lysates were transferred to fresh 1.5‐ml tubes. A fraction of each sample was collected separately and served as input control. The remaining lysate fractions were processed according to the manufacturer's protocol using the μMACS™ DYKDDDDK Isolation Kit (Miltenyi Biotec) (washing with the Wash Buffer 1 was reduced to 1 × 200 μl). All antibodies used are summarised in Appendix Table S1.
Cell death measurements
Cells (0.75 or 1 × 10⁴) were seeded onto 96‐well plates coated with 1% gelatin in MEF culture medium. The next day, cells were washed once with PBS before adding 100 μl medium containing indicated stimuli and 0.15 μM DRAQ7™ (biostatus). Cells were pretreated with DMSO (Carl Roth) as control treatment or 20 μM Birinapant (Biozol) 3 h prior and throughout stimulation to induce efficient cIAP1/2 depletion. In siRNA knock‐down experiments, 104 cells were seeded on 96‐well plates and transfected with the respective siRNA for 24 h using Lipofectamine® RNAi MAX™ (Invitrogen) according to the manufacturer's instructions (Daoud et al, 2022), before adding TNF and 0.15 μM DRAQ7™ (biostatus) or 1 μM cellEvent™ Caspase‐3/7 (Invitrogen). The following siRNAs were used: siTRADD (5’‐GGUUCGAAGUUCCCGGUUU‐3′), siRIPK3 (5′‐AAGAUUAACCAUAGCCUUCACCUCCCA‐3′) (Kearney et al, 2014). siRNAs were designed and/or purchased from Eurofins Genomics. siFADD was from ThermoFisher #AM16704. Prepared 96‐well plates were placed into the IncuCyte® Live‐Cell Analysis System (Sartorius), where cell death was measured for up to 48 h. Percent cell death was calculated mainly by normalisation to the number of seeded cells or number of total cells at the final time point, measured through lysis of each well with 200 μg/ml digitonin (Sigma Aldrich).
Quantitative real‐time PCR (qPCR)
qPCR analysis was performed on cDNA generated from MEFs or frozen tissues samples, using gene specific primers and the LightCycler® 480 SYBR® Green I Mix (Roche). qPCRs were run on the CFX96™ Real‐Time System (Bio‐Rad). Actb was used as housekeeping gene and data were further analysed as previously described using the LingRegPCR program (Ramakers et al, 2003).
Immunohistochemistry (IHC)
Liver, spleen and intestinal tissue were fixed in ROTI® Histofix 4% (Carl Roth), embedded in paraffin and cut in 5 μm sections. After deparaffinisation and endogenous peroxidase blocking (40 mM sodium citrate, 12.1 mM Na2HPO4, 30 mM NaN3, 3% H2O2) for 15 min at room temperature, samples were further treated by either heat‐induced antigen retrieval (10 mM sodium citrate, 0.05% Tween‐20, pH 6.0), or proteinase K digest (Qiagen) (in 50 mM Tris, pH 8.0, 1 mM EDTA, 0.5% Triton‐100). In between two washing steps with PBS + 0.05% Tween‐20, sections were blocked for 1 h at room temperature in a wet chamber using the Avidin/Biotin Blocking Kit (Vector Laboratories). Samples were incubated over night at 4°C in the appropriate primary antibodies (Appendix Table S1). The next day, sections were incubated with the corresponding biotinylated secondary antibodies (Appendix Table S2). Finally, the ABC HRP Kit Vectastain Elite (Vector Laboratories) and the DAB staining Kit (Dako) were used for visualisation and counterstained with Hematoxylin (Carl Roth) (Fritsch et al, 2019).
Stained sections were scanned with an SCN4000 Slide Scanner (Leica) and an NanoZoomer S360 Digital slide scanner (Hamamatsu) and analysed with the imaging software Aperio ImageScope v.12.2.2.5015 (Leia). Pictures present in this work are representative for at least three mice per genotype. For quantification of liver sections, F4/80, cleaved caspase‐3, and Ki67‐positive cells were counted in frames of identical size (16.3 × 10.2 cm; F4/80: mean of four frames at 40× magnification, cleaved caspase‐3: one frame at 10× magnification, Ki67: one frame at 20× magnification). Cleaved caspase‐3 positive cells in the ileum were quantified as previously described (Fritsch et al, 2019). 15 villi per mouse were analysed for the quantification.
Quantification and statistical analysis
Microsoft® Excel for Mac (version 16.52; Microsoft) and GraphPad Prism for macOS (version 8.4.3; GraphPad Software, LLC.) were used for statistical analysis. Data are displayed as mean ± SEM. * indicates P < 0.05, ** indicates P < 0.01, *** indicates P < 0.001, **** indicates P < 0.0001. Sample sizes and used analyses are listed in the corresponding figure legends. All western blots and cell death assays shown are representative of at least three independent experiments conducted in the laboratory.
Author contributions
Fabian Schorn: Conceptualization; data curation; formal analysis; validation; investigation; visualization; methodology; writing – original draft. J Paul Werthenbach: Data curation; investigation; visualization; methodology; writing – original draft; writing – review and editing. Mattes Hoffmann: Formal analysis; investigation; methodology. Mila Daoud: Data curation; formal analysis; investigation; visualization; methodology. Johanna Stachelscheid: Formal analysis; investigation; visualization; methodology; writing – review and editing. Lars M Schiffmann: Investigation; methodology; writing – original draft; writing – review and editing. Ximena Hildebrandt: Investigation. Su Ir Lyu: Investigation. Nieves Peltzer: Resources. Alexander Quaas: Formal analysis; methodology. Domagoj Vucic: Resources. John Silke: Resources; writing – review and editing. Manolis Pasparakis: Resources. Hamid Kashkar: Conceptualization; resources; supervision; funding acquisition; methodology; writing – original draft; project administration; writing – review and editing.
Disclosure and competing interests statement
The authors declare that they have no conflict of interest.
Supporting information
Appendix S1
Expanded View Figures PDF
PDF+
Source Data for Figure 1
Source Data for Figure 2
Source Data for Figure 3
Source Data for Figure 4
Source Data for Figure 5
Acknowledgements
We thank M. Menning, A. Manav and T. Roth for their technical assistance. This work was supported by the German Cancer Aid (70114685 and 70114225), SFB1403 (project number 414786233), SFB1530 (project number 455784452) and SFB1218 (project number 269925409). We thank the CECAD animal facility (University of Cologne, Germany) for support with the animal work included in this study. Open Access funding enabled and organized by Projekt DEAL.
The EMBO Journal (2023) 42: e113614
Data availability
This study includes no data deposited in external repositories.
References
- Anderton H, Bandala‐Sanchez E, Simpson DS, Rickard JA, Ng AP, Di Rago L, Hall C, Vince JE, Silke J, Liccardi G et al (2019) RIPK1 prevents TRADD‐driven, but TNFR1 independent, apoptosis during development. Cell Death Differ 26: 877–889 [DOI] [PMC free article] [PubMed] [Google Scholar]
- Andree M, Seeger JM, Schull S, Coutelle O, Wagner‐Stippich D, Wiegmann K, Wunderlich CM, Brinkmann K, Broxtermann P, Witt A et al (2014) BID‐dependent release of mitochondrial SMAC dampens XIAP‐mediated immunity against Shigella. EMBO J 33: 2171–2187 [DOI] [PMC free article] [PubMed] [Google Scholar]
- Annibaldi A, Wicky John S, Vanden Berghe T, Swatek KN, Ruan J, Liccardi G, Bianchi K, Elliott PR, Choi SM, Van Coillie S et al (2018) Ubiquitin‐mediated regulation of RIPK1 kinase activity independent of IKK and MK2. Mol Cell 69: 566–580.e5 [DOI] [PMC free article] [PubMed] [Google Scholar]
- Bertrand MJ, Milutinovic S, Dickson KM, Ho WC, Boudreault A, Durkin J, Gillard JW, Jaquith JB, Morris SJ, Barker PA (2008) cIAP1 and cIAP2 facilitate cancer cell survival by functioning as E3 ligases that promote RIP1 ubiquitination. Mol Cell 30: 689–700 [DOI] [PubMed] [Google Scholar]
- Brightbill HD, Suto E, Blaquiere N, Ramamoorthi N, Sujatha‐Bhaskar S, Gogol EB, Castanedo GM, Jackson BT, Kwon YC, Haller S et al (2018) NF‐kappaB inducing kinase is a therapeutic target for systemic lupus erythematosus. Nat Commun 9: 179 [DOI] [PMC free article] [PubMed] [Google Scholar]
- Conte D, Holcik M, Lefebvre CA, Lacasse E, Picketts DJ, Wright KE, Korneluk RG (2006) Inhibitor of apoptosis protein cIAP2 is essential for lipopolysaccharide‐induced macrophage survival. Mol Cell Biol 26: 699–708 [DOI] [PMC free article] [PubMed] [Google Scholar]
- Conze DB, Albert L, Ferrick DA, Goeddel DV, Yeh WC, Mak T, Ashwell JD (2005) Posttranscriptional downregulation of c‐IAP2 by the ubiquitin protein ligase c‐IAP1 in vivo . Mol Cell Biol 25: 3348–3356 [DOI] [PMC free article] [PubMed] [Google Scholar]
- Conze DB, Zhao Y, Ashwell JD (2010) Non‐canonical NF‐kappaB activation and abnormal B cell accumulation in mice expressing ubiquitin protein ligase‐inactive c‐IAP2. PLoS Biol 8: e1000518 [DOI] [PMC free article] [PubMed] [Google Scholar]
- Daoud M, Broxtermann PN, Schorn F, Werthenbach JP, Seeger JM, Schiffmann LM, Brinkmann K, Vucic D, Tuting T, Mauch C et al (2022) XIAP promotes melanoma growth by inducing tumour neutrophil infiltration. EMBO Rep 23: e53608 [DOI] [PMC free article] [PubMed] [Google Scholar]
- Dowling JP, Alsabbagh M, Del Casale C, Liu ZG, Zhang J (2019) TRADD regulates perinatal development and adulthood survival in mice lacking RIPK1 and RIPK3. Nat Commun 10: 705 [DOI] [PMC free article] [PubMed] [Google Scholar]
- Dumetier B, Zadoroznyj A, Dubrez L (2020) IAP‐mediated protein ubiquitination in regulating cell signaling. Cell 9: 1118 [DOI] [PMC free article] [PubMed] [Google Scholar]
- Ermolaeva MA, Michallet MC, Papadopoulou N, Utermohlen O, Kranidioti K, Kollias G, Tschopp J, Pasparakis M (2008) Function of TRADD in tumor necrosis factor receptor 1 signaling and in TRIF‐dependent inflammatory responses. Nat Immunol 9: 1037–1046 [DOI] [PubMed] [Google Scholar]
- Etemadi N, Chopin M, Anderton H, Tanzer MC, Rickard JA, Abeysekera W, Hall C, Spall SK, Wang B, Xiong Y et al (2015) TRAF2 regulates TNF and NF‐kappaB signalling to suppress apoptosis and skin inflammation independently of Sphingosine kinase 1. Elife 4: e10592 [DOI] [PMC free article] [PubMed] [Google Scholar]
- Feltham R, Bettjeman B, Budhidarmo R, Mace PD, Shirley S, Condon SM, Chunduru SK, McKinlay MA, Vaux DL, Silke J et al (2011) Smac mimetics activate the E3 ligase activity of cIAP1 protein by promoting RING domain dimerization. J Biol Chem 286: 17015–17028 [DOI] [PMC free article] [PubMed] [Google Scholar]
- Fritsch M, Gunther SD, Schwarzer R, Albert MC, Schorn F, Werthenbach JP, Schiffmann LM, Stair N, Stocks H, Seeger JM et al (2019) Caspase‐8 is the molecular switch for apoptosis, necroptosis and pyroptosis. Nature 575: 683–687 [DOI] [PubMed] [Google Scholar]
- Giardino Torchia ML, Conze DB, Ashwell JD (2013) c‐IAP1 and c‐IAP2 redundancy differs between T and B cells. PloS One 8: e66161 [DOI] [PMC free article] [PubMed] [Google Scholar]
- Haas TL, Emmerich CH, Gerlach B, Schmukle AC, Cordier SM, Rieser E, Feltham R, Vince J, Warnken U, Wenger T et al (2009) Recruitment of the linear ubiquitin chain assembly complex stabilizes the TNF‐R1 signaling complex and is required for TNF‐mediated gene induction. Mol Cell 36: 831–844 [DOI] [PubMed] [Google Scholar]
- Hsu H, Xiong J, Goeddel DV (1995) The TNF receptor 1‐associated protein TRADD signals cell death and NF‐kappa B activation. Cell 81: 495–504 [DOI] [PubMed] [Google Scholar]
- Hsu H, Shu HB, Pan MG, Goeddel DV (1996) TRADD‐TRAF2 and TRADD‐FADD interactions define two distinct TNF receptor 1 signal transduction pathways. Cell 84: 299–308 [DOI] [PubMed] [Google Scholar]
- Kashkar H (2010) X‐linked inhibitor of apoptosis: a chemoresistance factor or a hollow promise. Clin Cancer Res 16: 4496–4502 [DOI] [PubMed] [Google Scholar]
- Kearney CJ, Cullen SP, Clancy D, Martin SJ (2014) RIPK1 can function as an inhibitor rather than an initiator of RIPK3‐dependent necroptosis. FEBS J 281: 4921–4934 [DOI] [PubMed] [Google Scholar]
- Kist M, Komuves LG, Goncharov T, Dugger DL, Yu C, Roose‐Girma M, Newton K, Webster JD, Vucic D (2021) Impaired RIPK1 ubiquitination sensitizes mice to TNF toxicity and inflammatory cell death. Cell Death Differ 28: 985–1000 [DOI] [PMC free article] [PubMed] [Google Scholar]
- Liston P, Roy N, Tamai K, Lefebvre C, Baird S, Cherton‐Horvat G, Farahani R, McLean M, Ikeda JE, MacKenzie A et al (1996) Suppression of apoptosis in mammalian cells by NAIP and a related family of IAP genes. Nature 379: 349–353 [DOI] [PubMed] [Google Scholar]
- Mace PD, Linke K, Feltham R, Schumacher FR, Smith CA, Vaux DL, Silke J, Day CL (2008) Structures of the cIAP2 RING domain reveal conformational changes associated with ubiquitin‐conjugating enzyme (E2) recruitment. J Biol Chem 283: 31633–31640 [DOI] [PubMed] [Google Scholar]
- Mahoney DJ, Cheung HH, Mrad RL, Plenchette S, Simard C, Enwere E, Arora V, Mak TW, Lacasse EC, Waring J et al (2008) Both cIAP1 and cIAP2 regulate TNFalpha‐mediated NF‐kappaB activation. Proc Natl Acad Sci USA 105: 11778–11783 [DOI] [PMC free article] [PubMed] [Google Scholar]
- Micheau O, Tschopp J (2003) Induction of TNF receptor I‐mediated apoptosis via two sequential signaling complexes. Cell 114: 181–190 [DOI] [PubMed] [Google Scholar]
- Morrish E, Brumatti G, Silke J (2020) Future therapeutic directions for Smac‐Mimetics. Cell 9: 406 [DOI] [PMC free article] [PubMed] [Google Scholar]
- Moujalled DM, Cook WD, Okamoto T, Murphy J, Lawlor KE, Vince JE, Vaux DL (2013) TNF can activate RIPK3 and cause programmed necrosis in the absence of RIPK1. Cell Death Dis 4: e465 [DOI] [PMC free article] [PubMed] [Google Scholar]
- Moulin M, Anderton H, Voss AK, Thomas T, Wong WW, Bankovacki A, Feltham R, Chau D, Cook WD, Silke J et al (2012) IAPs limit activation of RIP kinases by TNF receptor 1 during development. EMBO J 31: 1679–1691 [DOI] [PMC free article] [PubMed] [Google Scholar]
- Newton K (2020) Multitasking kinase RIPK1 regulates cell death and inflammation. Cold Spring Harb Perspect Biol 12: a036368 [DOI] [PMC free article] [PubMed] [Google Scholar]
- Newton K, Dugger DL, Maltzman A, Greve JM, Hedehus M, Martin‐McNulty B, Carano RA, Cao TC, van Bruggen N, Bernstein L et al (2016) RIPK3 deficiency or catalytically inactive RIPK1 provides greater benefit than MLKL deficiency in mouse models of inflammation and tissue injury. Cell Death Differ 23: 1565–1576 [DOI] [PMC free article] [PubMed] [Google Scholar]
- Park SM, Yoon JB, Lee TH (2004) Receptor interacting protein is ubiquitinated by cellular inhibitor of apoptosis proteins (c‐IAP1 and c‐IAP2) in vitro . FEBS Lett 566: 151–156 [DOI] [PubMed] [Google Scholar]
- Polykratis A, Hermance N, Zelic M, Roderick J, Kim C, Van TM, Lee TH, Chan FKM, Pasparakis M, Kelliher MA (2014) Cutting edge: RIPK1 Kinase inactive mice are viable and protected from TNF‐induced necroptosis in vivo . J Immunol 193: 1539–1543 [DOI] [PMC free article] [PubMed] [Google Scholar]
- Ramakers C, Ruijter JM, Deprez RH, Moorman AF (2003) Assumption‐free analysis of quantitative real‐time polymerase chain reaction (PCR) data. Neurosci Lett 339: 62–66 [DOI] [PubMed] [Google Scholar]
- Rothe M, Pan MG, Henzel WJ, Ayres TM, Goeddel DV (1995) The TNFR2‐TRAF signaling complex contains two novel proteins related to baculoviral inhibitor of apoptosis proteins. Cell 83: 1243–1252 [DOI] [PubMed] [Google Scholar]
- Samuel T, Welsh K, Lober T, Togo SH, Zapata JM, Reed JC (2006) Distinct BIR domains of cIAP1 mediate binding to and ubiquitination of tumor necrosis factor receptor‐associated factor 2 and second mitochondrial activator of caspases. J Biol Chem 281: 1080–1090 [DOI] [PubMed] [Google Scholar]
- Schiffmann LM, Werthenbach JP, Heintges‐Kleinhofer F, Seeger JM, Fritsch M, Gunther SD, Willenborg S, Brodesser S, Lucas C, Jungst C et al (2020) Mitochondrial respiration controls neoangiogenesis during wound healing and tumour growth. Nat Commun 11: 3653 [DOI] [PMC free article] [PubMed] [Google Scholar]
- Shu HB, Takeuchi M, Goeddel DV (1996) The tumor necrosis factor receptor 2 signal transducers TRAF2 and c‐IAP1 are components of the tumor necrosis factor receptor 1 signaling complex. Proc Natl Acad Sci USA 93: 13973–13978 [DOI] [PMC free article] [PubMed] [Google Scholar]
- Silke J (2011) The regulation of TNF signalling: what a tangled web we weave. Curr Opin Immunol 23: 620–626 [DOI] [PubMed] [Google Scholar]
- Silke J, Vaux DL (2015) IAP gene deletion and conditional knockout models. Semin Cell Dev Biol 39: 97–105 [DOI] [PubMed] [Google Scholar]
- Tang Y, Tu H, Zhang J, Zhao X, Wang Y, Qin J, Lin X (2019) K63‐linked ubiquitination regulates RIPK1 kinase activity to prevent cell death during embryogenesis and inflammation. Nat Commun 10: 4157 [DOI] [PMC free article] [PubMed] [Google Scholar]
- Uren AG, Pakusch M, Hawkins CJ, Puls KL, Vaux DL (1996) Cloning and expression of apoptosis inhibitory protein homologs that function to inhibit apoptosis and/or bind tumor necrosis factor receptor‐associated factors. Proc Natl Acad Sci USA 93: 4974–4978 [DOI] [PMC free article] [PubMed] [Google Scholar]
- Van Hauwermeiren F, Armaka M, Karagianni N, Kranidioti K, Vandenbroucke RE, Loges S, Van Roy M, Staelens J, Puimege L, Palagani A et al (2013) Safe TNF‐based antitumor therapy following p55TNFR reduction in intestinal epithelium. J Clin Invest 123: 2590–2603 [DOI] [PMC free article] [PubMed] [Google Scholar]
- Vanlangenakker N, Bertrand MJ, Bogaert P, Vandenabeele P, Vanden Berghe T (2011) TNF‐induced necroptosis in L929 cells is tightly regulated by multiple TNFR1 complex I and II members. Cell Death Dis 2: e230 [DOI] [PMC free article] [PubMed] [Google Scholar]
- Varfolomeev E, Vucic D (2022) RIP1 post‐translational modifications. Biochem J 479: 929–951 [DOI] [PubMed] [Google Scholar]
- Varfolomeev E, Wayson SM, Dixit VM, Fairbrother WJ, Vucic D (2006) The inhibitor of apoptosis protein fusion c‐IAP2.MALT1 stimulates NF‐kappaB activation independently of TRAF1 AND TRAF2. J Biol Chem 281: 29022–29029 [DOI] [PubMed] [Google Scholar]
- Varfolomeev E, Blankenship JW, Wayson SM, Fedorova AV, Kayagaki N, Garg P, Zobel K, Dynek JN, Elliott LO, Wallweber HJ et al (2007) IAP antagonists induce autoubiquitination of c‐IAPs, NF‐kappaB activation, and TNFalpha‐dependent apoptosis. Cell 131: 669–681 [DOI] [PubMed] [Google Scholar]
- Varfolomeev E, Goncharov T, Fedorova AV, Dynek JN, Zobel K, Deshayes K, Fairbrother WJ, Vucic D (2008) c‐IAP1 and c‐IAP2 are critical mediators of tumor necrosis factor alpha (TNFalpha)‐induced NF‐kappaB activation. J Biol Chem 283: 24295–24299 [DOI] [PMC free article] [PubMed] [Google Scholar]
- Vaux DL, Silke J (2005) IAPs, RINGs and ubiquitylation. Nat Rev Mol Cell Biol 6: 287–297 [DOI] [PubMed] [Google Scholar]
- Vince JE, Wong WW, Khan N, Feltham R, Chau D, Ahmed AU, Benetatos CA, Chunduru SK, Condon SM, McKinlay M et al (2007) IAP antagonists target cIAP1 to induce TNFalpha‐dependent apoptosis. Cell 131: 682–693 [DOI] [PubMed] [Google Scholar]
- Vince JE, Pantaki D, Feltham R, Mace PD, Cordier SM, Schmukle AC, Davidson AJ, Callus BA, Wong WW, Gentle IE et al (2009) TRAF2 must bind to cellular inhibitors of apoptosis for tumor necrosis factor (tnf) to efficiently activate nf‐{kappa}b and to prevent tnf‐induced apoptosis. J Biol Chem 284: 35906–35915 [DOI] [PMC free article] [PubMed] [Google Scholar]
- Wong WW, Gentle IE, Nachbur U, Anderton H, Vaux DL, Silke J (2010) RIPK1 is not essential for TNFR1‐induced activation of NF‐kappaB. Cell Death Differ 17: 482–487 [DOI] [PubMed] [Google Scholar]
- Yeh WC, Shahinian A, Speiser D, Kraunus J, Billia F, Wakeham A, de la Pompa JL, Ferrick D, Hum B, Iscove N et al (1997) Early lethality, functional NF‐kappaB activation, and increased sensitivity to TNF‐induced cell death in TRAF2‐deficient mice. Immunity 7: 715–725 [DOI] [PubMed] [Google Scholar]
- Zarnegar BJ, Wang Y, Mahoney DJ, Dempsey PW, Cheung HH, He J, Shiba T, Yang X, Yeh WC, Mak TW et al (2008) Noncanonical NF‐kappaB activation requires coordinated assembly of a regulatory complex of the adaptors cIAP1, cIAP2, TRAF2 and TRAF3 and the kinase NIK. Nat Immunol 9: 1371–1378 [DOI] [PMC free article] [PubMed] [Google Scholar]
- Zhang J, Webster JD, Dugger DL, Goncharov T, Roose‐Girma M, Hung J, Kwon YC, Vucic D, Newton K, Dixit VM (2019a) Ubiquitin ligases cIAP1 and cIAP2 limit cell death to prevent inflammation. Cell Rep 27: 2679–2689.e3 [DOI] [PubMed] [Google Scholar]
- Zhang X, Zhang H, Xu C, Li X, Li M, Wu X, Pu W, Zhou B, Wang H, Li D et al (2019b) Ubiquitination of RIPK1 suppresses programmed cell death by regulating RIPK1 kinase activation during embryogenesis. Nat Commun 10: 4158 [DOI] [PMC free article] [PubMed] [Google Scholar]