Abstract
pH regulation is essential to allow normal cell function, and their imbalance is associated with different pathologic situations, including cancer. In this study, we present the synthesis of 2-(((2-aminoethyl)imino)methyl)phenol (HL1) and the iron (III) complex (Fe(L1)2Br, (C1)), confirmed by X-ray diffraction analysis. The absorption and emission properties of complex C1 were assessed in the presence and absence of different physiologically relevant analytes, finding a fluorescent turn-on when OH− was added. So, we determined the limit of detection (LOD = 3.97 × 10⁻⁹ M), stoichiometry (1:1), and association constant (Kas = 5.86 × 10³ M−1). Using DFT calculations, we proposed a spontaneous decomposition mechanism for C1. After characterization, complex C1 was evaluated as an intracellular pH chemosensor on the human primary gastric adenocarcinoma (AGS) and non-tumoral gastric epithelia (GES-1) cell lines, finding fluorescent signal activation in the latter when compared to AGS cells due to the lower intracellular pH of AGS cells caused by the increased metabolic rate. However, when complex C1 was used on metastatic cancer cell lines (MKN-45 and MKN-74), a fluorescent turn-on was observed in both cell lines because the intracellular lactate amount increased. Our results could provide insights about the application of complex C1 as a metabolic probe to be used in cancer cell imaging.
Keywords: pH chemosensor, fluorescence turn-on, live cell imaging, gastric cancer, metabolic sensor, lactate
1. Introduction
It is well known that intra- and pericellular pH are essential for normal cell function. Maintenance of intracellular pH is essential for establishing the outcome of many cellular processes, including cell growth and differentiation, cell metabolism, and protein synthesis [1]. For example, cancer cell metabolism is characterized by enhanced glucose use and uptake [2], decreasing intracellular pH when compared to non-tumoral cells [3]. In this sense, cancer cells create a reversed pH gradient with their pericellular pH being more acidic than normal cells, associated with abnormal glycolytic activity and other metabolic alterations that lead to an increase in pyruvate conversion into lactate instead of citrate [4], acidifying the extracellular medium. Low extracellular pH in cancer cells plays a significant role in drug inactivation or reduced uptake and the promotion of invasiveness and metastatic potential [3]. Due to the essential role of pH in cellular fate, the ability to monitor and visualize pH values and distribution using non-invasive probes is in high demand. Therefore, fluorescent and colorimetric sensors have attracted widespread attention for their potential use in the detection of numerous environmental and biologically important species because of their operational simplicity, low cost, fast response, and, in the best of cases, high sensitivity, selectivity, and satisfactory detection limits [5].
Fluorescent probes are widely utilized as selective analyte-binding devices, often with the capability of reversible binding. For instance, coumarin, thiophene-based Schiff bases, and azo dyes are commonly employed to detect physiologically relevant or potentially harmful metal centers [6,7,8,9,10], as well as toxic organic residues originating from industries such as textiles, agriculture, and pharmaceuticals [11,12]. Furthermore, fluorescent probes can be utilized to detect specific anions [6,13,14,15] within living tissues. These probes play a crucial role in the detection and monitoring of analytes, offering valuable insights into various biological and environmental processes. Salen-type Schiff base chemosensors, as depicted in Figure 1, are particularly noteworthy for their suitability as molecular frameworks for sensing applications. Many of these chemosensors form coordination compounds with first-row transition metal centers, resulting in luminescent materials [16]. This feature contributes to their usefulness as luminescent probes in sensing applications, allowing for the detection and monitoring of analytes through changes in their emission properties. Chemosensors based on coordination metal compounds have demonstrated their effectiveness in detecting highly toxic anions. These chemosensors have been successfully employed in the detection of hazardous species such as cyanide, halogens [17], and/or toxic industrial gases [14]. Furthermore, they have shown promise in distinguishing between various basic anions in aqueous environments and even within living systems. The inherent stability of coordination metal compounds in the presence of analytes within their coordination spheres contributes to their robust performance as chemosensors. This stability has been demonstrated by N. Mohan et al., who reported on a fluorescent probe based on Ni(II)-salen (1). This probe enables the detection of metallic analytes such as Al(III) through a transmetalation process [18]. Similarly, J. Yu et al. developed a turn-off–on fluorescence chemosensor utilizing an Fe(III)-salen complex (2), which exhibits a redox response for the detection of hydrazine [19].
Figure 1.
Metal complexes with chemosensor properties.
For instance, a recent study focused on the development of a reaction-based chemical reagent, Fe(III)-salen (3), specifically designed for sensing mitochondrial inorganic pyrophosphate (PPi) in living cells [20]. PPi is a byproduct involved in biosynthetic reactions and serves as a diagnostic marker for various diseases [21]. The Fe(III)-salen reagent demonstrates the potential to selectively detect and monitor PPi levels within mitochondria, providing valuable insights into cellular processes and potential disease states.
The objective of this study is to investigate a novel fluorescent sensing system utilizing Fe(III)-salen for the detection of alkaline pH. Furthermore, this study aims to evaluate the fluorescent differentiation capabilities of this system between gastric cancer cells (AGS cell line) and non-tumor cells (GES-1 cell line). As an extension of the chemosensing application in cancer cells, the assessment was extended to metastatic tumor cell lines, specifically MKN-45 and MKN-74. However, it was observed that the altered metabolic cycle of these cell lines resulted in an increase in lactate levels and an alkaline intracellular environment.
2. Results
2.1. Chemistry
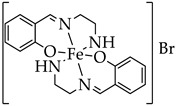
The ligand 2-(((2-aminoethyl)imino)methyl)phenol (HL1) was synthesized by reflux for 30 min using salicylaldehyde and ethylenediamine to avoid the formation of the tetradentade ligand. The resulting yellow solution was dried and quickly analyzed by spectroscopic techniques. The infrared spectrum of HL1 exhibited a strong intensity absorption stretching band at ν = 1635 cm−1 that was attributed to C=N vibration, which is evidence of imine condensation (Figure S1) and is concordant with a previous report [22]. Then, the ligand solution (HL1), 1.0 mol equivalent of Na2CO3, and 0.5 mol equivalent of FeBr3 to ensure the stoichiometry 2:1 (ligand: Fe(III)) were mixed and refluxed for 1 h, forming a dark-red solution (Scheme 1). This solution was filtered and slowly evaporated at room temperature, yielding the iron (III) complex (C1) as a dark, red-colored solid. Using infrared and Raman spectroscopic techniques, the iron (III) complex (C1) was analyzed. In both spectrums, the C1 compound showed the same band at ν = 606–608 cm−1 and ν = 447–445 cm−1, which was attributed to Fe-O and Fe-N vibrations, respectively (Figure S2).
Scheme 1.
Synthesis of ligand HL1 and the Fe(III) complex (C1).
Single crystals of iron (III) complex (C1) were grown by diffusing methane, and X-ray diffraction analysis indicated that C1 crystalizes in a triclinic P-1, with one molecular entity in the asymmetric unit (Z′ = 1). The N2O ligands coordinate meridionally to the Fe(III) metal center (configuration mer, Figure 2A). Table S1 exhibits selected bond distances and angles for the coordination sphere. Specifically, it is described as a distorted octahedron [23] with Σ = 79.6°, Θ = 226.1° at 170 K, and α = 100.8°, which indicates that the octahedron is highly distorted. Finally, crystal packing (Figure 2B) exhibited principal intermolecular Nimine⋯H, O⋯H, and Br⋯H hydrogen bonds along the plane [010].
Figure 2.
Crystal structure of iron (III) complex C1. (A) Structure of complex with ellipsoids drawn at 30% probability. (B) Packing diagram of complex (C1) showing intermolecular Nimine⋯H (blue), O⋯H (red), and Br⋯H (dark red) hydrogen bonds along the plane [010].
2.2. Photophysical Characterization and Chemosensing Capacity Assessment
The photophysical properties of the iron (III) complex (C1) were assessed from a stock dissolution at a concentration of 1.0 × 10⁻² M in DMSO and stored in the dark at −4 °C [24,25,26]. From the stock solution, absorption properties were measured using dilutions in acetonitrile, obtaining a maximum absorption wavelength at λAbs = 330 nm and an absorption coefficient ε = 5358.5 M−1·cm−1 corresponding to the π → π* transition, while the maximum absorption wavelength at λAbs = 504 nm with an absorption coefficient ε = 1812.3 M−1·cm−1 could be assigned to the charge-transfer transition metal → ligand (Figure S3) [22]. Subsequently, the behavior of the iron (III) complex (C1) in the presence of different inorganic salts was assessed (Figure S4), showing a slight change in the maximum absorption wavelength (λAbs = 330 nm) in all the samples tested. The case of the hydroxide (OH−), metabisulfite (S2O5−2), and nitrate (NO3−) treatments caused a hyperchromic effect on the metal–ligand transition wavelength. Interestingly, only the OH− sample showed a new electronic transition band at λAbs = 370 nm (Figure S4), confirming a change in the electronic states of the complex (C1) [27]. Due to these changes in the absorption spectra after addition of NaOH to the iron (III) complex (C1), the stability of this interaction was evaluated, showing high responses in a short time (3 min), which were stable up to 30 min in the absorption band λAbs = 386 nm (Figure S5).
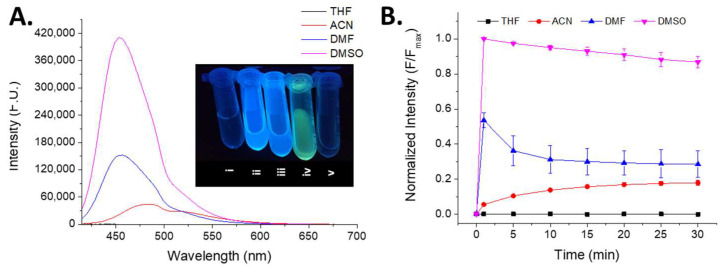
Because of their potential application in biological sciences, the emission property was assessed considering the absence and presence of several of the previously mentioned analytes. Initially, dissolution of the iron (III) complex (C1) did not show fluorescent properties, with this effect explained by the paramagnetic properties of the iron (III) ion [28,29]. Moreover, the change in emission properties after the addition of analytes was evaluated, finding a selective fluorescence turn-on after NaOH was added to the iron (III) complex (C1) solution. Therefore, changes in the emission frequency of complex C1 using different solvents and their influence on the recognition of NaOH were measured (Figure S6), finding the highest emission rates using DMSO. In addition, by increasing the amounts of water interacting with NaOH from DMSO:H2O: 10:0 to DMSO:H2O: 9:1, fluorescence intensity decayed by approximately 40% (Figure 3). This trend was also observed when the amount of water was increased from 20% to 50%, obtaining a fluorescence intensity decay of around 80% when compared to the DMSO-only measurements.
Figure 3.
Emission response of the iron (III) complex (C1) after the addition of NaOH. (A) Spectrum overlapping and emission intensity change at various water rates. (B) Intensity emission behavior using different DMSO:Water mixes at λEm maximum in each solvent. λEx = 399 nm; λEm 0% H2O = 456 nm; λEm 10% H2O = 458 nm; λEm 20% H2O = 480 nm; λEm 30% H2O = 487 nm; λEm 40% H2O = 488 nm; λEm 50% H2O = 488 nm; λEm 100% H2O = 489 nm; CC1 = 20 µM; CNaOH = 10 mol equivalents; solvent = DMSO. Image code: i: Iron (III) complex (C1) dissolved in DMSO. ii: Iron (III) complex (C1) dissolved in DMSO with NaOH 10 molar equivalents. iii: Iron (III) complex (C1) dissolved in DMSO:H2O: 9:1 with NaOH 10 molar equivalents. iv: Iron (III) complex (C1) dissolved in DMSO:H2O: 8:2 with NaOH molar equivalents. v: Iron (III) complex (C1) dissolved in DMSO:H2O: 7:3 with NaOH 10 molar equivalents. vi: Iron (III) complex (C1) dissolved in DMSO:H2O: 6:4 with NaOH 10 molar equivalents. vii: Iron (III) complex (C1) dissolved in DMSO:H2O: 5:5 with NaOH 10 molar equivalents. viii: Iron (III) complex (C1) dissolved in H2O with NaOH 10 molar equivalents.
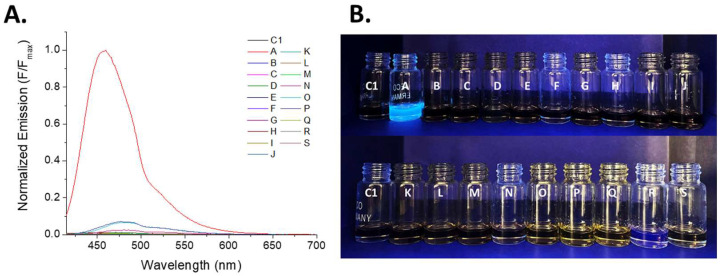
After characterizing the ideal conditions for iron (III) complex (C1) fluorescent emission, its response before and after adding the previously described analytes was studied (Figure 4), showing a specific emission fluorescence turn-on of the solution only when OH− was added. Regarding the acid–base properties of all the conditions studied, only OH− caused a significant change in the electronic structure of the iron (III) complex (C1). Therefore, the strong base property of the OH− is the response to the photophysical changes, and the optical emission properties could link to the potential hydrogen transfer from the NH2 fragment of the iron (III) complex (C1) to the strong base (OH−), similar to what was shown in the indole core through the fluoride anion [30].
Figure 4.
Emission response of the iron (III) complex (C1) after the addition of several analytes. (A) Overlapping emission spectrum. (B) Naked-eye emission change in the complex with all analytes assessed illuminated with a UV-Lamp λ = 360 nm. CC1 = 20 µM, CSample = 10 mol equivalents, solvent = DMSO. Sample code: A. Hydroxide (OH−); B. Metabisulfite (S2O5−2); C. Iodide (I−); D. Acetate (MeCO2−); E. Nitrate (NO3−); F. Sulfate (SO4−2); G. Thiosulfate (S2O3−2); H. Bicarbonate (HCO3−); I. Bisulfite (HSO3−); J. Iodate (IO3−); K. Cyanide (CN−); L. Fluoride (F−); M. Sulfide (S−); N. Carbonate (CO3−2); O. Citrate (C6H5O7−3); P. Monoacid phosphate (HPO4−2); Q. Diacid phosphate (H2PO4−); R. Arsenite (AsO2−); S. Tartrate (C4H4O6−2).
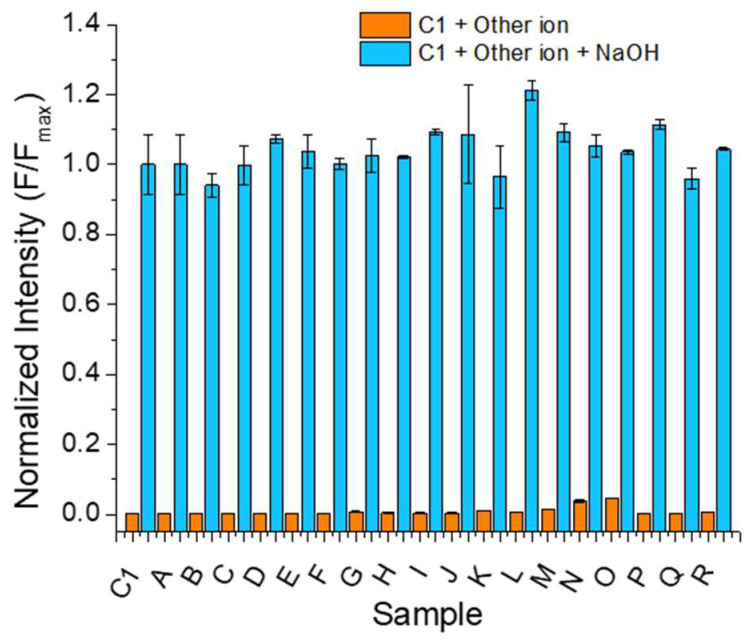
To further investigate the selectivity of the Fe(III)-salen complex in the fluorescence turn-on process, the potential interference of various analytes was assessed, as depicted in Figure 5. In this experimental setup, different interferents, such as metabisulfite, iodide, acetate, and others, were introduced and mixed with the iron (III) complex (C1). After an incubation period of 3 min, the fluorescence emission was measured. Immediately after measurement, NaOH was added to the previous solution, and fluorescence emission was registered again after a 3 min incubation. The hydroxide anion was capable of displacing interfering analytes like cyanide (CN−), nitrate (NO3−), carbonate (CO3−2), bicarbonate (HCO3−), and fluoride (F−) in all of the assessed samples, highlighting that the iron (III) complex (C1) has a preferred interaction with the strong base OH−. From these results, it can be reaffirmed that the alkaline strength of hydroxide can remove the hydrogen attached to the amino-terminal group (N4, see Figure 2A) of the ligand fragment, as mentioned above.
Figure 5.
Capability of NaOH to displace the interaction of the iron (III) complex (C1) with other inorganic salts. Sample coding: A. Metabisulfite (S2O5−2), B. Iodide (I−), C. Acetate (MeCO2−), D. Nitrate (NO3−), E. Sulfate (SO4−2), F. Thiosulfate (S2O3−2), G. Bicarbonate (HCO3−), H. Bisulfite (HSO3−), I. Iodate (IO3−), J. Cyanide (CN−), K. Fluoride (F−), L. Sulfide (S−2), M. Carbonate (CO3−2), N. Citrate (C6H5O7−3), O. Monoacid phosphate (HPO4−2), P. Diacid phosphate (H2PO4−), Q. Arsenite (AsO2−), R. Tartrate (C4H4O6−2). λEx = 399 nm and λEm = 456 nm. CC1= 20 µM, CSample = 10 mol equivalents, solvent = DMSO. Inorganic salts = 10 molar equivalents, incubation time = 1 min, n = 3.
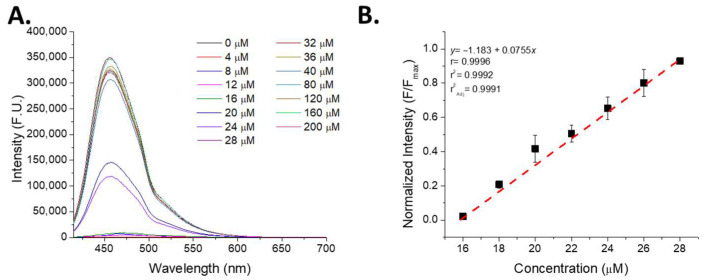
According to these results, the iron (III) complex (C1) can identify the presence of hydroxide in the absence or presence of other potential anionic interferents (Figure 4 and Figure 5). To evaluate the capacity of C1 to interact with established amounts of hydroxide, a titration of the iron (III) complex (C1) was measured via their fluorescence emission responses (Figure 6A) after addition of NaOH, obtaining similar spectra along the whole titration range and a linear signal–concentration relationship between 16 and 28 µM (Figure 6B). In addition, the limit of detection (LOD) and limit of quantification (LOQ) of this interaction were calculated in the nanomolar range (LOD = 3.97 × 10⁻⁹ M, pH 7.009, and LOQ = 13.2 × 10⁻⁹ M, pH 7.029). Comparing our results with other chemosensors for alkaline pH, we found some examples of colorimetric and fluorometric sensors (displayed in Table 1), but the majority of them do not have information about their LODs, except for a 2,2-dimethyl-2,5-dihydrofuran derivative that informed a LOD of 4.08 ppb (or 102 × 10−9 M of NaOH equivalents), showing that the iron (III) complex (C1) is 25.7-fold more sensitive than this colorimetric chemosensor [31].
Figure 6.
Titration of iron (III) complex (C1) with increasing amounts of NaOH. (A) Spectrum of the titration. (B) Linear segment of the titration. CC1 = 20 µM, λEx = 399 nm; λEm = 456 nm; solvent = DMSO; incubation time = 3 min.
Table 1.
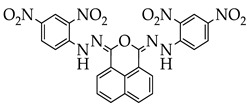
Comparison between alkaline pH chemosensors and the iron (III) complex (C1).
| Entry | Compound | Media a | Method b | LOD c | Kas d | Ref. |
|---|---|---|---|---|---|---|
| 1 |
|
ACN:H2O | Colorimetric | N.R. e | 2.39 × 10⁴ | [33] |
| 2 |

|
DMSO:H2O 9:1 |
Colorimetric | N.R. e | N.R. e | [35] |
| 3 |

|
ACN | Colorimetric | N.R. e | 24.41 × 10⁴ | [34] |
| 4 |

|
DMSO | Colorimetric | N.R. e | N.R. e | [32] |
| 5 |

|
ACN | Colorimetric | 4.08 ppb | N.R. e | [31] |
| 6 |

|
PBS:DMSO 99:1 |
Fluorometric | N.R. e | N.R. e | [5] |
| 7 |

|
PBS:EtOH 99:1 |
Fluorometric | N.R. e | N.R. e | [36] |
| 8 |
 Iron (III) complex (C1) |
DMSO | Fluorometric | 0.159 ppb | 5.86 × 10³ | Our study |
Media a: solvent used for measurement. Method b: methodology used for chemosensor evaluation. LOD c: limit of detection. Kas d: association constant measured by Benesi–Hildebrand method to host:guest 1:1 stoichiometry. N.R. e: not reported.
In parallel to the titration results, the stoichiometry of the C1–NaOH interaction was calculated using Job’s plot, and the constant of association was obtained using the Benesi–Hildebrand method (Figure S7), obtaining a 1:1 stoichiometry that, in contrast with the available literature, can be mechanistically explained by the transfer of the hydrogen atom from the amino to the hydroxyl group [32]. In fact, when this information was compared with the obtained crystal structure (Figure 2A), the terminal -NH2 of the ligand binds with bromide through one hydrogen atom, showing an important positive charge on this hydrogen atom. In addition, the association constant (Kas) obtained for the C1–NaOH interaction was Kas = 5.86 × 10³ M−1. Comparing this value with other alkaline-sensitive compounds, our result is 4.1-fold lower than the 1H,3H-benzo[de]isochromene derivative (Table 1, Entry 1) and 41.7-fold lower than the nitroaryl-hydrazide derivative (Table 1, Entry 3). However, despite the low Kas value shown for C1, our synthesized compound showed higher selectivity than the aforementioned chemosensors: the 1H,3H-benzo[de]isochromene derivative can also interact with cyanide anions, while the nitroaryl-hydrazide derivative can sense fluoride, acetate, hydrogen sulfate, and also cyanide anions [33,34].
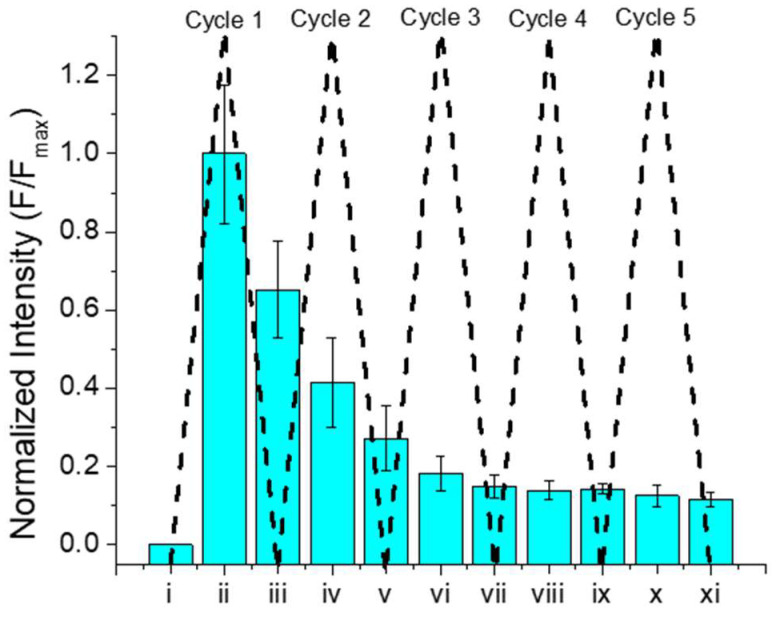
After these characterization assays, the reversibility of the fluorescence emission using the base–acid equilibrium was evaluated (Figure 7). In this figure, the complex (C1) dissolved in DMSO (sample i) was mixed with 1.0 equivalent mol NaOH, and, after three minutes, maximum fluorescence was measured (sample ii). Then, 1.0 mol equivalent HCl was added to the previous mixture, and fluorescence was measured again after a three-minute incubation, showing an approximate decay of 40% (sample iii) despite the neutralized NaOH that causes the turn-on of the chemosensor. This NaOH-HCl treatment cycle was repeated five times, observing a continuous decay in fluorescence intensity that stalled after cycle 2. This situation reflects that the photophysical change is irreversible, which is different from the situation reported for all the chemosensors mentioned in Table 1 (except entries 3 and 4, which were not informed). A plausible mechanism for this is the decomposition of the iron (III) complex (C1). More details about this mechanism are described in the following section.
Figure 7.
Fluorescence intensity measurements of the iron (III) complex (C1) after the addition of NaOH and HCl. CC1 = 20 µM, λEx = 399 nm; λEm = 456 nm; solvent = DMSO; incubation time = 3 min. Sample code: i: Complex dissolved in DMSO; ii: Complex dissolved in DMSO + 1.0 equivalent mol NaOH; iii: ii + 1.0 equivalent mol HCl; iv: iii + 1.0 equivalent mol NaOH; v: iv + 1.0 equivalent mol HCl; vi: v + 1.0 equivalent mol NaOH; vii: vi + 1.0 equivalent mol HCl; viii: vii + 1.0 equivalent mol NaOH; ix: viii + 1.0 equivalent mol HCl; x: ix + 1.0 equivalent mol NaOH; xi: x + 1.0 equivalent mol HCl.
2.3. Computational Approach
In order to sustain the experimental findings from the photophysical characterization and provide a plausible explanation for the observed phenomena, different species involved in the iron (III) complex (C1) and hydroxyl anion interaction using DFT-B3LYP-LanL2DZ level calculus were performed [26,37]. Initially, the structures of the iron (III) complex (C1) and hydroxide anion were optimized, and the electrostatic potential map (ESP) and the molecular orbitals (HOMO and LUMO) were plotted (Figure S8). In the case of the complex, the ESP map shows both aryl rings in a light-blue color, while the =N-(CH2)2-NH2 fragment is observed in a deep-blue color, demonstrating the positive charge of the iron (III) complex (Figure S8A). In addition, the HOMO focused on one of the salicylaldehyde fragments (Figure S8B), and the LUMO was mainly disseminated on both =N-(CH2)2-NH2 and the iron atom (Figure S8C). On the other hand, the ESP map of the hydroxyl anion showed an important red zone around the oxygen atom (Figure S8D), which is consistent with the HOMO plot (Figure S8E). In contrast, the LUMO focused on the hydrogen atom (Figure S8F).
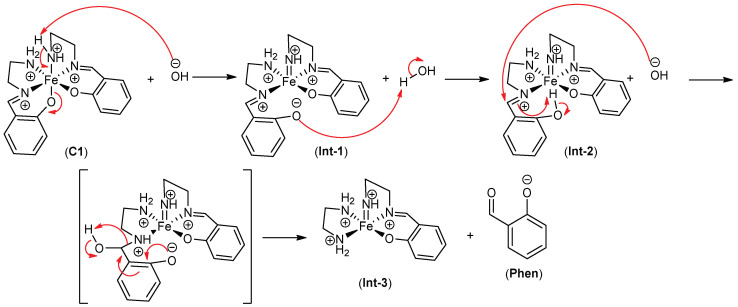
Based on the theoretical results, a hydrogen atom subtraction from the =N-(CH2)2-NH2 fragment of the iron (III) complex (C1) is plausible. In fact, due to the highly positive charge on the hydrogen atoms from the amino-terminal group (N4, Figure 2A), these atoms are labile to the hydroxyl anion presence, and this is concordant to the information shown in the hydrogen bonding of the crystal structure of the C1 complex (Figure 2A). Then, the hydrogen transfers from the complex (C1) together with the hydroxyl group were calculated, showing the formation of one water molecule and complex disassembly (Figure 8). This result confirms the proposed decomposition mechanism of complex C1, where the initial fluorescence intensity is not recovered from the second of five NaOH-HCl treatment cycles. With all this information, a final reaction mechanism is proposed (Figure 9).
Figure 8.
Electrostatic potential map (ESP) and molecular orbitals of the macrostructure C1 + OH−. (A) ESP of the macrostructure. (B) HOMO of the macrostructure. (C) LUMO of the macrostructure.
Figure 9.
Reaction mechanism proposed for the turn-on fluorescence of the C1 complex.
In order to increase the robustness of the proposed reaction mechanism, all the reaction steps were calculated, and the internal energy of each intermediate compound (Int) is detailed in Figure S9. Contrasting the internal energies of the C1 complex and the proposed macrostructure C1+OH− (Int-1, Figure 9) with the C1 complex, there is a negative difference (ΔE = −76.996 hartree), confirming a spontaneous interaction. Moreover, the internal energy from Int-1 to Int-3 showed a slight decrease on each step; for example, the energy difference between Int-1 and Int-2 was ΔE = −0.025 hartree, while the difference between Int-2 and Int-3 was ΔE = −0.014 hartree. These variations in the internal energies support the spontaneous optical changes proposed in the reaction mechanism. In this way, the color and fluorescence changes to the naked eye of the salycilaldehyde and the iron (III) complex (C1) were tested (Figure S10), finding a similar color change in the samples using natural light as well as a similar emission fluorescence color. In addition, the proposed mechanism is similar to the one reported for chemosensor (3), which detects pyrophosphate via turn-on fluorescence following a disassembly approach forming the salycilaldehyde fragment [20].
To validate the proposed decomposition of the iron (III) complex (C1) assisted by hydroxide, the UV-Vis spectra of the macrostructure (C1-OH) and the other intermediates (Int-1 to Int-3) were calculated and overlapped with the experimental spectra (Figure S11). This figure shows the calculated UV-Vis spectra of the macrostructure (C1-OH); intermediate Int-1 has identical UV-Vis spectra. In addition, the experimental spectra contain various contributions of all intermediates calculated, among them absorption bands at 215, 254, 313, and 389 nm (Figures S12–S16, respectively). The 215 nm signal corresponds to the highly energetic absorption transitions, for example, ligand → ligand (Int-1, Figure S13), ligand → metal (Int-2 and Int-3, Figures S14 and S15, respectively), and phenolate → benzene (Phen, Figure S16). In addition, the 254 nm transition only shows intermediates Int-2 and Int-3 (Figures S14 and S15), and the absorption bands could link to the ligand → metal transitions. In the case of the absorption transition at 389 nm, the transition phenolate → metal (Int-3) and the transition phenolate → benzaldehyde (Phen) are the most probable according to their oscillator strength and the nearest to the transition absorption band (348 nm and 360 nm, respectively; see Figures S15 and S16). Regarding the overlapping of experimental and calculated spectra (Figure S11), none of them show an absorption peak at 313 nm; however, checking thoroughly the oscillator strength of all species calculated, Int-1 and Int-3 showed a high oscillator (312.6 nm and 315.4 nm, respectively), and they could be associated with the experimental observations.
2.4. Biological Application
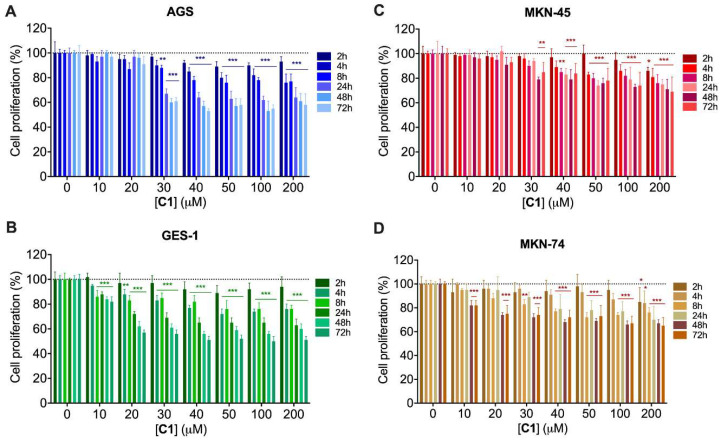
In order to evaluate if C1 is suitable for being used as an intracellular pH chemosensor, Resazurin reduction assays were carried out to observe its effects on the cell proliferation of four gastric cell lines (AGS, GES-1, MKN-45, and MKN-74) (Figure 10).
Figure 10.
Cytotoxicity assessment of the iron (III) complex (C1) via Rezasurin reduction assay at different concentrations and incubation times. (A) AGS cell line. (B) GES-1 cell line. (C) MKN-45 cell line. (D) MKN-74 cell line. Significant differences were evaluated using multiple Student’s t-test comparisons between each treatment group and time and their corresponding probe-untreated control condition. Data are presented as means ± SD (n = 4). * p < 0.05, ** p < 0.01, *** p < 0.001.
As observed in Figure 10, cell viability is not significantly compromised after an 8 h incubation with C1 at concentrations below 30 μM. In general, 2 h incubations with compound C1 did not have significant effects on the proliferation of the studied cell lines in the evaluated concentration range. However, longer incubation periods induced a cell line-dependent decrease in cell proliferation. For AGS and MKN-45, this reduction became significant at 30 μM (Figure 10A,C), and for GES-1 and MKN-74, these changes started at 10 μM (Figure 10B,D). Analyzing the 200 μM C1 condition, a 31–49% reduction in cell proliferation was observed after a 72 h incubation in all the cell lines tested, with the metastatic gastric cancer cell lines MKN-45 and MKN-74 being the least affected by complex C1. This cytotoxic pattern is similar to previous reports for other chemosensors [38,39,40], where low concentrations and short incubation times did not induce cell damage. These results portray C1 as a safe candidate to be evaluated as a fluorescent chemosensor capable of discriminating changes in cell metabolism by its capacity to fluctuate its fluorescent emission intensity according to the environmental pH.
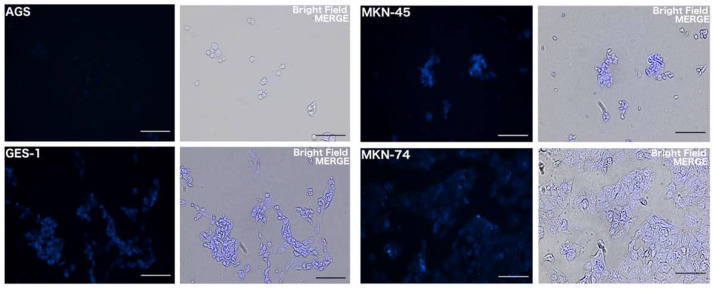
To evaluate this potential use, a fluorescence imaging study was carried out using the same gastric cell lines (AGS, GES-1, MKN-45, and MKN-74) submitted to a 1 h incubation with 100 µM C1. In the AGS cells, a weak fluorescent signal was observed in comparison to the other cell lines stabilized at extracellular pH 7.4 (Figure 11). Conversely, a bright-blue homogeneous signal was observed in GES-1 (a non-tumoral cell line), attributing this difference to a highly aerobic metabolism of AGS cells that has an impact reducing intracellular pH [41]. In addition, MKN-45 and MKN-74 cells also showed a blue fluorescent signal, with MKN-45 being the condition that displayed the most intense signal (Figure 11). Regarding AGS cells, our findings showed an apparent intracellular pH lower than 6.9 by the faint fluorescence intensity observed by microscopy, which is similar to the results obtained for an amphiphilic fluorescent probe used in AGS cells equilibrated at pH 7.0 [42]. This phenomenon is also supported by previous report on AGS, MKN-28, MKN-45, and SNU-1 gastric cancer cell lines, who, are capable to tolerate and maintain cell viability under acidic extracellular pH conditions through their H+ extrusion capacity via H+/K+ ATPase overexpression [43]. However, the extent of this pump overexpression could be different in each cell line. In addition to this, MKN-45 and MKN-74 also have increased protein levels of the Na+/H+ exchanger pump, which is associated with even higher intracellular pH levels, which can, in turn, enhance glycolytic metabolism [42,44].
Figure 11.
Fluorescent signal detection in gastric cell lines incubated with C1. Fluorescence imaging (left) and merged images with bright field captions (right) of cells after a 1 h incubation with 100 μM iron (III) complex (C1) on AGS, GES-1, MKN-45, and MKN-74 cells. Scale bar: 100 μm.
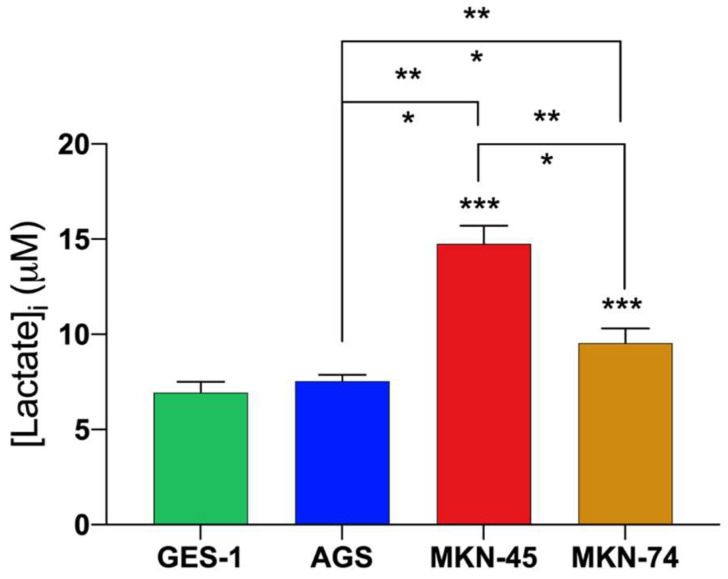
As mentioned above, metastatic tumor cells MKN-45 and MKN-74 can enhance aerobic glycolytic pathways, leading to intracellular lactate accumulation [45,46,47]. This condition is promoted in cancer cells to avoid apoptotic signaling and immune recognition [48,49]. Thus, fluctuations in intracellular pH could be explained, in part, by changes in the intracellular lactate concentration. For this reason, intracellular lactate levels were quantified (Figure 12), finding a significant intracellular lactate increase in the metastatic gastric cancer cell lines MKN-45 and MKN-74 when compared to the non-tumoral gastric cell line GES-1 and the primary gastric adenocarcinoma cell line AGS (p < 0.001). The highest intracellular lactate concentration was found in MKN-45 cells, which corresponds to a poorly differentiated (high-grade) metastatic (advanced-stage) gastric adenocarcinoma cell line. The opposite situation is observed in AGS, a primary gastric adenocarcinoma cell line (early stage and grade), where their intracellular lactate levels are similar to those observed for GES-1. Considering this information, the intense fluorescent signal observed for the MKN-45 and MKN-74 cells can be explained by the increased intracellular lactate levels that increase intracellular pH.
Figure 12.
Intracellular lactate concentrations in GES-1, AGS, MKN-45, and MKN-74 cells. Mean lactate levels in these cell lines were significant when evaluated using one-way ANOVA and Tukey’s multiple comparison test. Data are presented as means ± SD (n = 9). * p < 0.05, ** p < 0.01, *** p < 0.001.
3. Materials and Methods
3.1. Instrumentation
Infrared spectra were recorded using a Jasco FT-IR 4600 instrument (Tokyo, Japan). Recorded range for IR spectra was 400–4000 cm−1, and samples were examined using KBr disks. Raman spectra were obtained using a RAMAN/SNOM Alpha 300 WITec confocal microscope (Grimbergen, Belgium) with a laser line at 785 nm. The recorded range for the RAMAN spectra was 100–1650 cm−1, and samples were examined directly in solid state on the sample holder at room temperature.
3.2. Chemical
The following reagents were all purchased from Sigma-Aldrich/Merck and used without further purification: salicylaldehyde ( reagent grade, 98%), ethylenediamine ( reagent grade, ≥99%), triethylamine ( reagent grade, 99%), anhydrous iron (III) bromide ( reagent grade, ≥99.99%), and anhydrous methanol (reagent grade, 99.8%). In addition, the following salts used for the chemosensor assessment were purchased from Sigma-Aldrich/Merck all of them with reagent grade >99%: NaOH, Na2S2O5, KI, Na2CH3CO2, NaNO3, Na2SO4, Na2S2O3, NaHCO3, NaHSO3, NaIO3, NaCN, NaF, Na2S, Na2CO3, Na3C6H5O7, Na2HPO4, NaH2PO4, NaAsO2, and Na2C4H4O6.
3.3. Synthetic Procedure
3.3.1. Synthesis of 2-(((2-aminoethyl)imino)methyl)phenol (HL1)
The ligand was prepared according to a method described previously [22] by refluxing salicylaldehyde (0.192 mL, 1.83 mmol) and ethylenediamine (0.184 mL, 2.75 mmol) in absolute methanol (20 mL) for 30 min. The resulting yellow solution of HL1 was subsequently used for complex formation. Yield: 60 %. Color: yellow oil. FT-IR ν cm−1: 3430(br) ν(O-H), 2933(m) ν(CH3), 2898(m) ν(αCH2), 2863(α’CH2), 2723(w) ν(O-H···N), 1635(s) ν(C=N).
3.3.2. Synthesis of bis-2-(((2-aminoethyl)imino)methyl)phenol Iron (III) Complex [Fe(L1)2]Br (C1)
The new complex was synthesized at room temperature by using tridentate NNO-donor Schiff HL1 (400 mg, 2.44 mmol) and sodium acetate (200 mg, 2.44 mmol) for 10 min, after adding iron (III) bromide (360 mg, 1.22 mmol) for 1 h. The color of the solution turned dark red and was then filtered. By slow evaporation of the solution at room temperature, dark-red-colored X-ray-quality, rectangular-shaped single crystals were obtained after two weeks. Yield: 50 %. Color: dark-red solid. M.P.: 249 °C. FT-IR ν cm−1: 3200(m)–3100(m) ν(N-H), 2935(m) ν(C-H, alkyl), 1626(s) ν(C=N), 774(s) ν(C-H, aromatic), 606(s) ν(Fe-O), 447(w) ν(Fe-N). RAMAN: 1626(s) ν(C=H), 608(s) ν(Fe-O), 445(w) ν(Fe-N).
3.4. Crystal Structure
An X-ray-suitable crystal for compound C1 was obtained as described above. The single crystal was mounted using MiTeGen MicroMounts. ST1 shows the experimental and crystallographic data for C1. Intensity data were collected at room temperature on a Bruker D8 QUEST diffractometer equipped with a bi-dimensional CMOS Photon100 detector using graphite monochromated Mo-Kα radiation. The diffraction frames were integrated using the APEX3 package and were corrected for absorption with SADABS. The solution and refinement for compound C1 were carried out with Olex2 [50]. The structure was solved by Patterson and refined with the ShelXL refinement package using least-squares minimization [51]. The complete structures were refined using the full-matrix least-squares procedure on the reflection intensities (F2). All non-hydrogens were refined with anisotropic displacement coefficients, and all hydrogen atoms were placed in idealized locations. The bond distances and angles for all compounds studied can be found in ST2. For more detailed information on the crystals, X-ray data collection, and structure solution, please refer to the Supplementary Materials and Appendix A.
3.5. Photophysical Properties
Molecular absorption spectra were obtained on a Shimadzu UV-mini-1240 UV-VIS spectrophotometer (Kyoto, Japan) using 10 mm path length quartz cuvettes in the range of 200–700 nm wavelengths in fast mode. Fluorescence excitation and emission spectra were obtained using a xenon arc lamp as the light source implemented on an ISS K2 Multifrequency Phase Fluorometer (Champaign, IL, USA). Fluorescence spectra were measured at 90° in an L-format using single photon counting mode. Data were acquired and analyzed by VinciTM software Version 2.4, according to our previous reports [24,25,26].
3.6. Computational Approach
Geometric optimizations of compounds C1, OH−, and their proposed intermediates (Int-1 to Int-4) were carried out using the Gaussian 09 program [52], according to a previous report from our research group [37]. In order to obtain different chemical features, DFT-B3LYP-LanL2DZ level calculi were used in the gas phase. Optimized geometries were verified by frequency calculations without imaginary frequency on their potential energy surface. In addition, UV-Vis spectra of C1, C1-OH, and their intermediates (Int-1 to Int-3 and Phen) were calculated using TD-DFT-CAMB3LYP-LanL2DZ with 100 states.
The highest and lowest occupied and unoccupied molecular orbits (HOMO and LUMO, respectively) were plotted using a coarse grid (−2 points). Isovalues for both molecular orbitals were 0.02, and their densities were 0.0004. Electrostatic potential (ESP) was plotted according to total density based on a coarse grid (−2 points).
3.7. Biology
3.7.1. Cell Culture
Cell staining experiments with the C1 compound were performed using four different human gastric cell lines: non-tumoral gastric epithelia (GES-1), primary gastric adenocarcinoma (AGS), and moderately (MKN-74) and poorly (MKN-45) differentiated metastatic adenocarcinoma cell lines. These cells were acquired from ECACC (AGS cell number: 89090402; Porton Down, Salisbury, UK), Riken Cell Bank (MKN-45 cell number: RCB1001, and MKN-74 cell number: RCB1002; Tsukuba, Ibaraki, Japan), and Beyotime Biotechnology (GES-1 cell number: C6268; Shanghai, China). DMEM, F12K, and RPMI 1640 mediums (all from Corning, Corning, NY, USA) were used for GES-1, AGS, and MKN-45 and MKN-75 maintenance, respectively. All media were supplemented with 10% fetal bovine serum (Biological Industries, Beit HaEmek, Israel) and 1% of a 100,000 U/mL penicillin and 100,000 μg/mL streptomycin antibiotic solution (Corning, Corning, NY, USA). Cells were cultured in plastic cell culture dishes and flasks at 37 °C in a humidified atmosphere containing 5% CO2.
3.7.2. Cytotoxic Assay
GES-1, AGS, MKN-74, and MKN-45 cells were seeded in 96-well plates (Corning, Corning, NY, USA) following a 3000 cells/well proportion to achieve 40–50% confluence after an overnight at 37 °C + 5.0% CO2. After cell adhesion, cells were treated with compound C1 using a concentration range from 10 to 200 μM during 2, 4, 8, 24, 48, or 72 h. After incubation, culture medium was replaced with 70 μM Resazurin in a supplemented culture medium solution (Sigma-Aldrich, St. Louis, MO, USA). Fluorescence measurements were performed after a 6 h incubation at 37 °C + 5.0% CO2. Relative Fluorescent Units (RFUs) were measured using a NOVOstar Plate Reader (BMG Labtech, Ortenberg, Germany), considering 570 nm and 590 nm as excitation and emission wavelengths, respectively. Cell proliferation was calculated by comparing each experimental condition with a control condition consisting of cells incubated with supplemented medium without compound C1.
3.7.3. Living Cell Imaging
For these experiments, 10,000 cells/well were seeded in 24-well plates with sterile 12 mm glass coverslips and incubated overnight at 37 °C + 5% CO2. After cell attachment, culture medium was removed from each coverslip preparation, and they were incubated with DMEM/HCO3− pH 7.4 for 1 h at 37 °C + 5% CO2. After treatment, each preparation was washed twice with PBS and then permeabilized with a 0.1% Triton X-100 solution for 5 min at room temperature. Triton X-100 concentration was chosen according to previous reports focused on achieving reversible cell permeabilization without compromising cell membrane integrity [53]. After this step, cells were washed with PBS for 5 min and then incubated with 100 μM compound C1 in DMEM/HCO3− pH 7.4 solution for 1 h at 37 °C + 5% CO2. After treatment, coverslips were washed with PBS and then mounted on slides with 5 μL Fluoromount G (F4680; Sigma-Aldrich, St. Louis, MO, USA). Images were captured using an Eclipse Ts2R-FL inverted fluorescence microscope equipped with a DS-Fi3 camera (Nikon, Tokyo, Japan).
3.7.4. Intracellular Lactate Measurements
Intracellular lactate concentration was measured by seeding 5000 cells/well of each gastric cell line in flat-bottom white opaque 96-well plates (136101; ThermoFisher, Waltham, MA, USA) and incubated overnight at 37 °C + 5% CO2 for cell attachment. The next day, culture medium was replaced, and cells were incubated again for 48 h at 37 °C + 5% CO2. After this incubation, culture medium was removed, and intracellular lactate measurements were performed using the Lactate-Glo Assay kit (J5022; Promega, Madison, WI, USA) following manufacturer’s instructions. To establish intracellular lactate concentrations, lactate standard curves were performed at the same time as sample measurements. Relative Light Unit (RLU) assessments were performed using a NOVOstar Plate Reader (BMG Labtech, Ortenberg, Germany).
4. Conclusions
In the current research, the ligand 2-(((2-aminoethyl)imino)methyl)phenol was synthesized, and, subsequently, the iron (III) complex C1 was prepared. The identification and characterization of compound C1 were conducted using infrared spectroscopy and X-ray diffraction. The iron (III) complex C1 was subjected to different photophysical tests to assess its absorption and emission properties, and we found that compound C1’s fluorescence is turned on by adding NaOH. Through NaOH titration, the stoichiometry relationship between C1 and OH− was established as 1:1, while its limit of detection was 3.97 × 10⁻⁹ M. This recognition of NaOH is irreversible because of the decomposition of the iron (III) complex (C1), obtaining a fluorescent salicylaldehyde phenolate.
On the other hand, the C1 complex was tested as an intracellular pH chemosensor in primary gastric adenocarcinoma cancer cells (AGSs) and compared with a non-tumoral gastric cell line (GES-1), obtaining a null optical response in the AGS cells, a phenomenon explained by their acidic intracellular pH. However, GES-1 cells showed a fluorescent signal consistent with the slightly alkaline physiological conditions. As further projections for using complex C1 as a fluorescent probe for intracellular pH, we tested this compound in the metastatic gastric cancer cell lines MKN-45 and MKN-74, obtaining an important fluorescence turn-on in both cell lines, which could be caused by their increased intracellular pH, as reflected in the increased intracellular lactate levels of these cells when compared to AGS and GES-1 cells. The synthesis of this type of complex, its photophysical characterization and mechanism, and its properties as a viable cellular chemosensor for gastric cancer are reported for the first time. This fluorescent complex has promising properties for being used as a chemosensor for the metabolic profiling of cancer cells.
Acknowledgments
The authors thank the Agencia Nacional de Investigación y Desarrollo (ANID); the Ministry of Science, Technology, Knowledge, and Innovation, Chile; the Vicerrectoría de Investigación y Desarrollo Tecnológico (VRIDT) of the Universidad Católica del Norte; the Dirección de Investigación y Postgrado of the Universidad Central de Chile; as well as the Instituto de Investigación y Postgrado of the Universidad Central de Chile.
Supplementary Materials
The following supporting information can be downloaded at https://www.mdpi.com/article/10.3390/molecules28217237/s1, Figure S1: FT-IR spectra of ligand HL1 and the complex C1; Figure S2: FT-IR and Raman spectra of compound C1; Figure S3: Molecular absorption properties of the iron (III) complex (C1); Figure S4: Spectral and color change in the iron (III) complex after the interaction with several analytes; Figure S5: Kinetic profile of the interaction between the iron (III) complex (C1) and NaOH; Figure S6: Kinetic profile of the interaction between the iron (III) complex (C1) and NaOH in several solvents; Figure S7: Analytical graphs from titration of the iron (III) complex (C1); Figure S8: Electrostatic potential map (ESP) and molecular orbitals of the iron (III) complex (C1) and the hydroxyl anion; Figure S9: Internal energies of the iron (III) complex (C1) and the intermediates proposed in the reaction mechanism; Figure S10: Comparison of colorimetric changes between salicylaldehyde and the iron (III) complex (C1) after the addition of NaOH dissolution; Figure S11: Overlapping experimental UV-Vis spectra and all intermediates proposed in the reaction mechanism; Figure S12: Experimental UV-Vis spectra of complex C1 + OH− and their calculated spectra ; Figure S13: Experimental UV-Vis spectra of complex C1 + OH− and the calculated spectra of proposal intermediate Int-1 together with each electronic transition; Figure S14: Experimental UV-Vis spectra of complex C1 + OH− and the calculated spectra of proposal intermediate Int-2 together with each electronic transition; Figure S15: Experimental UV-Vis spectra of complex C1 + OH− and the calculated spectra of proposal intermediate Int-3 together with each electronic transition; Figure S16: Experimental UV-Vis spectra of complex C1 + OH− and the calculated spectra of proposal intermediate phenolate together with each electronic transition; Table S1: Crystal data and details of structure refinement of complex C1; Table S2: Bond distances and selected angles in the metal coordination sphere of C1 at 170 K; Table S3: Cartesian Coordinates of each atom from iron (III) complex (C1); Table S4: Cartesian Coordinates of each atom from iron (III) complex (C1) with analyte OH−.
Appendix A
CCDC 2225749 contains the supplementary crystallographic data for this paper. These data can be obtained free from The Cambridge Crystallographic Data Centre via www.ccdc.cam.ac.uk/structures accessed on 29 September 2023.
Author Contributions
Conceptualization, N.N. and M.M.; Data curation, N.N., M.R.-J., A.A.C., C.C., V.A., M.F., M.S. and M.M.; Formal analysis, N.N., M.R.-J., A.A.C., C.C., V.A., M.F. and M.M.; Funding acquisition, N.N., C.C., V.A., M.F. and M.M.; Investigation, N.N., M.R.-J., A.A.C., C.C., V.A., M.F. and M.M.; Methodology, N.N., M.R.-J., A.A.C., C.C., V.A., M.F. and M.M.; Project administration, N.N., V.A., M.F. and M.M.; Resources, N.N., C.C., M.F., L.F.A. and M.M.; Software, N.N., A.A.C., C.C., V.A. and M.M.; Supervision, N.N. and M.M.; Validation, A.A.C., C.C., V.A., M.S. and M.M.; Visualization, N.N., M.R.-J., A.A.C., M.S. and M.M.; Writing—original draft, N.N., M.R.-J., A.A.C., C.C., V.A., M.F., L.F.A., M.S. and M.M.; Writing—review and editing, N.N., M.R.-J., A.A.C., C.C., M.S. and M.M. All authors have read and agreed to the published version of the manuscript.
Institutional Review Board Statement
Not applicable.
Informed Consent Statement
Not applicable.
Data Availability Statement
Not applicable.
Conflicts of Interest
The authors declare no conflict of interest.
Sample Availability
Samples of compound C1 are available from the authors.
Funding Statement
This research was funded by the Agencia Nacional de Investigación y Desarrollo (ANID) (by projects Fondequip grant EQM120095; CONICYT grant 21180850 (N.N.); Fondecyt Postdoctorado grant 3200787 (V.A.); Convocatoria Nacional Subvención a Instalación en la Academia Convocatoria año 2021 Folio SA77210078 (M.M.); Becas Chile Scholarship for Doctoral studies 72220004 (M.R.-J.); and Fondecyt Iniciación grant 11220983 (M.S.)); the Vicerrectoría de Investigación y Desarrollo Tecnológico (VRIDT) of the Universidad Católica del Norte (grant VRIDT UCN 20210401007 (C.C.)); and the Ministry of Science, Technology, Knowledge, and Innovation, Chile, by Millennium Scientific Initiative NCN19_038, MiNuSPain (C.C.). The APC was funded by the Instituto de Investigación y Postgrado of the Facultad de Ciencias de la Salud, Universidad Central de Chile.
Footnotes
Disclaimer/Publisher’s Note: The statements, opinions and data contained in all publications are solely those of the individual author(s) and contributor(s) and not of MDPI and/or the editor(s). MDPI and/or the editor(s) disclaim responsibility for any injury to people or property resulting from any ideas, methods, instructions or products referred to in the content.
References
- 1.Flinck M., Kramer S.H., Pedersen S.F. Roles of PH in Control of Cell Proliferation. Acta Physiol. 2018;223:e13068. doi: 10.1111/apha.13068. [DOI] [PubMed] [Google Scholar]
- 2.Jang M., Kim S.S., Lee J. Cancer Cell Metabolism: Implications for Therapeutic Targets. Exp. Mol. Med. 2013;45:e45. doi: 10.1038/emm.2013.85. [DOI] [PMC free article] [PubMed] [Google Scholar]
- 3.Lee S., Shanti A. Effect of Exogenous PH on Cell Growth of Breast Cancer Cells. Int. J. Mol. Sci. 2021;22:9910. doi: 10.3390/ijms22189910. [DOI] [PMC free article] [PubMed] [Google Scholar]
- 4.Warburg O. On Respiratory Impairment in Cancer Cells. Science. 1956;124:269–270. doi: 10.1126/science.124.3215.269. [DOI] [PubMed] [Google Scholar]
- 5.Wang Q., Lv H., Ding F., Jin Z., Liu Y., Sun X., Ye L., Xu W., Mu C., Shen J., et al. Multifunctional Chemosensor for Tracing Ga(III), Hypochlorite and PH Change with Bioimaging in Living Cells, Pseudomonas Aeruginosa and Zebrafish. Sens. Actuator B-Chem. 2021;345:130346. doi: 10.1016/j.snb.2021.130346. [DOI] [Google Scholar]
- 6.Pooja, Pandey H., Aggarwal S., Vats M., Rawat V., Pathak S.R. Coumarin-Based Chemosensors for Metal Ions Detection. Asian J. Org. Chem. 2022;11:e202200455. doi: 10.1002/ajoc.202200455. [DOI] [Google Scholar]
- 7.Fernandes R.S., Shetty N.S., Mahesha P., Gaonkar S.L. A Comprehensive Review on Thiophene Based Chemosensors. J. Fluoresc. 2022;32:19–56. doi: 10.1007/s10895-021-02833-x. [DOI] [PMC free article] [PubMed] [Google Scholar]
- 8.Ren H., Li F., Yu S., Wu P. The Detection of Multiple Analytes by Using Visual Colorimetric and Fluorometric Multimodal Chemosensor Based on the Azo Dye. Heliyon. 2022;8:e10216. doi: 10.1016/j.heliyon.2022.e10216. [DOI] [PMC free article] [PubMed] [Google Scholar]
- 9.Khan S.A., Alam M.Z., Mohasin M., Ahmad S., Salma U., Parveen H., Mukhtar S., Al-Anazi M., Alotaibi F.A., Abdelaziz M.A. Ultrasound-Assisted Synthesis of Chalcone: A Highly Sensitive and Selective Fluorescent Chemosensor for the Detection of Fe3+ in Aqueous Media. J. Fluoresc. 2023 doi: 10.1007/s10895-023-03317-w. online ahead of print . [DOI] [PubMed] [Google Scholar]
- 10.Alam M.Z., Khan S.A.A. A Review on Rhodamine-Based Schiff Base Derivatives: Synthesis and Fluorescent Chemo-Sensors Behaviour for Detection of Fe3+ and Cu2+ Ions. J. Coord. Chem. 2023;76:371–402. doi: 10.1080/00958972.2023.2183852. [DOI] [Google Scholar]
- 11.Wu J., Pan J., Ye Z., Zeng L., Su D. A Smart Fluorescent Probe for Discriminative Detection of Hydrazine and Bisulfite from Different Emission Channels. Sens. Actuator B-Chem. 2018;274:274–284. doi: 10.1016/j.snb.2018.07.161. [DOI] [Google Scholar]
- 12.Luo M., Li Q., Shen P., Hu S., Wang J., Wu Z., Su Z. Coumarin 1,4-Enedione for Selective Detection of Hydrazine in Aqueous Solution and Fluorescence Imaging in Living Cells. Anal. Bioanal. Chem. 2021;413:7541–7548. doi: 10.1007/s00216-021-03719-4. [DOI] [PubMed] [Google Scholar]
- 13.Sultana T., Mahato M., Tohora N., Das A., Datta P., Das S.K. Phthalimide-Based Off-On-Off Fluorosensor for Cascade Detection of Cyanide Ions and Picric Acid. ChemistrySelect. 2023;8:e202204388. doi: 10.1002/slct.202204388. [DOI] [Google Scholar]
- 14.Bouhadir K.H., Elaridi J., Sonji G. Selective and Sensitive Turn on Fluorescence Cyanide Recognition in Aqueous Medium Based on Zn(II)–Hydrazone Metal Complex Chemosensor. Luminescence. 2021;36:1608–1620. doi: 10.1002/bio.4102. [DOI] [PubMed] [Google Scholar]
- 15.Zhang Y., Su J., Li Q., Li W., Liang G., Li H., Ma H., Lin Q., Yao H., Wei T. Novel Fluorescent Chemosensor for Detection of F- Anions Based on a Single Functionalized Pillar[5]Arene Iron(III) Complex. Chin. J. Chem. 2016;34:1263–1267. doi: 10.1002/cjoc.201600588. [DOI] [Google Scholar]
- 16.Deng W.-T., Qu H., Huang Z.-Y. Magnesium(II) Complexes with High Emission: The Distinct Charge-Transfer Process from Transition Metal. Z. Anorg. Allg. Chem. 2018;644:865–868. doi: 10.1002/zaac.201800156. [DOI] [Google Scholar]
- 17.Gul Z., Khan S., Ullah S., Ullah H., Khan M.U., Ullah M., Altaf A.A. Recent Development in Coordination Compounds as a Sensor for Cyanide Ions in Biological and Environmental Segments. Crit. Rev. Anal. Chem. 2022 doi: 10.1080/10408347.2022.2085027. online ahead of print . [DOI] [PubMed] [Google Scholar]
- 18.Mohan N., Sreejith S.S., Begum P.M.S., Kurup M.R.P. A Modern Approach for the Sensing of Aqueous Al(III) Ion by Ni(II) Salen-Type Schiff Base Complexes. Appl. Organomet. Chem. 2019;33:e5064. doi: 10.1002/aoc.5064. [DOI] [Google Scholar]
- 19.Yu J., Zhang H., Tam C.F., Wong W.-L. Synthesis of Pyridyl-Imine Complex of Iron(III) as a Fluorescent Sensor for Hydrazine Detection Based on Redox Chemistry. ChemistrySelect. 2022;7:e202202530. doi: 10.1002/slct.202202530. [DOI] [Google Scholar]
- 20.Kumari N., Huang H., Chao H., Gasser G., Zelder F. A Disassembly Strategy for Imaging Endogenous Pyrophosphate in Mitochondria by Using an FeIII–Salen Complex. ChemBioChem. 2016;17:1211–1215. doi: 10.1002/cbic.201600195. [DOI] [PubMed] [Google Scholar]
- 21.Heinonen J.K. Biological Role of Inorganic Pyrophosphate. Springer Science & Business Media; Berlin/Heidelberg, Germany: 2001. [Google Scholar]
- 22.Demirelli H., Tuemer M., Goelcue A. Synthesis and Characterization of Polydentate Schiff-Base Ligands and Their Complexes. Bull. Chem. Soc. Jpn. 2006;79:867–875. doi: 10.1246/bcsj.79.867. [DOI] [Google Scholar]
- 23.Halcrow M.A. Structure:Function Relationships in Molecular Spin-Crossover Complexes. Chem. Soc. Rev. 2011;40:4119–4142. doi: 10.1039/c1cs15046d. [DOI] [PubMed] [Google Scholar]
- 24.Gonzalez-Vergara A., Sanchez-Gonzalez R., Bravo M.A., Aguilar L.F., Espinoza L., Mellado M. Assessment of Chalcone-Vanillin as a Selective Chemosensor of As(III) in Aqueous Solution. J. Mol. Struct. 2022;1266:133558. doi: 10.1016/j.molstruc.2022.133558. [DOI] [Google Scholar]
- 25.Mellado M., Sariego-Kluge R., Valdes-Navarro F., Sanchez-Gonzalez R., Fuentealba M., Bravo M.A., Aguilar L.F. Synthesis, Crystal Structure, and Photophysical Properties of 4-(4-(Dimethylamino)Phenyl)-6-Phenylpyrimidin-2-Amine. J. Mol. Struct. 2021;1226:129340. doi: 10.1016/j.molstruc.2020.129340. [DOI] [Google Scholar]
- 26.Mellado M., Sariego-Kluge R., Gonzalez C., Diaz K., Aguilar L.F., Bravo M.A. Systematic Study of the Fluorescent Properties of Cinnamaldehyde Phenylhydrazone and Its Interactions with Metals: Synthesis and Photophysical Evaluation. J. Mol. Struct. 2020;1217:128430. doi: 10.1016/j.molstruc.2020.128430. [DOI] [Google Scholar]
- 27.Zawadiak J., Mrzyczek M. Influence of Substituent on UV Absorption and Keto-Enol Tautomerism Equilibrium of Dibenzoylmethane Derivatives. Spectrochim. Acta Part A Mol. Biomol. Spectrosc. 2012;96:815–819. doi: 10.1016/j.saa.2012.07.109. [DOI] [PubMed] [Google Scholar]
- 28.Yang W., Cheng Z., Xu Y., Shao J., Zhou W., Xie J., Li M. A Highly Selective Fluorescent Chemosensor for Cyanide Anions Based on a Chalcone Derivative in the Presence of Iron(III) Ions, and Its Capacity for Living Cell Imaging in Mixed Aqueous Systems. New J. Chem. 2015;39:7488–7494. doi: 10.1039/C5NJ01043H. [DOI] [Google Scholar]
- 29.Mellado M., Roldan N., Miranda R., Aguilar L.F., Bravo M.A., Quiroz W. Sensitive Fluorescent Chemosensor for Hg(II) in Aqueous Solution Using 4’-Dimethylaminochalcone. J. Fluoresc. 2022;32:1449–1456. doi: 10.1007/s10895-022-02941-2. [DOI] [PubMed] [Google Scholar]
- 30.Wang Y., Gwon S.-Y., Wang S., Kim S.-H. The Synthesis and Spectral Properties of a Stimuli-Responsive D-Pi-A Charge Transfer Dye Based on Indole Donor and Dicyanomethylene Acceptor Moiety. Spectrochim. Acta Part A Mol. Biomol. Spectrosc. 2012;86:294–298. doi: 10.1016/j.saa.2011.10.039. [DOI] [PubMed] [Google Scholar]
- 31.Khattab T.A., Rehan M., Aly S.A., Hamouda T., Haggag K.M., Klapoetke T.M. Fabrication of PAN-TCF-Hydrazone Nanofibers by Solution Blowing Spinning Technique: Naked-Eye Colorimetric Sensor. J. Environ. Chem. Eng. 2017;5:2515–2523. doi: 10.1016/j.jece.2017.05.001. [DOI] [Google Scholar]
- 32.Son Y.-A., Gwon S.-Y., Kim S.-H. Chromene and Imidazole Based D-Pi-A Chemosensor Preparation and Its Anion Responsive Effects. Mol. Cryst. Liquid Cryst. 2014;599:16–22. doi: 10.1080/15421406.2014.935913. [DOI] [Google Scholar]
- 33.Uahengo V., Naimhwaka J., Daniel L.S., Rahman A., Elzagheid M.I., Rhyman L., Ramasami P., Cai P. A Colorimetric Probe for the Real-Time Naked Eye Detection of Cyanide and Hydroxide Ions in Tap Water: Experimental and Theoretical Studies. Analyst. 2019;144:6422–6431. doi: 10.1039/C9AN01481K. [DOI] [PubMed] [Google Scholar]
- 34.Sharma P.R., Soni V.K., Pandey S., Choudhary G., Plappally A.K., Sharma R.K. Dipicrylhydrazine: A Versatile Visual Anions Sensor. J. Environ. Chem. Eng. 2017;5:2232–2239. doi: 10.1016/j.jece.2017.04.048. [DOI] [Google Scholar]
- 35.Wang Y., Tang B., Zhang S. A Visible Colorimetric PH Sensitive Chemosensor Based on Azo Dye of Benzophenone. Dyes Pigment. 2011;91:294–297. doi: 10.1016/j.dyepig.2011.03.003. [DOI] [Google Scholar]
- 36.Chen H., Luo J., Chen S., Qi Y., Zhou T., Tian X., Ding F. Sensing Hypochlorite or PH Variations in Live Cells and Zebrafish with a Novel Dual-Functional Ratiometric and Colorimetric Chemosensor. Spectrochim. Acta Part A Mol. Biomol. Spectrosc. 2022;271:120915. doi: 10.1016/j.saa.2022.120915. [DOI] [PubMed] [Google Scholar]
- 37.Mellado M., Sariego-Kluge R., Valdés-Navarro F., González C., Sánchez-González R., Pizarro N., Villena J., Jara-Gutierrez C., Cordova C., Bravo M.A., et al. Synthesis of Fluorescent Chalcones, Photophysical Properties, Quantitative Structure-Activity Relationship and Their Biological Application. Spectrochim. Acta Part A Mol. Biomol. Spectrosc. 2023;291:122332. doi: 10.1016/j.saa.2023.122332. [DOI] [PubMed] [Google Scholar]
- 38.Hou H., Zhao Y., Li C., Wang M., Xu X., Jin Y. Single-Cell PH Imaging and Detection for PH Profiling and Label-Free Rapid Identification of Cancer-Cells. Sci. Rep. 2017;7:1759. doi: 10.1038/s41598-017-01956-1. [DOI] [PMC free article] [PubMed] [Google Scholar]
- 39.Haldar U., Chaudhury S.S., Sharma R., Ruidas B., Patra S.G., Das Mukhopadhyay C., Lee H. A Fluorimetric Water-Soluble Polymeric PH Chemosensor for Extremely Acidic Conditions: Live-Cell and Bacterial Imaging Application. Sens. Actuator B-Chem. 2020;320:128379. doi: 10.1016/j.snb.2020.128379. [DOI] [Google Scholar]
- 40.Gharami S., Aich K., Ghosh P., Patra L., Murmu N., Mondal T.K. A Simple Coumarin Based “Fluorescent On” Probe for the Selective Detection of Al3+ along with Its Application in Live Cell Imaging via AGS Cell Line. J. Photochem. Photobiol. A-Chem. 2020;390:112294. doi: 10.1016/j.jphotochem.2019.112294. [DOI] [Google Scholar]
- 41.Nagata H., Che X.-F., Miyazawa K., Tomoda A., Konishi M., Ubukata H., Tabuchi T. Rapid Decrease of Intracellular PH Associated with Inhibition of Na+/H+ Exchanger Precedes Apoptotic Events in the MNK45 and MNK74 Gastric Cancer Cell Lines Treated with 2-Aminophenoxazine-3-One. Oncol. Rep. 2011;25:341–346. doi: 10.3892/or.2010.1082. [DOI] [PubMed] [Google Scholar]
- 42.Kim S.Y., Podder A., Lee H., Cho Y.-J., Han E.H., Khatun S., Sessler J.L., Hong K.S., Bhuniya S. Self-Assembled Amphiphilic Fluorescent Probe: Detecting PH-Fluctuations within Cancer Cells and Tumour Tissues. Chem. Sci. 2020;11:9875–9883. doi: 10.1039/D0SC03795H. [DOI] [PMC free article] [PubMed] [Google Scholar]
- 43.Yeo M., Kim D.K., Kim Y.B., Oh T.Y., Lee J.E., Cho S.W., Kim H.C., Hahm K.B. Selective Induction of Apoptosis with Proton Pump Inhibitor in Gastric Cancer Cells. Clin. Cancer Res. 2004;10:8687–8696. doi: 10.1158/1078-0432.CCR-04-1065. [DOI] [PubMed] [Google Scholar]
- 44.Hong R., Han S.I. Extracellular Acidity Enhances Tumor Necrosis Factor-Related Apoptosis-Inducing Ligand (TRAIL)-Mediated Apoptosis via DR5 in Gastric Cancer Cells. Korean J. Physiol. Pharmacol. 2018;22:513–523. doi: 10.4196/kjpp.2018.22.5.513. [DOI] [PMC free article] [PubMed] [Google Scholar]
- 45.Ngo D.C., Ververis K., Tortorella S.M., Karagiannis T.C. Introduction to the Molecular Basis of Cancer Metabolism and the Warburg Effect. Mol. Biol. Rep. 2015;42:819–823. doi: 10.1007/s11033-015-3857-y. [DOI] [PubMed] [Google Scholar]
- 46.Heiden M.G.V., Cantley L.C., Thompson C.B. Understanding the Warburg Effect: The Metabolic Requirements of Cell Proliferation. Science. 2009;324:1029–1033. doi: 10.1126/science.1160809. [DOI] [PMC free article] [PubMed] [Google Scholar]
- 47.Yuan L.-W., Yamashita H., Seto Y. Glucose Metabolism in Gastric Cancer: The Cutting-Edge. World J. Gastroenterol. 2016;22:2046–2059. doi: 10.3748/wjg.v22.i6.2046. [DOI] [PMC free article] [PubMed] [Google Scholar]
- 48.Hanahan D. Hallmarks of Cancer: New Dimensions. Cancer Discov. 2022;12:31–46. doi: 10.1158/2159-8290.CD-21-1059. [DOI] [PubMed] [Google Scholar]
- 49.Harguindey S., Arranz J.L., Orozco J.D.P., Rauch C., Fais S., Cardone R.A., Reshkin S.J. Cariporide and Other New and Powerful NHE1 Inhibitors as Potentially Selective Anticancer Drugs—An Integral Molecular/Biochemical/Metabolic/Clinical Approach after One Hundred Years of Cancer Research. J. Transl. Med. 2013;11:282. doi: 10.1186/1479-5876-11-282. [DOI] [PMC free article] [PubMed] [Google Scholar]
- 50.Dolomanov O.V., Bourhis L.J., Gildea R.J., Howard J.A.K., Puschmann H. OLEX2: A Complete Structure Solution, Refinement and Analysis Program. J. Appl. Crystallogr. 2009;42:339–341. doi: 10.1107/S0021889808042726. [DOI] [Google Scholar]
- 51.Sheldrick G.M. A Short History of SHELX. Acta Crystallogr. Sect. A. 2008;64:112–122. doi: 10.1107/S0108767307043930. [DOI] [PubMed] [Google Scholar]
- 52.Frisch M.J., Trucks G.W., Schlegel H.B., Scuseria G.E., Robb M.A., Cheeseman J.R., Scalmani G., Barone V., Petersson G.A., Nakatsuji H., et al. Gaussian 09, Revision A.02 2016. ScienceOpen, Inc.; Boston, MA, USA: 2009. [Google Scholar]
- 53.Koley D., Bard A.J. Triton X-100 Concentration Effects on Membrane Permeability of a Single HeLa Cell by Scanning Electrochemical Microscopy (SECM) Proc. Natl. Acad. Sci. USA. 2010;107:16783–16787. doi: 10.1073/pnas.1011614107. [DOI] [PMC free article] [PubMed] [Google Scholar]
Associated Data
This section collects any data citations, data availability statements, or supplementary materials included in this article.
Supplementary Materials
Data Availability Statement
Not applicable.


