Abstract
Ammonia (NH3) is widely used in various fields, and it is also considered a promising carbon free energy carrier, due to its high hydrogen content. The nitrogen reduction reaction (NRR), which converts nitrogen into ammonia by using protons from water as the hydrogen source, is receiving a lot of attention, since effective process optimization would make it possible to overcome the Haber–Bosch method. In this study, we used a solution-based approach to obtain functionalized porous Ni foam substrates with a small amount of gold (<0.1 mg cm−1). We investigated several deposition conditions and obtained different morphologies. The electrochemical performance of various catalysts on the hydrogen evolution reaction (HER) and NRR has been characterized. The ammonia production yield was determined by chronoamperometry experiments at several potentials, and the results showed a maximum ammonia yield rate of 20 µg h−1 mgcat−1 and a Faradaic efficiency of 5.22%. This study demonstrates the potential of gold-based catalysts for sustainable ammonia production and highlights the importance of optimizing deposition conditions to improve the selectivity toward HER.
Keywords: nitrogen electroreduction, catalysts, gold nanoparticles, ammonia synthesis
1. Introduction
Nitrogen is one of the most abundant elements, and it is present in the environment in a wide variety of chemical forms, including inorganic nitrogen gas (N2), ammonia (NH3) and ammonium (NH4+), nitrite (NO2−), nitrate (NO3−), nitrous oxide (N2O), nitric oxide (NO) and organic nitrogen [1,2,3]. The processes in the global nitrogen cycle transform nitrogen from one form to another. In particular, the biological nitrogen fixation process converts atmospheric dinitrogen gas (N2) into ammonia through nitrogenase proteins. This process of nitrogen reduction is essential for life, since fixed inorganic nitrogen compounds are required for the biosynthesis of all organic compounds containing nitrogen, such as amino acids and proteins, and it is crucial for agriculture [4]. Ammonia is also relevant, as a key precursor for the manufacturing of many nitrogen compounds, including dyes, explosives, resins, etc. Currently, ammonia is industrially produced by the Haber–Bosch process from N2 and H2 feeding gases and an Fe-based catalyst. However, because of the high bonding energy of N≡N (940.95 kJ mol−1), it requires a high temperature (350–550 °C) and pressure (150–350 atm) to break the triple bond of nitrogen molecules [5]. This results in a highly polluting process which accounts for 1–2% of global carbon dioxide emissions [6,7]. Consequently, there is a significant need for eco-friendly alternative methods of producing NH3, and electrochemical nitrogen reduction using aqueous electrolytes is considered an interesting approach since it can be powered by renewable electricity inputs [8]. This electrochemical approach would enable on-site distributed ammonia production, supplanting centralized manufacturing, and therefore contributing to decarbonization [9]. Moreover, ammonia is also a very promising and versatile energy vector, which could be used to mitigate the intrinsic fluctuations of renewable energy sources. Unlike hydrogen, ammonia can be easily liquified, which has clear advantages for storage and transportation [10,11]. However, the development of the electrochemical nitrogen reduction reaction (NRR) has been hindered by the lack of effective electrocatalysts that can produce NH3 with a high yield and faradaic efficiency (FE) [12,13,14,15,16,17].
In general, nanostructured noble metal materials (Au, Ag, Ru, Ir, etc.) [18,19] are very promising in the field of catalysis, since they possess good conductivity and a lot of surface active sites. It has been speculated that their catalytic activity for nitrogen electroreduction originates from the interaction between their d orbitals and the lone pair electrons of N2, resulting in a weakening of its triple bond [20]. Among noble metals, gold is a promising candidate for green ammonia generation, and it has been proved that NRR on Au surfaces is an associative mechanism, with the hydrogenation and the breaking of the triple bonds of N atoms occurring simultaneously [5,21,22,23,24]. Indeed, when the N2 triple bond is broken, the Au electronic structure allows hydrogenation and offers a lower energy barrier for the formation and stabilization of N2H2* intermediates on the catalyst surface [25,26].
The catalytic performance can be improved by the use of porous and/or multifaceted Au surfaces, that ensure the improvement of active sites on the catalyst [27]. Usually, mesoporous precious metals are produced through dealloying or through template-based methods or block copolymer micelles [28,29,30], sometimes with poor control over pores size. In addition, the synthetized materials need to be fixed on the substrate by binders, resulting in the degradation of electrocatalytic performance and/or the introduction of false positives in ammonia quantification procedures [31,32].
In this paper we adopted electroless deposition [33,34,35], based on spontaneous galvanic displacement, to cover the porous substrates of Ni foam with a multifaceted layer made of interconnected gold nanoparticles, avoiding the use of any binder or polymer. The effect of the catalyst’s morphology and coverage on the electrochemical synthesis of ammonia is studied. The catalyst’s morphology is found to be relevant in determining its ability to reduce nitrogen.
2. Materials and Methods
2.1. Gold Electroless Deposition on Nickel Foam
The nickel foam electrodes with a thickness of 1.6 mm with a porosity of 95% and 20 pores per linear cm were purchased from Sigma-Aldrich (Milan, Italy). Before the deposition, each sample (1 × 1 cm2) was pretreated in acetone (CH3COCH3, Carlo Erba Reagents, Milan, Italy) at 60 °C with sonication and then in a 0.01 M HCl (HCl 37%, Carlo Erba Reagents, Milan, Italy) solution at 60 °C for 30 min, to carry off the native oxide. After cleaning, the Ni foam substrate was placed into a solution containing 1 mM KAuCl4 (99.995% trace metal, Sigma-Aldrich, Milan, Italy) and 0.01 M HCl, at room temperature and under ambient light. The initial color of the solution was yellow, but gradually shifted from light yellow to colorless, indicating a reduction in the concentration of AuCl4− ion species. The spontaneous reaction between AuCl4− and the Ni substrate, which allows the deposition of gold on nickel, is (1):
| (1) |
As nickel has a much lower electrochemical potential than gold (−0.25 V vs. +1.00 V), the Au deposition on Ni occurs spontaneously [36]. The reaction takes place through the oxidation of the conductive substrate at an open-circuit potential, wherein Au ions are reduced and deposited in a metallic state and Ni2+ ions are dissolved in the HCl solution. Some depositions (indicated in the following as sample A and B) were performed by stirring the solution at 600 rpm and by adding isopropyl alcohol (C3H8O, IPA, Carlo Erba Reagents, Milan, Italy) at a concentration of 5%, since with these conditions it is possible to obtain uniform coverage on both the outer and inner regions of the porous Ni foam [37]. With the aim of studying the effect of time on the deposition, we prepared samples A and B through immersion in the deposition solution for 30 s and 120 s, respectively. To study the effect of prolonged deposition time, another sample (C) was prepared, in the same way as sample B, for 120 s with IPA and stirring (to ensure uniform coverage), and then immersed again for 1800 s without IPA and stirring, to promote diffusion-limited growth. After deposition, all the samples were abundantly rinsed in deionized water and dried in air.
2.2. Characterization
The morphology of the catalyst was investigated by scanning electron microscopy (SEM), using a ZEISS FE-SEM SUPRA 35 (Carl Zeiss AG, Jena, Germany) equipped with an Energy Dispersive X-ray (EDX) microanalysis system (X-MAX, 80 mm2 by Oxford Instruments, Abingdon, UK).
The electrochemical characterization was performed in a dual chamber H-cell, filled with a 0.1 M Na2SO4 solution. The cathodic and the anodic compartments were separated by a ZIRFON PERL membrane (AGFA), since it has been shown that it can avoid contaminations and artifacts that occur with the use of a proton exchange membrane [38]. A Pt wire has been employed as a counter electrode (CE) and a saturated calomel electrode (SCE, saturated KCl), as reference.
Cyclic voltammetry (CV) and chronoamperometry (CA) measurements were performed using a Keithley 2600-Source Current Unit. The catalyst activity of the samples was analyzed by linear sweep voltammetry (LSV) in a quasi-steady-state condition, to avoid distortions generated by charging effects, with a scan rate of 0.4 mV s−1 [39]. We adopted a potential range between 0 V and −0.55 V vs. RHE. Electrochemical impedance spectroscopy (EIS) measurements were performed using an Ivium Vertex5A (Ivium Technologies B.V., Eindhoven, The Netherlands) potentiostat with a frequency range from 1 Hz to 1 MHz, by applying a 50 mV small signal amplitude and 0 V bias vs. RHE.
The following equation is used for the conversion from SCE to reversible hydrogen electrode (RHE):
| E (vs. RHE) = E (vs. SCE) + 0.243 + 0.059 × pH | (2) |
2.3. Electrochemical Ammonia Synthesis
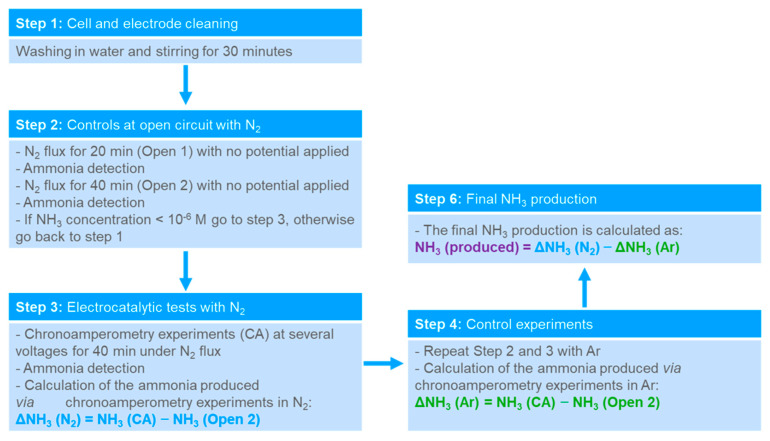
Ammonia was produced during chronoamperometry measurements at a constant potential while fluxing N2 gas, with a flow rate of 10 mL min−1. To avoid external contaminations, a rigorous protocol was adopted [40], as described in Figure 1, including: the washing of the electrodes and cell in water at 35 °C before chronoamperometry measurements; adopting high purity N2 and Ar gases (Nippon Gases, Tokyo, Japan, 99.9999% with <0.5 ppm of oxygen); and gas washing in two acidic saturators (10 mM H2SO4) and water, for further purification before entering the electrochemical cell.
Figure 1.
Schematic illustration of the experimental protocol for the electrochemical ammonia synthesis.
The amount of ammonia in the electrolyte was measured before the experiments (see Figure S7). Then, the cathode and the anode compartments were filled, respectively, with 22 mL and 8 mL of electrolyte, and the amount of ammonia in the solution was measured again after 20 min (Open1) and 40 min (Open2), at open circuit under N2 (or Ar) flow, to check the ammonia concentration in the cell. If the concentration of NH3 exceeded 10−6 M and/or changed over time, the cell was emptied and rinsed again. This method enabled a thorough examination of any internal system contaminations, such as ammonia that was already present in the electrode or in the cell.
The amount of ammonia measured at the open circuit (Open2) was subtracted from the amount measured after the chronoamperometry experiments (CA) with external potential applied, to obtain the net ammonia amount, ΔNH3. Ammonia was quantified in both cathodic and anodic compartments but no NH3 was detected at the anode. Moreover, an acidic trap was placed at the cathode gas outlet; however, no relevant amount of NH3 was detected in this trap after chronoamperometry. As proposed in the literature [41,42], Ar-saturated control experiments were executed at the same bias. In order to eliminate possible contributions from the water other than N2, such as nitrates and nitrites, the ammonia produced under an Ar-saturated atmosphere was subtracted from the net amount of ammonia produced in N2 at the same conditions, to obtain the Ar-corrected produced NH3.
2.4. Ammonia Detection
Sodium hydroxide (NaOH, Thermo Fisher Scientific, Monza, Italy), trisodium citrate dihydrate (Na3C6H5O7·2H2O, Alfa Aesar, Ward Hill, MA, USA, ≥99.0%), salicylic acid (C7H6O3, Alfa Aesar, 99%), sodium pentacyanonitrosylferrate (III) dihydrate (Na2[(Fe(CN)5NO]·2H2O, Alfa Aesar, 98%), ammonium chloride (NH4Cl granular, Alfa Aesar, 99.5%) and sodium hypochlorite solution (NaClO, Alfa Aesar, 11–15%) were used to measure the ammonia in the electrolyte using the indophenol blue method, as described by [43,44], with minor adjustments. For this method, 1 mL of the sample was mixed with 1 mL of a solution made up of 1 M NaOH, 5%wt sodium citrate and 5%wt salicylic acid. Then, 0.5 mL of a 0.05 M NaClO solution and 0.3 mL of a 0.1% sodium nitroferricyanide solution were added to the mixture. The solution was incubated in the dark for 30 min to avoid Fe-catalyzed photodegradation. A UV-vis spectrophotometer (Cary 5000 UV-Vis-NIR, Agilent, Santa Clara, CA, USA) was used to measure the solution’s absorbance, at a wavelength of 655 nm.
A calibration curve was plotted, to quantify the amount of NH3 produced using standard ammonia chloride solutions ranging from 0.15 to 0.015 μg mL−1 in Na2SO4 electrolyte solution. Figure S1 shows the typical absorption spectra of standard ammonia solutions and the corresponding calibration curve.
3. Results and Discussion
3.1. Morphological Characterization
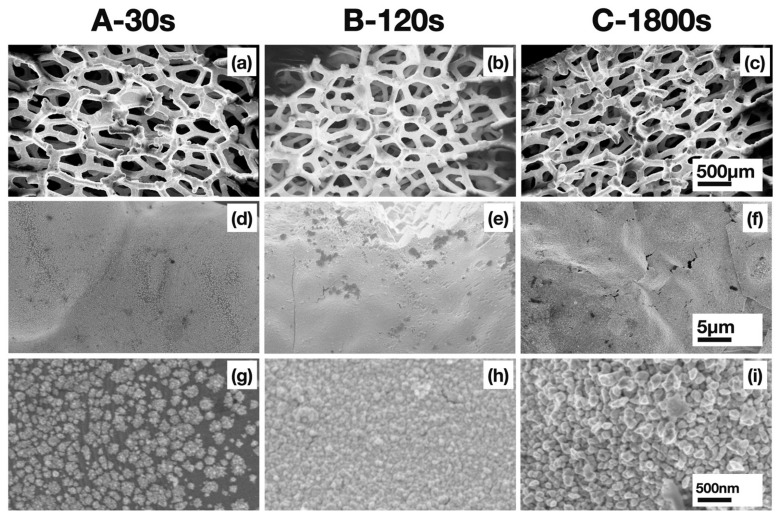
Figure 2 shows the SEM images at different magnifications of the samples A, B and C. The different preparation conditions gave rise to different morphologies. After 30 s with IPA and stirring (sample A) the coverage of the substrate surface was not uniform, leaving areas with exposed nickel. The Au nanoparticles were also analyzed by high resolution transmission electron microscopy, as shown in Figure S2. By increasing the deposition time up to 120 s (sample B), complete surface coverage was achieved. For sample C, deposited for a further 1800 s without IPA and stirring, after the same preparation method as sample B, the increased time did not result in a relevant increase in gold thickness but, rather, in higher roughness, as also confirmed by the cross section SEM images showing a 100 nm and a 110 nm thick gold film for samples B and C, respectively (Figure S3). The film thickness was converted into loading, by adopting a procedure previously reported [37]. The measured Au loading in sample B and C is 0.08 and 0.09 mg cm−2, respectively.
Figure 2.
SEM images at different magnifications of Au nanoparticles deposited on Ni foam, obtained for samples A (a,d,g), B (b,e,h) and C (c,f,i).
Moreover, the inside and outside of the nickel foam after deposition shared the same morphology. This is because stirring and isopropyl alcohol promote the diffusion of AuCl4− ions within the nickel foam, ensuring good deposition conformity, as shown in the SEM images in Figure S4. In particular, for sample C it was possible to achieve a robust gold film, even in the inner part of the Ni foam.
3.2. Electrochemical Characterization
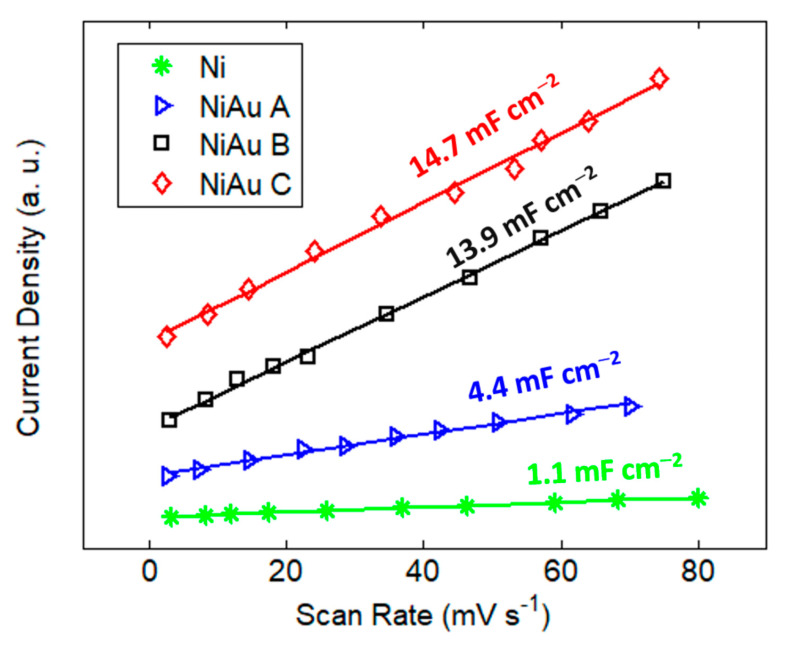
For the electrochemical evaluation of the catalysts, a series of CV scans was acquired at different rates in a non-Faradaic region. From these scans, we determined the specific capacitance, which is directly related to the electrochemical active surface area (EASA), by analyzing the slope of the linear regression between the current density differences (cathodic and anodic) in the middle of the potential window of CV curves versus the scan rates. The data shown in Figure 3 reveal that the electrode C had the highest specific capacitance (14.7 mF cm−2). This result suggests that the higher roughness of sample C was effective in improving the active sites. The lowest catalytically active surface area was associated with electrode A, exhibiting the lowest capacitance (4.4 mF cm−2), due to the non-optimal gold coating of the nickel foam, but this was still higher than that of the bare Ni foam.
Figure 3.
Double layer capacitance calculated from cyclic voltammetry in 0.1 M Na2SO4 for the Ni foam electrodes loaded with Au catalyst.
These results were also confirmed by EIS (Figure S5 and Table S1), with the highest double layer capacitance obtained for sample C, and a decrease in the charge transfer resistance as the amount of gold increased.
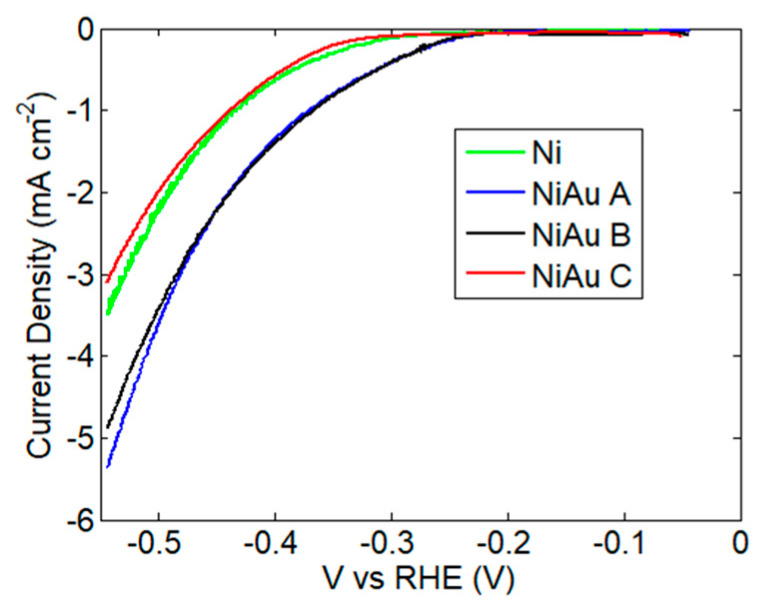
Figure 4 shows the comparison between the linear sweep voltammetry (LSV), obtained with catalysts prepared in different conditions. The comparison between LSV curves acquired under Ar and N2 flux is shown in Figure S6. A higher current was obtained under N2 flux, in a region between −0.1 V and −0.3 V vs. RHE. For a potential more negative than −0.3 V vs. RHE, the hydrogen evolution reaction was dominant. The overpotential for HER, taken at 3 mA cm−2, was 545 mV for sample C, with a slight decrease to 528 mV for the bare Ni foam. Samples A and B exhibited higher activity in the hydrogen evolution reaction, with an overpotential of 487 mV and 482 mV, respectively.
Figure 4.
Linear sweep voltammetry in 0.1 M Na2SO4 with a scan rate of 0.4 mV s−1, on bare Ni foam and for electrodes loaded with Au, adopting different deposition conditions.
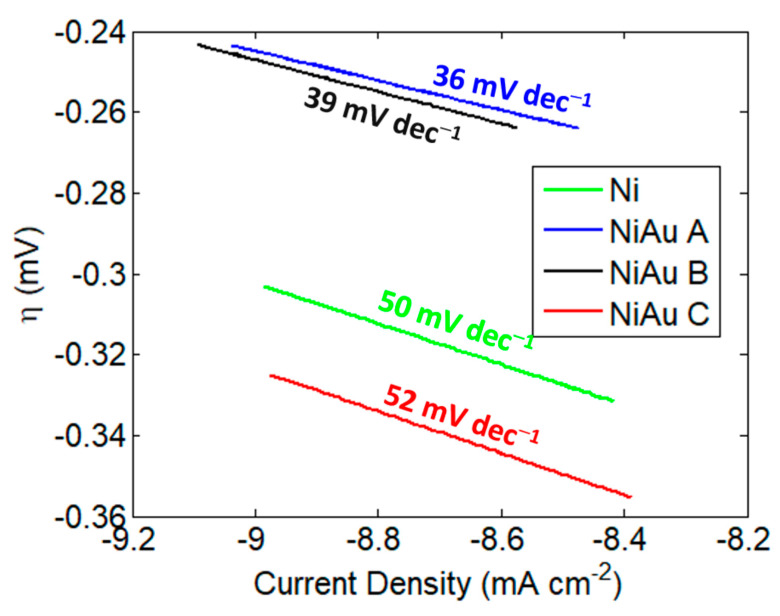
Since the competition with HER is one of the key issues for ammonia synthesis in water, we studied the electrocatalytic activity for HER using the Tafel plot method. On a single electrode, for a cathodic reaction, the Tafel equation can be stated as:
| η = A log10 (I/I0) | (3) |
where η is the overpotential, A is the Tafel slope, I is the current density and I0 is the current at equilibrium.
In general, the Tafel analysis utilizes the sensitivity of the electric current response to the applied potential (Tafel slope) to obtain information about the rate determining steps. However, the Tafel slope depends not only on the reaction mechanism and on the intrinsic activity of the material toward the process, but also on its three-dimensional structure, including porosity and roughness [45]. In the case of multi-component electrodes, Tafel polarization plots are difficult to analyze, because the same reaction can occur at different rates at different components and can also have different reaction mechanisms. For these reasons, since HER may occur simultaneously on Au and Ni, in this paper, the Tafel plots are used to perform comparative analysis of the activity of Ni foam and of Ni foam functionalized with Au nanostructures with a different morphology and surface coating. The HER is generally described as having three steps: the Volmer step, the Heyrovsky step and the Tafel step. In the Volmer step, a water molecule attacks the catalyst surface and then dissociates, leaving an adsorbed hydrogen atom and a hydroxyl group. In the Heyrovsky step, another water molecule attacks the adsorbed hydrogen and forms a hydrogen molecule and one more hydroxyl group. The H2 desorption occurs in both the Tafel and Heyrovsky steps. As is widely accepted, Tafel slopes of 120, 40 and 30 mV dec−1 have been observed for the Volmer, Heyrovsky and Tafel determining rate steps, respectively [46].
Figure 5 shows the Tafel slopes obtained for the studied electrodes. The bare Ni foam exhibited a slope of 50 mV dec−1. This value decreased to 36 and 40 mV dec−1 in samples A and B, respectively. Generally, according to the volcano plot for HER, the Au electrodes exhibit low binding energy and high instability in the H-Au bond (Volmer step), resulting in high overpotential for the HER. Previous DFT calculations [47] have revealed that the binding energy of H-Au on AuNi was more significant than that on Au, because the Au atom adjacent to the Ni atom promotes the Volmer step and enhances HER activity, as confirmed by our experimental decrease in the Tafel plot, observed for samples A and B. In sample C, instead, the Tafel slope is higher and comparable to the bare Ni foam, indicating that, in this sample, the rate for hydrogen evolution is lower. On the basis of this observation, sample C is expected to be the most suitable for nitrogen reduction.
Figure 5.
Tafel plot acquired in a quasi-steady-state condition by applying a sweeping rate of 0.4 mV s−1 in 0.1 M Na2SO4.
3.3. Electrochemical Synthesis of Ammonia
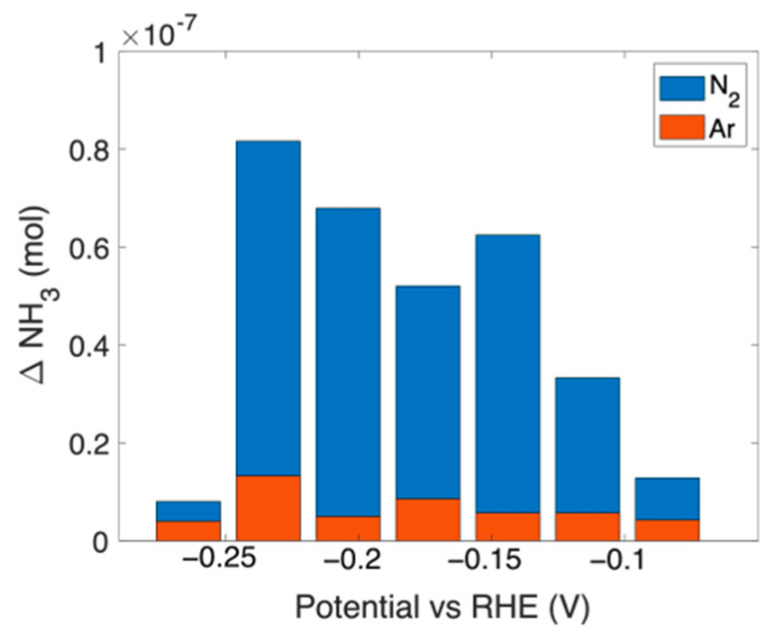
Figure 6 shows the net amount of ammonia (ΔNH3) produced by 1 cm2 of sample C during chronoamperometry at different potentials for 2400 s under N2 or Ar flux. Each value reported in Figure 6 is the difference between the ammonia measured after chronoamperometry (CA) and before, at open circuit (Open2). The values measured after each step (Open and CA) at different potentials are shown in Figure S7. Figure S8 shows the UV–Vis spectra after chronoamperometry at −0.23 V vs. RHE, under N2 or Ar flux, compared with open and electrolyte.
Figure 6.
Ammonia moles measured for sample C after chronoamperometry for 2400 s under N2 or Ar flux. The amount of moles was subtracted from those measured before the chronoamperometry (open circuit).
From Figure 6 it can be seen that a low amount of ammonia (less than 1 × 10⁻⁸ moles) is produced, even by performing the experiment under Ar flux. This production can be ascribed to the reduction, to ammonia, of NOx− present in the deionized water (see Figure S9).
Therefore, the amount of ammonia produced by the catalyst was calculated as:
| NH3 (produced) = ΔNH3 (N2) − ΔNH3 (Ar) | (4) |
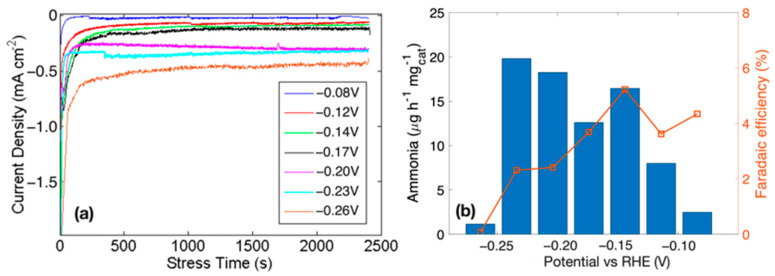
Figure 7a shows the chronoamperometry at different potentials. Figure 7b reports the ammonia production rate on the left axis and the faradaic efficiency on the right axis. The maximum NH3 yield rate is at −0.23 V vs. RHE with 20 µg h−1 mg−1cat, and the highest Faradaic efficiency of 5.22% is obtained at −0.14 V vs. RHE. The decrease in efficiency observed at more negative potential, is due to the competition of the HER with the NRR.
Figure 7.
NRR measurements for Ni foam Au 30 min electrode in 0.1 M Na2SO4: (a) chronoamperometry results under N2 flux and (b) NH3 production rate and Faradaic efficiency at different potentials. The ammonia rate and efficiencies are Ar-subtracted (see Figure 6).
In order to verify the better performance for sample C, characterized by a higher active area and a higher Tafel slope for HER, we have performed the same characterization under NRR, using sample B. The results are shown in Figure S10. The highest rate and efficiency values are comparable, but in the case of sample B, the rate drastically decreases for potentials more negative than −0.15 V vs. RHE, confirming that the competition with HER plays a relevant role, therefore confirming the validity of the approach proposed for the screening of catalysts as more promising for NRR.
4. Conclusions
In summary, this study demonstrated successful gold electroless deposition, based on spontaneous galvanic displacement, on porous Nickel foam.
The deposition time significantly impacted the catalyst morphology and coverage. SEM analysis revealed that longer deposition times resulted in a good deposition uniformity and in a higher roughness of the gold film, without a substantial increase in thickness. y. The electrochemical characterization indicates that the electrode with the highest roughness exhibits the highest active surface area. Tafel slope analyses indicated a poorer performance for HER, leading to a better performance for NRR.
Acknowledgments
The authors acknowledge Gugliemo Guido Condorelli for fruitful discussions and Sebania Libertino for support with NOx analysis.
Supplementary Materials
The following supporting information can be downloaded at: https://www.mdpi.com/article/10.3390/nano13212850/s1, Figure S1: (a) UV-Vis absorbance spectra for the indophenol method with various ammonia concentrations and (b) the corresponding calibration curve; Figure S2: High Resolution Transmission Electron Micrograph of Au nanoparticles deposited for 30 s in sample A; Figure S3: Cross Section SEM images of Au deposited on Ni Foam obtained for samples B and C. The cross section has been prepared by cutting the foam and acquiring the micrographs in a region with the delaminated Au film. The thickness is 100 nm for sample B and 110 nm for sample C; Figure S4: SEM images of the outer (out) and inner (inn) regions of Ni Foam, as indicated in the inset and after the gold deposition for sample A and for sample B; Figure S5: Electrochemical impedance spectra of gold electrodes acquired in 0.1 M Na2SO4, at 0 V bias with a small signal 50 mV in amplitude; Figure S6: Linear Sweep Voltammetry obtained with sample A, B and C, respectively, scanning the potential from +0 to −0.55 V vs. RHE under Ar (black line) and N2 (red line) flux in 0.1 M Na2SO4; Figure S7: Ammonia moles measured for sample C after (labeled as CA) and before (Open2) chronoamperometry for 2400 s under N2 and Ar flux; Figure S8: UV-Vis absorbance spectra for the electrolyte, before (Open 1, after 10 min and Open2, after 40 min respectively under gas flow and with no voltage applied) and after the chronoamperometry experiments in argon and nitrogen flux at −0.23 V vs. RHE [48]; Figure S9: NOx calibration by HCl with UV spectrometry absorbance spectra and calibration curve; Figure S10: Ammonia moles measured for sample B after (labeled as CA) and before (Open2) chronoamperometry for 2400 s under N2 flux and NH3 production rate and Faradaic Efficiency at different potentials. Table S1. Fitted values for double layer capacity and charge transfer resistance.
Author Contributions
Conceptualization, S.M.S.P., G.T. and R.G.M.; methodology, S.M.S.P., G.T. and R.G.M.; validation, S.M.S.P.; formal analysis, S.M.S.P., G.T. and R.G.M.; investigation, G.T., R.A.F., M.L. and S.S.; resources, S.M.S.P. and S.L.; data curation, S.M.S.P., G.T. and R.G.M.; writing—original draft preparation, S.M.S.P., G.T. and R.G.M.; writing—review and editing, S.M.S.P., G.T. and R.G.M.; visualization, S.M.S.P., G.T. and R.G.M.; supervision, S.M.S.P. and S.L.; project administration, S.M.S.P.; funding acquisition, S.M.S.P. and S.L. All authors have read and agreed to the published version of the manuscript.
Data Availability Statement
The data of this study are available from the corresponding author upon reasonable request.
Conflicts of Interest
The authors declare no conflict of interest. The funders had no role in the design of the study; in the collection, analyses, or interpretation of data; in the writing of the manuscript; or in the decision to publish the results.
Funding Statement
This research was funded by the European project TELEGRAM. The project has received funding from the European Union’s Horizon 2020 Research and Innovation programme, under grant agreement No 101006941.
Footnotes
Disclaimer/Publisher’s Note: The statements, opinions and data contained in all publications are solely those of the individual author(s) and contributor(s) and not of MDPI and/or the editor(s). MDPI and/or the editor(s) disclaim responsibility for any injury to people or property resulting from any ideas, methods, instructions or products referred to in the content.
References
- 1.Fang H., Zhou Y., Peng X., Luo Y., Wang X., Liang S., Jiang L. Challenges and Prospects in Artificial Nitrogen Cycle for Energy Decarbonization. Natl. Sci. Open. 2023;2:20220040. doi: 10.1360/nso/20220040. [DOI] [Google Scholar]
- 2.Thamdrup B. New Pathways and Processes in the Global Nitrogen Cycle. Annu. Rev. Ecol. Evol. Syst. 2012;43:407–428. doi: 10.1146/annurev-ecolsys-102710-145048. [DOI] [Google Scholar]
- 3.Gruber N., Galloway J.N. An Earth-System Perspective of the Global Nitrogen Cycle. Nature. 2008;451:293–296. doi: 10.1038/nature06592. [DOI] [PubMed] [Google Scholar]
- 4.Cherkasov N., Ibhadon A.O., Fitzpatrick P. A Review of the Existing and Alternative Methods for Greener Nitrogen Fixation. Chem. Eng. Process. Process Intensif. 2015;90:24–33. doi: 10.1016/j.cep.2015.02.004. [DOI] [Google Scholar]
- 5.Wang Z., Li Y., Yu H., Xu Y., Xue H., Li X., Wang H., Wang L. Ambient Electrochemical Synthesis of Ammonia from Nitrogen and Water Catalyzed by Flower-Like Gold Microstructures. ChemSusChem. 2018;11:3480–3485. doi: 10.1002/cssc.201801444. [DOI] [PubMed] [Google Scholar]
- 6.Ghavam S., Vahdati M., Wilson I.A.G., Styring P. Sustainable Ammonia Production Processes. Front. Energy Res. 2021;9:34. doi: 10.3389/fenrg.2021.580808. [DOI] [Google Scholar]
- 7.Dolan R.H., Anderson J.E., Wallington T.J. Outlook for Ammonia as a Sustainable Transportation Fuel. Sustain. Energy Fuels. 2021;5:4830–4841. doi: 10.1039/D1SE00979F. [DOI] [Google Scholar]
- 8.El-Shafie M., Kambara S. Recent Advances in Ammonia Synthesis Technologies: Toward Future Zero Carbon Emissions. Int. J. Hydrogen Energy. 2023;48:11237–11273. doi: 10.1016/j.ijhydene.2022.09.061. [DOI] [Google Scholar]
- 9.Wiskich A., Rapson T. Economics of Emerging Ammonia Fertilizer Production Methods—A Role for On-Farm Synthesis? ChemSusChem. 2023:e202300565. doi: 10.1002/cssc.202300565. [DOI] [PubMed] [Google Scholar]
- 10.Restelli F., Spatolisano E., Pellegrini L.A., de Angelis A.R., Cattaneo S., Roccaro E. Detailed Techno-Economic Assessment of Ammonia as Green H2 Carrier. Int. J. Hydrogen Energy. 2023 doi: 10.1016/j.ijhydene.2023.06.206. [DOI] [Google Scholar]
- 11.Ojelade O.A., Zaman S.F., Ni B.J. Green Ammonia Production Technologies: A Review of Practical Progress. J. Environ. Manag. 2023;342:118348. doi: 10.1016/j.jenvman.2023.118348. [DOI] [PubMed] [Google Scholar]
- 12.Biswas A., Bhardwaj S., Boruah T., Dey R.S. Electrochemical Ammonia Synthesis: Fundamental Practices and Recent Developments in Transition Metal Boride, Carbide and Nitride-Class of Catalysts. Mater. Adv. 2022;3:5207–5233. doi: 10.1039/D2MA00279E. [DOI] [Google Scholar]
- 13.Ertl G. Surface Science and Catalysis—Studies on the Mechanism of Ammonia Synthesis: The P. H. Emmett Award Address. Catal. Rev. 1980;21:201–223. doi: 10.1080/03602458008067533. [DOI] [Google Scholar]
- 14.Ouyang L., Liang J., Luo Y., Zheng D., Sun S., Liu Q., Hamdy M.S., Sun X., Ying B. Recent Advances in Electrocatalytic Ammonia Synthesis. Chin. J. Catal. 2023;50:6–44. doi: 10.1016/S1872-2067(23)64464-X. [DOI] [Google Scholar]
- 15.Hosono H. Spiers Memorial Lecture: Catalytic Activation of Molecular Nitrogen for Green Ammonia Synthesis: Introduction and Current Status. Faraday Discuss. 2023;243:9–26. doi: 10.1039/D3FD00070B. [DOI] [PubMed] [Google Scholar]
- 16.Klerke A., Christensen C.H., Nørskov J.K., Vegge T. Ammonia for Hydrogen Storage: Challenges and Opportunities. J. Mater. Chem. 2008;18:2304–2310. doi: 10.1039/b720020j. [DOI] [Google Scholar]
- 17.Kaiprathu A., Velayudham P., Teller H., Schechter A. Mechanisms of Electrochemical Nitrogen Gas Reduction to Ammonia under Ambient Conditions: A Focused Review. J. Solid State Electrochem. 2022;26:1897–1917. doi: 10.1007/s10008-022-05228-5. [DOI] [Google Scholar]
- 18.Skúlason E., Bligaard T., Gudmundsdóttir S., Studt F., Rossmeisl J., Abild-Pedersen F., Vegge T., Jónsson H., Nørskov J.K. A Theoretical Evaluation of Possible Transition Metal Electro-Catalysts for N2 Reduction. Phys. Chem. Chem. Phys. 2011;14:1235–1245. doi: 10.1039/C1CP22271F. [DOI] [PubMed] [Google Scholar]
- 19.Tao H., Choi C., Ding L.X., Jiang Z., Han Z., Jia M., Fan Q., Gao Y., Wang H., Robertson A.W., et al. Nitrogen Fixation by Ru Single-Atom Electrocatalytic Reduction. Chem. 2019;5:204–214. doi: 10.1016/j.chempr.2018.10.007. [DOI] [Google Scholar]
- 20.Shen H., Choi C., Masa J., Li X., Qiu J., Jung Y., Sun Z. Electrochemical Ammonia Synthesis: Mechanistic Understanding and Catalyst Design. Chem. 2021;7:1708–1754. doi: 10.1016/j.chempr.2021.01.009. [DOI] [Google Scholar]
- 21.Wang H., Yang D., Liu S., Yin S., Yu H., Xu Y., Li X., Wang Z., Wang L. Amorphous Sulfur Decorated Gold Nanowires as Efficient Electrocatalysts toward Ambient Ammonia Synthesis. ACS Sustain. Chem. Eng. 2019;7:19969–19974. doi: 10.1021/acssuschemeng.9b05542. [DOI] [Google Scholar]
- 22.Qin Q., Heil T., Antonietti M., Oschatz M. Single-Site Gold Catalysts on Hierarchical N-Doped Porous Noble Carbon for Enhanced Electrochemical Reduction of Nitrogen. Small Methods. 2018;2:1800202. doi: 10.1002/smtd.201800202. [DOI] [Google Scholar]
- 23.Wang H., Yu H., Wang Z., Li Y., Xu Y., Li X., Xue H., Wang L. Electrochemical Fabrication of Porous Au Film on Ni Foam for Nitrogen Reduction to Ammonia. Small. 2019;15:1804769. doi: 10.1002/smll.201804769. [DOI] [PubMed] [Google Scholar]
- 24.Xu Y., Ren T., Yu S., Ren K., Wang M., Wang Z., Li X., Wang L., Wang H. Anchoring Au Nanoparticles on Bi Ultrathin Nanosheets for Use as an Efficient Heterogeneous Catalyst for Ambient-Condition Electrochemical Ammonia Synthesis. Sustain. Energy Fuels. 2020;4:4516–4521. doi: 10.1039/D0SE00764A. [DOI] [Google Scholar]
- 25.Zhang W., Shen Y., Pang F., Quek D., Niu W., Wang W., Chen P. Facet-Dependent Catalytic Performance of Au Nanocrystals for Electrochemical Nitrogen Reduction. ACS Appl. Mater. Interfaces. 2020;12:41613–41619. doi: 10.1021/acsami.0c13414. [DOI] [PubMed] [Google Scholar]
- 26.Yang P., Guo H., Wu H., Zhang F., Liu J., Li M., Yang Y., Cao Y., Yang G., Zhou Y. Boosting Charge-Transfer in Tuned Au Nanoparticles on Defect-Rich TiO2 Nanosheets for Enhancing Nitrogen Electroreduction to Ammonia Production. J. Colloid Interface Sci. 2023;636:184–193. doi: 10.1016/j.jcis.2023.01.002. [DOI] [PubMed] [Google Scholar]
- 27.Wang Z., Zhang X., Dai Z., Tian W., Wang P., Xu Y., Li X., Wang L., Wang H. Electroreduction of Nitrogen to Ammonia over Bimetallic Mesoporous RuAu Film. Mater. Today Energy. 2022;23:100920. doi: 10.1016/j.mtener.2021.100920. [DOI] [Google Scholar]
- 28.Li W., Zhang C., Han M., Ye Y., Zhang S., Liu Y., Wang G., Liang C., Zhang H. Ambient Electrosynthesis of Ammonia Using Core-Shell Structured Au@C Catalyst Fabricated by One-Step Laser Ablation Technique. ACS Appl. Mater. Interfaces. 2019;11:44186–44195. doi: 10.1021/acsami.9b14770. [DOI] [PubMed] [Google Scholar]
- 29.Zhang J., Zhao B., Liang W., Zhou G., Liang Z., Wang Y., Qu J., Sun Y., Jiang L. Three-Phase Electrolysis by Gold Nanoparticle on Hydrophobic Interface for Enhanced Electrochemical Nitrogen Reduction Reaction. Adv. Sci. 2020;7:2002630. doi: 10.1002/advs.202002630. [DOI] [PMC free article] [PubMed] [Google Scholar]
- 30.Nazemi M., Panikkanvalappil S.R., El-Sayed M.A. Enhancing the Rate of Electrochemical Nitrogen Reduction Reaction for Ammonia Synthesis under Ambient Conditions Using Hollow Gold Nanocages. Nano Energy. 2018;49:316–323. doi: 10.1016/j.nanoen.2018.04.039. [DOI] [Google Scholar]
- 31.Cai X., Iriawan H., Yang F., Luo L., Shen S., Shao-Horn Y., Zhang J. Interaction of Ammonia with Nafion and Electrolyte in Electrocatalytic Nitrogen Reduction Study. J. Phys. Chem. Lett. 2021;12:6861–6866. doi: 10.1021/acs.jpclett.1c01714. [DOI] [PubMed] [Google Scholar]
- 32.Ren Y., Yu C., Tan X., Han X., Huang H., Huang H., Qiu J. Is It Appropriate to Use the Nafion Membrane in Electrocatalytic N2 Reduction? Small Methods. 2019;3:1900474. doi: 10.1002/smtd.201900474. [DOI] [Google Scholar]
- 33.Milazzo R.G., Mio A.M., D’Arrigo G., Spinella C., Grimaldi M.G., Rimini E. Electroless Deposition of Gold Investigated with Rutherford Backscattering and Electron Microscopy; Proceedings of the 2014 IEEE 9th Nanotechnology Materials and Devices Conference (NMDC); Aci Castello, Italy. 12–15 October 2014; pp. 37–40. [DOI] [Google Scholar]
- 34.Milazzo R.G., D’Arrigo G., Spinella C., Grimaldi M.G., Rimini E. Ag-Assisted Chemical Etching of (100) and (111) n-Type Silicon Substrates by Varying the Amount of Deposited Metal. J. Electrochem. Soc. 2012;159:D521–D525. doi: 10.1149/2.008209jes. [DOI] [Google Scholar]
- 35.Milazzo R.G., D’Arrigo G., Mio A.M., Spinella C., Grimaldi M.G., Rimini E. Electroless Deposition of Silver Investigated with Rutherford Backscattering and Electron Microscopy. ECS J. Solid State Sci. Technol. 2014;3:P235–P242. doi: 10.1149/2.0031407jss. [DOI] [Google Scholar]
- 36.Alia S.M., Yan Y.S., Pivovar B.S. Galvanic Displacement as a Route to Highly Active and Durable Extended Surface Electrocatalysts. Catal. Sci. Technol. 2014;4:3589–3600. doi: 10.1039/C4CY00736K. [DOI] [Google Scholar]
- 37.Milazzo R.G., Privitera S.M.S., D’Angelo D., Scalese S., Di Franco S., Maita F., Lombardo S. Spontaneous Galvanic Displacement of Pt Nanostructures on Nickel Foam: Synthesis, Characterization and Use for Hydrogen Evolution Reaction. Int. J. Hydrogen Energy. 2018;43:7903–7910. doi: 10.1016/j.ijhydene.2018.03.042. [DOI] [Google Scholar]
- 38.Leonardi M., Tranchida G., Corso R., Milazzo R.G., Lombardo S.A., Privitera S.M.S. Role of the Membrane Transport Mechanism in Electrochemical Nitrogen Reduction Experiments. Membranes. 2022;12:969. doi: 10.3390/membranes12100969. [DOI] [PMC free article] [PubMed] [Google Scholar]
- 39.Zhang X.L., Jiang Z.H., Yao Z.P., Song Y., Wu Z.D. Effects of Scan Rate on the Potentiodynamic Polarization Curve Obtained to Determine the Tafel Slopes and Corrosion Current Density. Corros. Sci. 2009;51:581–587. doi: 10.1016/j.corsci.2008.12.005. [DOI] [Google Scholar]
- 40.Tranchida G., Milazzo R.G., Leonardi M., Scalese S., Pulvirenti L., Condorelli G.G., Bongiorno C., Lombardo S., Privitera S.M.S. Strategies to Improve the Catalytic Activity of Fe-Based Catalysts for Nitrogen Reduction Reaction. Int. J. Hydrogen Energy. 2023;48:25328–25338. doi: 10.1016/j.ijhydene.2023.03.241. [DOI] [Google Scholar]
- 41.Li L., Tang C., Yao D., Zheng Y., Qiao S.Z. Electrochemical Nitrogen Reduction: Identification and Elimination of Contamination in Electrolyte. ACS Energy Lett. 2019;4:2111–2116. doi: 10.1021/acsenergylett.9b01573. [DOI] [Google Scholar]
- 42.Choi J., Suryanto B.H.R., Wang D., Du H.L., Hodgetts R.Y., Ferrero Vallana F.M., MacFarlane D.R., Simonov A.N. Identification and Elimination of False Positives in Electrochemical Nitrogen Reduction Studies. Nat. Commun. 2020;11:5546. doi: 10.1038/s41467-020-19130-z. [DOI] [PMC free article] [PubMed] [Google Scholar]
- 43.Bolleter W.T., Bushman C.J., Tidwell P.W. Spectrophotometric Determination of Ammonia as Indophenol. Anal. Chem. 1961;33:592–594. doi: 10.1021/ac60172a034. [DOI] [Google Scholar]
- 44.Zhu D., Zhang L., Ruther R.E., Hamers R.J. Photo-Illuminated Diamond as a Solid-State Source of Solvated Electrons in Water for Nitrogen Reduction. Nat. Mater. 2013;12:836–841. doi: 10.1038/nmat3696. [DOI] [PubMed] [Google Scholar]
- 45.Milazzo R.G., Privitera S.M.S., Scalese S., Lombardo S.A. Effect of Morphology and Mechanical Stability of Nanometric Platinum Layer on Nickel Foam for Hydrogen Evolution Reaction. Energies. 2019;12:3116. doi: 10.3390/en12163116. [DOI] [Google Scholar]
- 46.Khadke P., Tichter T., Boettcher T., Muench F., Ensinger W., Roth C. A Simple and Effective Method for the Accurate Extraction of Kinetic Parameters Using Differential Tafel Plots. Sci. Rep. 2021;11:8974. doi: 10.1038/s41598-021-87951-z. [DOI] [PMC free article] [PubMed] [Google Scholar]
- 47.Lv H., Xi Z., Chen Z., Guo S., Yu Y., Zhu W., Li Q., Zhang X., Pan M., Lu G., et al. A New Core/Shell NiAu/Au Nanoparticle Catalyst with Pt-like Activity for Hydrogen Evolution Reaction. J. Am. Chem. Soc. 2015;137:5859–5862. doi: 10.1021/jacs.5b01100. [DOI] [PubMed] [Google Scholar]
- 48.Tuli A., Wei J., Shaw B., Hopmans J. In situ monitoring of soil solution nitrate: Proof of concept. Soil Sci. Soc. Am. J. 2009;73:501–509. doi: 10.2136/sssaj2008.0160. [DOI] [Google Scholar]
Associated Data
This section collects any data citations, data availability statements, or supplementary materials included in this article.
Supplementary Materials
Data Availability Statement
The data of this study are available from the corresponding author upon reasonable request.


