Abstract
Sublethal infection of C57BL/6 mice with Salmonella enterica serovar Typhimurium M525P initiates a strong inflammatory response. We measured organ expression of mRNA for Toll-like receptors and their associated signaling molecules during S. enterica serovar Typhimurium infection. During infection, the Toll-lie receptor 1 (TLR1), TLR2, and TLR9 mRNA levels increased, while TLR6 mRNA expression decreased.
Cellular invasion by Salmonella triggers responses that dictate the outcome of infection. In sublethal infections the host controls the initial exponential bacterial growth in the liver and spleen. This plateau phase limits the primary infection and depends upon the release of proinflammatory mediators leading to granuloma formation (8, 9, 11). This process requires Toll-like receptor 4 (TLR4) activation (20, 22). The detailed mechanisms involved in plateau phase formation by the host during Salmonella infection are largely unknown.
Salmonellae possess many structures that act as pathogen-associated molecular patterns to signal bacterial presence to the host (for example, lipopolysaccharide, lipoproteins, flagellin, peptidoglycan, and bacterial DNA). These ligands bind to specialized pathogen-associated molecular pattern receptors, such as TLRs, that signal the cell to induce a response (21). TLR4, in association with the proteins MD2 and CD14, binds lipopolysaccharide (14, 18); TLR2 recognizes bacterial lipoproteins and lipoteichoic acid (16, 18), probably in cooperation with TLR6 and/or TLR1 (1, 13, 19); TLR5 responds to bacterial flagellin (3, 5, 17); and TLR9 is activated by bacterial DNA (detecting unmethylated CpG motifs) (6). Activation of TLRs recruits adapter proteins, such as MyD88 and TIRAP, to activate signaling pathways that induce proinflammatory proteins, such as cytokines (e.g., tumor necrosis factor alpha [TNF-α]), and inducible enzymes (e.g., inducible nitric oxide synthase [iNOS]).
Here we infected C57BL/6 mice with Salmonella enterica serovar Typhimurium M525P (10), a strain whose growth is controlled in these mice, leading to plateau formation in the spleen and liver. We analyzed expression of mRNA for TLR1, TLR2, TLR4, TLR5, TLR9, the adapter molecules MyD88 and TIRAP, the accessory protein MD2, and the proinflammatory proteins iNOS and TNF-α during a 14-day sublethal Salmonella infection in C57BL/6 mice.
Sublethal infection of C57BL/6 mice with S. enterica serovar Typhimurium M525P induces the inflammatory mediators TNF-α and iNOS.
Six- to eight-week-old C57BL/6 mice (Harlan Olac Laboratories) were inoculated with 103 CFU of S. enterica serovar Typhimurium M525P (10) in the tail vein. RNA was isolated, and bacterial counts were obtained for the spleen and liver (20).
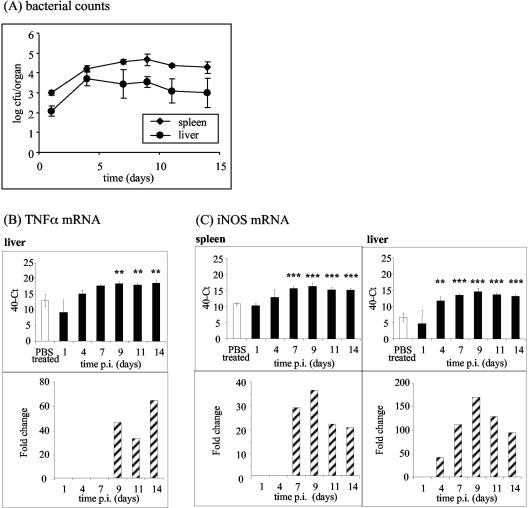
The bacterial counts initially increased at a rate of approximately 0.4 log per day. From day 4 onward a plateau in the bacterial growth curve occurred (Fig. 1A). The spleen and liver levels of TNF-α and iNOS mRNA, as measured by real-time reverse transcriptase PCR (20) with the primers shown in Table 1 (standard curve data are shown in Table 2), increased over the course of the infection (Fig. 1B and C). The basal levels of TNF-α mRNA were high in both organs (Fig. 1B and 2), which probably allowed rapid translation of mRNA into TNF-α protein after infection. Macrophage iNOS expression increases during Salmonella infection (2), probably because the reactive nitrogen intermediates produced are bactericidal (10). We saw significant sustained increases in the iNOS mRNA level from day 4 in the liver and from day 7 in the spleen (Fig. 1C).
FIG. 1.
Induction of TNF-α and iNOS in the spleen and liver during sublethal infection with S. enterica serovar Typhimurium M525P. (A) C57BL/6 mice were intravenously infected with 103 CFU of S. enterica serovar Typhimurium M525P per mouse. At each time postinfection, spleens and livers of four mice were divided, and samples were immediately snap frozen in liquid nitrogen for RNA isolation or homogenized for determination of viable bacterial counts. (B and C) Quantification of TNF-α (B) and iNOS (C) mRNA in spleens and livers from C57BL/6 mice at various times postinfection after intravenous inoculation of 103 CFU of S. enterica serovar Typhimurium M525P. Cycle threshold (Ct) values are expressed subtracted from 40 (the negative endpoint), and higher values represent higher levels of mRNA. These mRNA levels were standardized to the 18S rRNA levels in spleens and livers from infected and control mice. The data for times at which there is a significant difference between mock-infected and Salmonella-infected organs are also expressed as fold changes in mRNA levels compared to the mock-infected control (striped bars), calculated as follows: 2[(40 − Ct for infected mice) − (40 − Ct for control mice)]. Two asterisks indicate that the P value is <0.01, and three asterisks indicate that the P value is <0.001. PBS, phosphate-buffered saline; p.i., postinfection.
TABLE 1.
Real-time quantitative reverse transcriptase PCR probes and primers
| RNA target | Probe sequence (5′-3′) | Forward primer sequence (5′-3′) | Reverse primer sequence (5′-3′) |
|---|---|---|---|
| 18 SrRNA | ACCGGCGCAAGACGCACCAG | CGCCGCTAGAGGTGAAATTCT | CATTCTTGGCAAATGCTTTCG |
| TLR1 | TCAGCCTCAAGCATTTGGACCTCTCCT | TGATCTTGTGCCACCCAACA | GCAGGGCATCAAAGGCATTA |
| TLR2 | CGTTTTTACCACCCGGATCCCTGTACT | AAGATGCGCTTCCTGAATTTG | TCCAGCGTCTGAGGAATGC |
| TLR4 | CCTGGTGTAGCCATTGCTGCCAACA | CCTCTGCCTTCACTACAGAGACTTT | GTGGAAGCCTTCCTGGATGA |
| TLR5 | TGGTAATATCTCCCTGTTCTTCAGACGGCA | AACTTGACTTGCTCATAGGTGTGATC | CAGCCTCGGAAAAAGGCTATC |
| TLR6 | AGCCAAGACAGAAAACCCATCGTGGG | TCTGGGATAGCCTCTGCAACA | GGCGCAAACAAAGTGGAAAC |
| TLR9 | CGACCATGCCCCCAATCCCTG | TGATGTGGGTGGGAATTGC | GGGACTTTTGGCCACATTCTAT |
| MD2 | TCTTTTCGACGCTGCTTTCTCCCATATTG | GGAGATATTAAATCATGTTGCCATTTATT | ACCACTGTTGCTTCTCAGATTCAG |
| MyD88 | CCCTTGGTCGCGCTTAACGTGG | CTGGACTCCTTCATGTTCTCCAT | GATAGGCGGCGCCTCACT |
| TIRAP | TGCCGTGTGCTGCTCATCACTCC | TGCCAGGCACTGAGTCGTAGT | GGCCTGCAGCATCTGGTACT |
| TNF-α | TCAGCCTCTTCTCATTCCTGCTTGTGG | TCCAGGCGGTGCCTATGT | CGATCACCCCGAAGTTCAGT |
| iNOS | CTTCCGGGCAGCCTGTGAGACCT | CGCAGCTGGGCTGTACAA | TGATGTTTGCTTCGGACATCA |
Primers and probes were designed by using the Primer Express software program (PE Applied Biosystems). The probes were labeled with the fluorescent reporter dye 5-carboxyfluorescein at the 5′ end and with the quencher N,N,N,N′-tetramethyl-6- carboxyrhodamine at the 3′ end.
TABLE 2.
Standard curve data from a real-time quantitative reverse transcriptase PCR analysis of total RNA extracted from stimulated RAW cells, a macrophage like cell linea
| Target | ΔRg significance thresholdb | Log dilutions | Range of Ct valuesc | R2d | Slope |
|---|---|---|---|---|---|
| 18S rRNA | 0.2 | 10−3-10−7 | 7-26 | 0.997 | 3.7997 |
| TLR1 | 0.02 | 10−1-10−5 | 20-36 | 0.9805 | 3.444 |
| TLR2 | 0.04 | 10−1-10−5 | 18-36 | 0.9776 | 3.414 |
| TLR4 | 0.04 | 10−1-10−4 | 24-37 | 0.9891 | 3.719 |
| TLR5 | 0.02 | 10−1-10−3 | 29-38 | 0.9913 | 3.915 |
| TLR6 | 0.02 | 10−1-10−4 | 23-34 | 0.9561 | 3.219 |
| TLR9 | 0.03 | 10−1-10−4 | 24-34 | 0.9900 | 3.133 |
| MD2 | 0.04 | 10−1-10−4 | 19-38 | 0.9927 | 3.583 |
| MyD88 | 10−1-10−5 | 22-35 | 0.9829 | 3.106 | |
| TIRAP | 0.03 | 10−1-10−3 | 23-31 | 0.9320 | 3.435 |
| TNF-α | 0.03 | 10−2-10−6 | 17-38 | 0.9861 | 4.3687 |
| iNOS | 0.03 | 10−1-10−5 | 18-35 | 0.9805 | 3.495 |
To generate standard curves for the specific reactions for the various probes, total RNA extracted from stimulated RAW macrophages was serially diluted.
ΔRn is the change in the reporter dye level.
Ct is the threshold cycle value, the cycle at which the change in the reporter dye level detected passes the ΔRn.
R2 is the coefficient of regression. Regression analyses of the mean values of three or four replicate reverse transcriptase PCRs for the log10-diluted RNA were used.
FIG. 2.
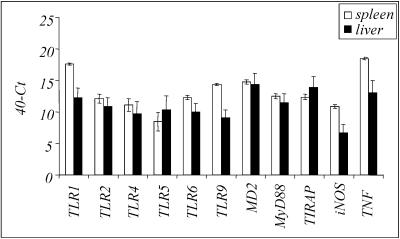
Basal mRNA expression in spleens and livers of mock-infected animals: comparison of basal levels of all molecules analyzed by real-time PCR in spleens and livers from mock-infected C57BL/6 mice. Cycle threshold (Ct) values are expressed subtracted from 40 (the negative endpoint); higher values represent higher levels of mRNA.
Levels of TLR1, TLR2, and TLR9 mRNA increase and the level of TLR6 mRNA decreases during infection with S. enterica serovar Typhimurium.
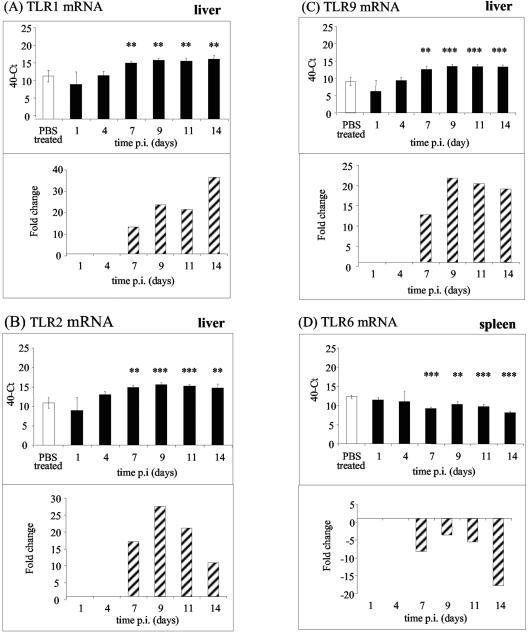
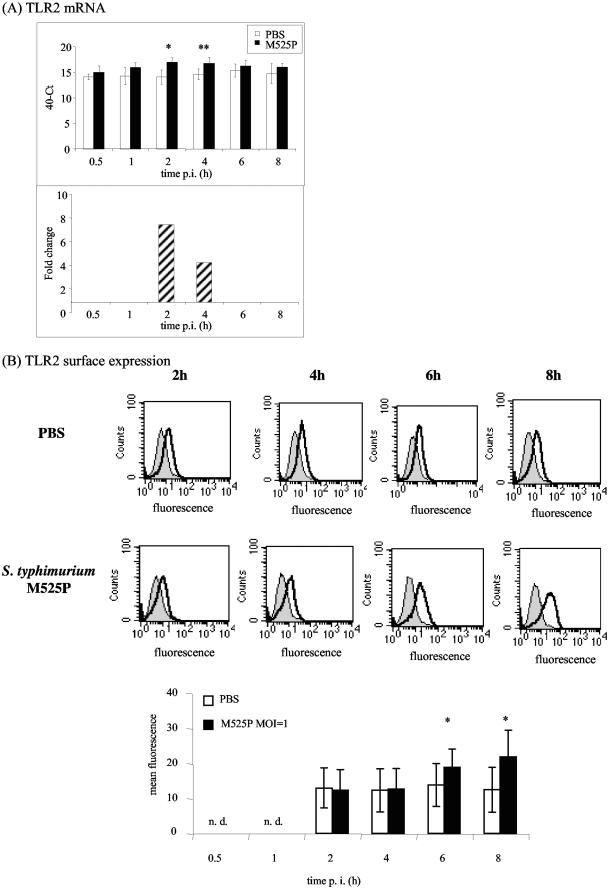
Measurement of mRNA levels with the primers shown in Table 1 (standard curve data are shown in Table 2) showed that in the liver the level of TLR2 transiently increased during the plateau phase (Fig. 3B), and the levels of TLR1 and TLR9 also increased during infection (Fig. 3A and C). Expression of TLR6 mRNA was reduced from day 7 onward (Fig. 3D), while the expression of TLR4, TLR5, MD2, MyD88, and TIRAP/Mal mRNA did not change in response to sublethal Salmonella infection (data not shown). We were unable to determine whether TLR mRNA expression correlates with cell surface protein expression in the liver because fluorescence-activated cell sorting analysis in this tissue is not practical, but in murine bone marrow-derived macrophages (12, 15) the TLR2 mRNA and protein levels both increased in response to infection (Fig. 4). It is likely that the macrophage response reflects what happens in an infected liver.
FIG. 3.
Levels of TLR1, TLR2, and TLR9 mRNA increase in response to infection while TLR6 mRNA levels decrease during sublethal infection with S. enterica serovar Typhimurium M525P. TLR1 (A), TLR2 (B), TLR9 (C), and TLR6 (D) mRNA in spleens and livers from C57BL/6 mice were quantified at various times postinfection after intravenous inoculation of 103 CFU of S. enterica serovar Typhimurium M525P. Cycle threshold (Ct) values are expressed subtracted from 40 (the negative endpoint); higher values represent higher levels of mRNA. The mRNA levels were standardized to 18S rRNA levels in spleens and livers from infected and control mice. The data for times at which there is a significant difference between mock-infected and Salmonella infected organs are also expressed as fold changes in mRNA levels compared to the mock-infected control (striped bars), calculated as follows: 2[(40 − Ct for infected mice) − (40 − Ct for control mice)]. Two asterisks indicate that the P value is <0.01, and three asterisks indicate that the P value is <0.001. PBS, phosphate-buffered saline; p.i., postinfection.
FIG.4.
TLR2 mRNA and surface expression increase in bone marrow-derived macrophages in response to infection with S. enterica serovar Typhimurium M525P. TLR2 mRNA (A) and surface protein expression (B) were quantified by using bone marrow-derived macrophages from C57BL/6 mice at various times after infection with S. enterica serovar Typhimurium M525P at a multiplicity of infection of 1. (A) Cycle threshold (Ct) values are expressed subtracted from 40 (the negative endpoint); higher values represent higher levels of mRNA. The mRNA levels were standardized to 18S rRNA levels. The data from times at which there is a significant difference between control and Salmonella-infected bone marrow-derived macrophages are also expressed as fold changes in mRNA levels compared to the control (striped bars). (B) Flow cytometry analysis of Salmonella-infected and control bone marrow-derived macrophages after cell surface staining with anti-mouse TLR2 (thick line) or isotype control antibody (thin line). The graph at the bottom shows fluorescence values (means ± standard deviations of the means) for four independent experiments. One asterisk indicates that the P value is <0.05, and two asterisks indicate that the P value is <0.01. PBS, phosphate-buffered saline; p.i., postinfection; n. d., not determined.
In contrast to our observations with C3H/HeN mice (the level of TLR4 mRNA decreased on day 1 and then increased to uninfected control levels [20]), in C57BL/6 mice the level of TLR4 mRNA was unchanged throughout the 14-day experiment. This could have been due to the use of different Salmonella strains or to differences between the mouse strains (for example, C3H/HeN mice are Nramp+, while C57BL/6 mice are Nramp).
The levels of both TLR2 and TLR1 mRNA increased during infection, suggesting that more TLR2-TLR1 heterodimers may form during infection. In contrast, TLR2-TLR6 formation is probably reduced, since the TLR6 mRNA levels decreased in the spleen and stayed at basal levels in the liver over the course of the Salmonella infection (Fig. 3D). The TLR2-TLR6 complex recognizes primarily gram-positive bacteria and mycoplasmas (4, 7, 13, 19) and probably plays no role during gram-negative infections. Low levels of TLR6 might therefore make more TLR2 available to form TLR2-TLR1 heterodimers.
Increased TLR1, TLR2, and TLR9 expression can be only partially explained by an influx of macrophages and polymorphonuclear leukocytes into the organs, since the levels of some macrophage mRNA, such as MD2 mRNA, remain unchanged (data not shown). This correlates with our previous data which showed that the numbers of macrophages increase two- to fivefold in the spleen and liver over the first 7 days of Salmonella infection (20). In comparison, the increase in expression of TLR1, TLR2, and TLR9 mRNA was about 15-fold and the increase in expression of TNF-α mRNA was about 30-fold.
In the spleens and livers of mock-infected animals we detected mRNA for TNF-α, iNOS, and the TLR-associated proteins (Fig. 2). Constitutive expression of TLR mRNA allows the immune system to respond immediately to pathogens, and continuous challenges with small amounts of bacterial constituents may be required to keep the immune system alert to infection (21).
In summary, development of the plateau phase during sublethal Salmonella infection correlates with up-regulation of TLR1, TLR2, and TLR9 mRNA expression and down-regulation of TLR6 mRNA expression. This suggests that in addition to TLR4, the TLR2-TLR1 complex and TLR9 may play a role in controlling infection, particularly in the later stages when the bacterial growth is suppressed, possibly at the adaptive phase of the immune response. Coordinate regulation of TLR receptor expression would then complement the proposed sequential activation of TLRs during S. enterica serovar Typhimurium infection (23).
Acknowledgments
This study was supported by Biotechnology and Biological Sciences Research Council grant 8/D16845 and by a Wellcome Trust Advanced Fellowship (to C.E.B.).
We thank Tomoko Smyth and Catherine Stevenson for practical assistance and Fred Heath for advice on the statistical analysis.
Editor: F. C. Fang
REFERENCES
- 1.Bulut, Y., E. Faure, L. Thomas, O. Equils, and M. Arditi. 2001. Cooperation of Toll-like receptors 2 and 6 for cellular activation by soluble tuberculosis factor and Borrelia burgdorferi outer surface protein A lipoprotein: role of Toll-interacting protein and IL-1 receptor signaling molecules in Toll-like receptor 2 signaling. J. Immunol. 167:987-994. [DOI] [PubMed] [Google Scholar]
- 2.Cherayil, B. J., and D. Antos. 2001. Inducible nitric oxide synthase and Salmonella infection. Microbes Infect. 3:771-776. [DOI] [PubMed] [Google Scholar]
- 3.Gewirtz, A. T., T. A. Navas, S. Lyons, P. J. Godowski, and J. L. Madara. 2001. Cutting edge: bacterial flagellin activates basolaterally expressed TLR5 to induce epithelial proinflammatory gene expression. J. Immunol. 167:1882-1885. [DOI] [PubMed] [Google Scholar]
- 4.Hajjar, A. M., D. S. O'Mahony, A. Ozinsky, D. M. Underhill, A. Aderem, S. J. Klebanoff, and C. B. Wilson. 2001. Cutting edge: functional interactions between Toll-like receptor (TLR) 2 and TLR1 or TLR6 in response to phenol-soluble modulin. J. Immunol. 166:15-19. [DOI] [PubMed] [Google Scholar]
- 5.Hayashi, F., K. D. Smith, A. Ozinsky, T. R. Hawn, E. C. Yi, D. R. Goodlett, J. K. Eng, S. Akira, D. M. Underhill, and A. Aderem. 2001. The innate immune response to bacterial flagellin is mediated by Toll-like receptor 5. Nature 410:1099-1103. [DOI] [PubMed] [Google Scholar]
- 6.Hemmi, H., O. Takeuchi, T. Kawai, T. Kaisho, S. Sato, H. Sanjo, M. Matsumoto, K. Hoshino, H. Wagner, K. Takeda, and S. Akira. 2000. A Toll-like receptor recognizes bacterial DNA. Nature 408:740-745. [DOI] [PubMed] [Google Scholar]
- 7.Henneke, P., O. Takeuchi, J. A. van Strijp, H. K. Guttormsen, J. A. Smith, A. B. Schromm, T. A. Espevik, S. Akira, V. Nizet, D. L. Kasper, and D. T. Golenbock. 2001. Novel engagement of CD14 and multiple Toll-like receptors by group B streptococci. J. Immunol. 167:7069-7076. [DOI] [PubMed] [Google Scholar]
- 8.Mastroeni, P., A. Arena, G. B. Costa, M. C. Liberto, L. Bonina, and C. E. Hormaeche. 1991. Serum TNF alpha in mouse typhoid and enhancement of a Salmonella infection by anti-TNF alpha antibodies. Microb. Pathog. 11:33-38. [DOI] [PubMed] [Google Scholar]
- 9.Mastroeni, P., J. A. Harrison, J. A. Chabalgoity, and C. E. Hormaeche. 1996. Effect of interleukin 12 neutralization on host resistance and gamma interferon production in mouse typhoid. Infect. Immun. 64:189-196. [DOI] [PMC free article] [PubMed] [Google Scholar]
- 10.Mastroeni, P., A. Vazquez-Torres, F. C. Fang, Y. Xu, S. Khan, C. E. Hormaeche, and G. Dougan. 2000. Antimicrobial actions of the NADPH phagocyte oxidase and inducible nitric oxide synthase in experimental salmonellosis. II. Effects on microbial proliferation and host survival in vivo. J. Exp. Med. 192:237-248. [DOI] [PMC free article] [PubMed] [Google Scholar]
- 11.Muotiala, A., and P. H. Makela. 1990. The role of IFN-gamma in murine Salmonella typhimurium infection. Microb. Pathog. 8:135-141. [DOI] [PubMed] [Google Scholar]
- 12.Nilsen, N., U. Nonstad, N. Khan, C. F. Knetter, S. Akira, A. Sundan, T. Espevik, and E. Lien. 2004. Lipopolysaccharide and double-stranded RNA up-regulate Toll-like receptor 2 independently of myeloid differentiation factor 88. J. Biol. Chem. 279:39727-39735. [DOI] [PubMed] [Google Scholar]
- 13.Ozinsky, A., D. M. Underhill, J. D. Fontenot, A. M. Hajjar, K. D. Smith, C. B. Wilson, L. Schroeder, and A. Aderem. 2000. The repertoire for pattern recognition of pathogens by the innate immune system is defined by cooperation between Toll-like receptors. Proc. Natl. Acad. Sci. USA 97:13766-13771. [DOI] [PMC free article] [PubMed] [Google Scholar]
- 14.Poltorak, A., X. He, I. Smirnova, M. Y. Liu, C. Van Huffel, X. Du, D. Birdwell, E. Alejos, M. Silva, C. Galanos, M. Freudenberg, P. Ricciardi-Castagnoli, B. Layton, and B. Beutler. 1998. Defective LPS signaling in C3H/HeJ and C57BL/10ScCr mice: mutations in Tlr4 gene. Science 282:2085-2088. [DOI] [PubMed] [Google Scholar]
- 15.Royle, M. C., S. Totemeyer, L. C. Alldridge, D. J. Maskell, and C. E. Bryant. 2003. Stimulation of Toll-like receptor 4 by lipopolysaccharide during cellular invasion by live Salmonella typhimurium is a critical but not exclusive event leading to macrophage responses. J. Immunol. 170:5445-5454. [DOI] [PubMed] [Google Scholar]
- 16.Schwandner, R., R. Dziarski, H. Wesche, M. Rothe, and C. J. Kirschning. 1999. Peptidoglycan- and lipoteichoic acid-induced cell activation is mediated by Toll-like receptor 2. J. Biol. Chem. 274:17406-17409. [DOI] [PubMed] [Google Scholar]
- 17.Smith, K. J., S. Hamza, and H. Skelton. 2003. The imidazoquinolines and their place in the therapy of cutaneous disease. Expert Opin. Pharmacother. 4:1105-1119. [DOI] [PubMed] [Google Scholar]
- 18.Takeuchi, O., K. Hoshino, T. Kawai, H. Sanjo, H. Takada, T. Ogawa, K. Takeda, and S. Akira. 1999. Differential roles of TLR2 and TLR4 in recognition of gram-negative and gram-positive bacterial cell wall components. Immunity 11:443-451. [DOI] [PubMed] [Google Scholar]
- 19.Takeuchi, O., T. Kawai, P. F. Muhlradt, M. Morr, J. D. Radolf, A. Zychlinsky, K. Takeda, and S. Akira. 2001. Discrimination of bacterial lipoproteins by Toll-like receptor 6. Int. Immunol. 13:933-940. [DOI] [PubMed] [Google Scholar]
- 20.Totemeyer, S., N. Foster, P. Kaiser, D. J. Maskell, and C. E. Bryant. 2003. Toll-like receptor expression in C3H/HeN and C3H/HeJ mice during Salmonella enterica serovar Typhimurium infection. Infect. Immun. 71:6653-6657. [DOI] [PMC free article] [PubMed] [Google Scholar]
- 21.Van Amersfoort, E. S., T. J. Van Berkel, and J. Kuiper. 2003. Receptors, mediators, and mechanisms involved in bacterial sepsis and septic shock. Clin. Microbiol. Rev. 16:379-414. [DOI] [PMC free article] [PubMed] [Google Scholar]
- 22.Weinstein, D. L., C. R. Lissner, R. N. Swanson, and A. D. O'Brien. 1986. Macrophage defect and inflammatory cell recruitment dysfunction in Salmonella susceptible C3H/HeJ mice. Cell. Immunol 102:68-77. [DOI] [PubMed] [Google Scholar]
- 23.Weiss, D. S., B. Raupach, K. Takeda, S. Akira, and A. Zychlinsky. 2004. Toll-like receptors are temporally involved in host defense. J. Immunol. 172:4463-4469. [DOI] [PubMed] [Google Scholar]


