Abstract
An expression vector for the luxAB genes, derived from Vibrio harveyi, was introduced into Nitrosomonas europaea. Although the recombinant strain produced bioluminescence due to the expression of the luxAB genes under normal growing conditions, the intensity of the light emission decreased immediately, in a time-and dose-dependent manner, with the addition of ammonia monooxygenase inhibitors, such as allylthiourea, phenol, and nitrapyrin. When whole cells were challenged with several nitrification inhibitors and toxic compounds, a close relationship was found between the change in the intensity of the light emission and the level of ammonia-oxidizing activity. The response of bioluminescence to the addition of allylthiourea was considerably faster than the change in the ammonia-oxidizing rate, measured as both the O2 uptake and NO2− production rates. The bioluminescence of cells inactivated by ammonia monooxygenase inhibitor was recovered rapidly by the addition of certain substrates for hydroxylamine oxidoreductase. These results suggested that the inhibition of bioluminescence was caused by the immediate decrease of reducing power in the cell due to the inactivation of ammonia monooxygenase, as well as by the destruction of other cellular metabolic pathways. We conclude that the assay system using luminous Nitrosomonas can be applied as a rapid and sensitive detection test for nitrification inhibitors, and it will be used to monitor the nitrification process in wastewater treatment plants.
The chemoautotrophic ammonia-oxidizing bacteria obtain their energy for growth by the oxidation of ammonia to nitrite (30). In Nitrosomonas europaea, ammonia is initially oxidized to hydroxylamine by ammonia monooxygenase (AMO) as follows: NH3 + O2 + 2H+ + 2e− → NH2OH + H2O. The subsequent oxidation of hydroxylamine to nitrite is catalyzed by hydroxylamine oxidoreductase (HAO) as follows: NH2OH + H2O → NO2− + 5H+ + 4e−. Two of the four electrons generated by the HAO-mediated second reaction are required to maintain steady-state AMO activity, and the remaining two electrons are used for ATP synthesis through a conventional electron transport chain (4, 10, 30). Some electrons are also used for the production of NADH or NADPH (1, 4, 10, 30).
In wastewater treatment plants and sewage disposal systems, ammonia-oxidizing bacteria play an important role in the removal of ammonia (19). Ammonia is oxidized to nitrite by nitrifying bacteria (ammonia-oxidizing bacteria and nitrite-oxidizing bacteria), and the resulting nitrate (nitrite) is then reduced to molecular nitrogen by denitrifying bacteria. The ammonia-removing process is known to be particularly susceptible to inhibition by certain chemical compounds at low concentrations, compared to the conventional process for removal of biochemical oxygen demand (19, 29). The largest cause of this phenomenon has been thought to be the inhibition of the AMO-mediated ammonia oxidation process, because several chemical compounds inhibit AMO activity at low concentrations compared with other enzymes (2, 9). Because AMO contains copper in its active center, metal binding compounds and chelating agents reversibly inhibit its activity (2, 9). For example, allylthiourea strongly inhibits AMO at very low concentrations (in the order of micromolar concentrations). Furthermore, AMO is able to oxidize several compounds, including sulfur, aliphatic, aromatic, and halogenated compounds, as alternative substrates instead of ammonia, and these compounds competitively inhibit AMO activity (2, 10, 11, 14, 26, 27). Because inhibition of nitrification causes serious problems for the effective treatment of wastewater, a rapid and sensitive method that can detect inhibition of ammonia oxidation is expected to be useful in monitoring the nitrification process in wastewater treatment plants.
The bacterial luciferase gene (luxAB), which encodes the two subunits of the luciferase enzyme, has been isolated from several luminous bacteria and used in several biological studies and applications (17, 24). The light-emitting reaction of luciferase is involved in the oxidation of reduced flavin mononucleotide (FMNH2) and a long-chain fatty aldehyde in the presence of molecular oxygen. The reaction is as follows: FMNH2 + RCHO + O2 → FMN + RCOOH + H2O + hν (490 nm), where R represents a long-chain alkyl group and h and ν represent Planck’s constant and frequency, respectively. In recent years, bioluminescence by the bacterial luciferase system has been used for the evaluation of cell viability and the detection of toxic compounds, because toxic compounds destroy cellular metabolism and subsequently eliminate light production in vivo (5, 24, 31).
In the present study, we describe the application of the bacterial luciferase gene for the rapid and sensitive detection of nitrification inhibitors that inhibit ammonia-oxidizing bacteria. Although recombinant N. europaea, which carries an expression plasmid vector for the Vibrio harveyi luxAB genes, produced bioluminescence due to the expression of the luxAB genes, a loss of light emission was immediately observed with the addition of nitrification inhibitors at low concentrations. We demonstrated that the loss of light emission is caused by a decrease of reducing power in the cell due to the inhibition of AMO, as well as by the destruction of other cellular metabolic pathways.
MATERIALS AND METHODS
Bacterial strain and growth conditions.
N. europaea IFO14298 (ATCC 19178) was grown aerobically at 30°C in P medium [2.5 g of (NH4)2SO4, 0.7 g of KH2PO4, 13.5 g of Na2HPO4, 0.5 g of NaHCO3, 100 mg of MgSO4 · 7H2O, 5 mg of CaCl2 · 2H2O, and 1 mg of Fe-EDTA per liter (pH 8.0)] in the dark (15). In cultivation using a 5-liter jar fermentor with a working volume of 3.5 liters (MD300-5L; B. E. Marubushi Co., Ltd., Tokyo, Japan), cells were grown in P medium in the dark (operating conditions: air flow, 0.5 vol/vol/min; agitation, 250 rpm; temperature, 30°C; pH 7.8, controlled by addition of 2 N NaOH). For the recombinant strain of N. europaea, kanamycin was added into the medium at a final concentration of 25 μg/ml. Cell growth was monitored at 600 nm by using a U-100 spectrophotometer (Hitachi Co., Ltd., Tokyo, Japan) with cuvettes of a 50-mm light path.
Nitrification inhibitors.
Nitrification inhibitors used in this study were purchased from Tokyo Kasei Industry Co., Ltd. (Tokyo, Japan) or Kishida Chemical Co., Ltd. (Osaka, Japan), except for nitrapyrin and formaldehyde. Nitrapyrin (2-chloro-6-(trichloromethyl)pyridine) was obtained from Dow Chemical Co. (Midland, Mich.). Formaldehyde was obtained as a 37% solution stabilized with 10% methanol from Merck (Darmstadt, Germany). Water-insoluble compounds were dissolved in dimethyl sulfoxide (DMSO; Sigma Chemical Co., St. Louis, Mo.) as 2 mM (allyl sulfide, nitrapyrin, pentachlorophenol, and 8-quinolinol), 20 mM (picolinic acid), and 100 mM (2,4-dinitrophenol) solutions and then were diluted with water before use.
DNA manipulation.
The standard molecular genetic techniques used have been described previously (12). PCR was performed in a volume of 50 μl with a set of oligonucleotide primers (100 pM) and an ExTaq reagent kit with ExTaq DNA polymerase (Takara Syuzo Co., Ltd., Kyoto, Japan) under the following reaction conditions: 94°C for 0.5 min, 55°C for 1 min, and 72°C for 1 min (25 cycles). Introduction of plasmid into N. europaea was carried out by electroporation as described previously (12).
Construction of plasmids.
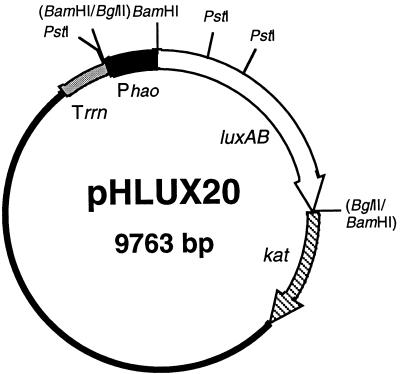
pKTK40 (12) was digested with BamHI and was ligated with a BamHI-BglII-treated 2.2-kb fragment containing luxAB genes obtained by PCR amplification using 1 μg of V. harveyi ATCC 33843 chromosomal DNA as the template, with primers 5′-CGGGATCCAACAAATAAGGAAATGTTATG-3′ and 5′-CCAGATCTTCCATATAAATGCCTCTATTAG-3′, corresponding to nucleotides 687 to 709 in the published luxA sequence (6) and 1063 to 1043 in the published luxB sequence (13), respectively. The resulting plasmid was named pKLUX27. A 0.35-kb fragment containing the promoter region of the hao gene was obtained by PCR amplification using 1 μg of N. europaea chromosomal DNA as the template, with primers 5′-CGAGATCTTCGAAATATTGATGAGCAGC-3′ and 5′-CGGGATCCGTAAATATGCGGGTCAG-3′, corresponding to nucleotides −275 to −251 and 67 to 48, respectively, in the published sequence (21). The amplified fragment was digested with both BamHI and BglII and was ligated with BamHI-digested pKLUX27, yielding pHLUX20. The physical map of pHLUX20 is shown in Fig. 1. For all cloning experiments, Escherichia coli DH5 was used as the host strain. The nucleotide sequence of the 0.35-kb hao promoter region was confirmed by the dideoxy chain termination method (20) with a BcaBEST sequencing kit from Takara Syuzo Co. There was a 6-base difference between the published and the observed sequence of the amplified fragment of the nonfunctional region of the promoter (C→T at position −74, C→A at −179, and GGGC→AACG at −238 to −235). These substitutions might have been caused by in vitro random mutagenesis during PCR and/or cloning of an unpublished hao promoter region among the three copies of hao genes (3, 21).
FIG. 1.
Physical map of pHLUX20. Promoterless luciferase-encoding genes (luxAB) from V. harveyi and the Tn903-derived kanamycin acetyltransferase-encoding gene (kat) are shown as open and striped arrows, respectively, indicating the gene orientations. The E. coli 5S rRNA rho-independent terminator (Trrn) and the promoter region of the N. europaea HAO-encoding gene (Phao) are represented by shaded and solid bars, respectively. The solid line is the region derived from the IncQ plasmid, which is essential for replication.
Bioluminescence measurement.
Bioluminescence was measured by using a Model 20e luminometer (Turner Design Co., Sunnyvale, Calif.). A standard polyethylene cuvette (8 by 50 mm) containing 2.5 μl of 10% (vol/vol) n-decyl aldehyde dissolved in ethanol was placed in the luminometer. The luminescent reaction was started by the injection of aliquots (100 μl) of the test samples. The relative light unit (RLU) was expressed as a “full integral value,” which means the average light output during 5 to 15 s after the start of the reaction. All measurements were performed at 25°C.
Assay of inhibition of bioluminescence.
The culture broth of N. europaea(pHLUX20) was removed from the jar fermentor when the NO2− concentration in the culture broth was approximately 5 to 10 mM and was stored at room temperature in the dark for 15 to 30 min. An aliquot (0.95 ml) of the culture was placed in a test tube, and 50 μl of test sample was added. After the incubation at 25°C, bioluminescence was measured. If the test sample contained a high concentration of chemical compounds (more than approximately 10 mM), the pH of the test sample was adjusted to 7.8 by NaOH or HCl before use. The strength of inhibition of bioluminescence by the inhibitor was expressed as the LIC50 (luminescence inhibitory concentration), defined as the concentration of inhibitor causing a 50% reduction in light output from that in the control reaction. The LIC50 was calculated from graphed data obtained by dose-response experiments using twofold serial dilutions of the test sample.
Assay of inhibition of ammonia-oxidizing activity.
Ammonia-oxidizing activity was measured as the NO2− production rate in whole N. europaea cells. N. europaea cells were harvested by filtration with a membrane filter (0.22-μm-pore-size cellulose-acetate filter unit; Corning, Inc., Corning, N.Y.) when the NO2− concentration of the culture broth in a jar fermentor was approximately 10 mM. The cells were washed and resuspended in cold 100 mM phosphate buffer (pH 7.8) at a final protein concentration of about 0.7 mg/ml. P medium (2 ml) was placed in a test tube and kept at 30°C. Aliquots (50 μl) of cell suspension were added to the test tube and preincubated for 10 min at 30°C with agitation in order to establish the steady-state NO2− production rate. A test sample of 100 μl was then added, and incubation was continued for 30 min. The NO2−-producing reaction was stopped by the addition of 20 μl of 0.1 M allylthiourea, and then the NO2− concentration of the reaction mixture was measured. The strength of inhibition of the ammonia-oxidizing activity by the inhibitor was expressed as the AIC50 (ammonia oxidization inhibitory concentration), which was defined as the concentration of inhibitor causing a 50% reduction in NO2− production from that in the control reaction without inhibitor. The AIC50 was also calculated from graphed data obtained by dose-response experiments as described above.
Measurement of the O2 uptake rate and the NO2− production rate.
N. europaea(pHLUX20) cells were harvested by filtration when the NO2− concentration of the culture broth in the jar fermentor was approximately 10 mM. The cells were washed and resuspended in cold 100 mM phosphate buffer (pH 7.8) at a final protein concentration of 2 mg/ml. A dissolved-oxygen (DO) electrode (GU-BMP; Iijima Electronics Co., Aichi, Japan) was mounted and sealed in a flask containing 64 ml of DO-saturated 100 mM phosphate buffer (pH 7.8) with 19 mM (NH4)2SO4 at 25°C. A 500-μl aliquot of the cell suspension was injected into the flask and was preincubated for 10 min with agitation by using a stirrer magnet. Allylthiourea was added after the preincubation, and the incubation was continued. A small aliquot of reaction mixture was removed from the flask and used to measure bioluminescence and NO2− concentration. The time-dependent change of DO concentration was monitored by DO meter (GU-BMP; Iijima Electronics Co.) with a pen chart recorder. All operations were carefully performed to prevent contamination of the flask with air. The O2 uptake rate (in micromoles per minute) was calculated by the change in DO concentration at 1-min intervals. The NO2− production rate (in micromoles per minute) was calculated by the change in NO2− concentration at 5-min intervals.
Analytical methods.
Protein concentration was measured by using a bicinchoninic acid protein assay kit (Pierce, Rockford, Ill.) after the cells were solubilized in 0.1% sodium dodecyl sulfate for 10 min at 37°C (22). Bovine serum albumin was used as the standard. NO2− concentration was measured by a colorimetric assay (7).
RESULTS
Expression of the luxAB genes in N. europaea.
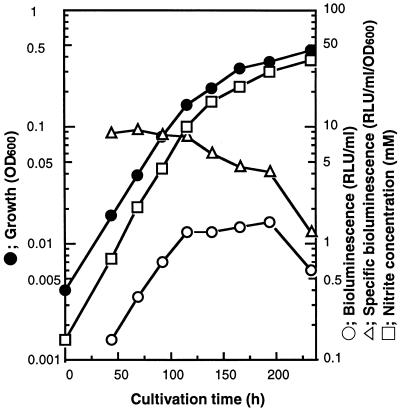
Cultivation of N. europaea(pHLUX20) was performed by using a jar fermentor. Significant bioluminescence was observed, as shown in Fig. 2, indicating that the luxAB genes had been successfully expressed in N. europaea. The specific bioluminescence value was constant (about 8 to 10 RLU/ml/unit of optical density at 600 nm [OD600]) up to a NO2− concentration of about 10 mM in the early- and mid-logarithmic phases but gradually declined in the late-logarithmic phase.
FIG. 2.
Results of cultivation of N. europaea(pHLUX20). N. europaea(pHLUX20) was grown in P medium by using a 5-liter jar fermentor with a working volume of 3.5 liters at 30°C. Details of cultivation conditions are given in Materials and Methods. Cell growth was monitored at 600 nm with cuvettes of a 50-mm light path. Bioluminescence was measured by a model 20e luminometer (Turner Design Co.) as described in Materials and Methods. The nitrite concentration of the culture supernatant was measured by colorimetric assay (7).
Effect of AMO inhibitor on bioluminescence in N. europaea.
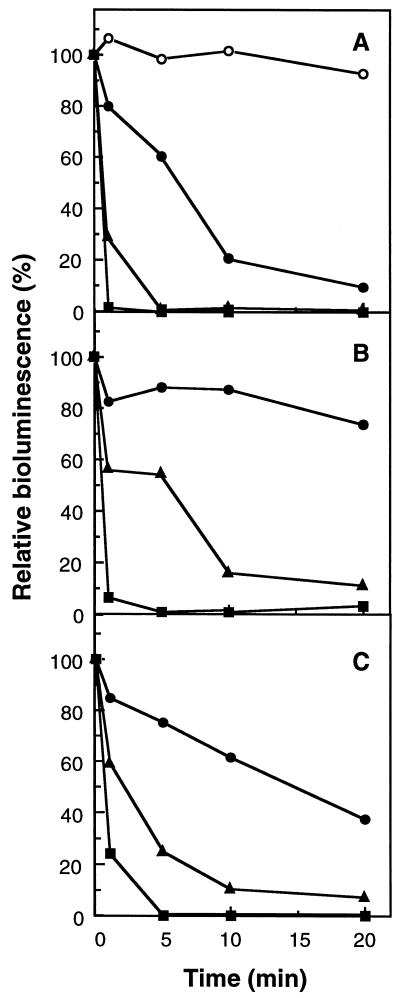
The effects of AMO inhibitors on bioluminescence in N. europaea(pHLUX20) were examined. Allylthiourea is a potent and specific inhibitor for AMO due to the fact that it binds to copper in the active center of AMO (2, 9). When allylthiourea was added to the culture broth of N. europaea(pHLUX20), the intensity of the light emission was slightly decreased, as shown in Fig. 3A. The inhibition response was time and dose dependent. At a final concentration of 0.1 μM allylthiourea, the intensity of the light emission was reduced to 10% after 20 min of incubation, and only 2% of the light emission remained in the cell within 5 min at a concentration of 1 μM. Similar results were found when phenol or nitrapyrin was added to the culture. A low concentration of phenol may reversibly and competitively inhibit AMO activity, because it is oxidized by AMO as an alternative substrate in place of ammonia, resulting in hydroquinone (11). Nitrapyrin also inhibits AMO by acting as an alternative substrate. Moreover, the resulting oxidized compounds behave as protein-modifying agents that irreversibly inactivate not only AMO but also other proteins in the cell (26). In the presence of 100 μM phenol or 10 μM nitrapyrin, the intensity of the light emission declined to less than 5% of the initial value within 5 min, as shown in Fig. 3B and C. On the other hand, compounds noninhibitory for nitrification (9) did not affect bioluminescence. There was no significant loss of light emission in the presence of 5 mM DMSO, 1 mg of glycerol/ml, 1 mg of sodium acetate/ml, or 1 mg of bovine serum albumin/ml (final concentrations) (data not shown). These results indicated that AMO inhibitors strongly inhibited the bioluminescence of N. europaea(pHLUX20) at very low concentrations regardless of their mechanisms of inhibition of AMO.
FIG. 3.
Effects of AMO inhibitors on bioluminescence in N. europaea(pHLUX20). An aliquot (0.95 ml) of the culture broth of N. europaea(pHLUX20) was placed in a test tube, and 50 μl of test sample was added. After incubation for 1 to 20 min at 25°C, the bioluminescence of the incubation mixture was measured. The bioluminescence of the control reaction just after the addition of water instead of inhibitor was 1.02 RLU/ml and is defined as 100% relative bioluminescence. Values are averages from three independent experiments. (A) Effect of allylthiourea. ○, control (H2O addition); •, 0.1 μM; ▴, 1 μM; ■, 10 μM. (B) Effect of phenol. •, 1 μM; ▴, 10 μM; ■, 100 μM. (C) Effect of nitrapyrin. •, 0.1 μM; ▴, 1 μM; ■, 10 μM. Inhibitor concentrations given are final concentrations in the incubation mixture.
Bioluminescence reflects ammonia-oxidizing activity.
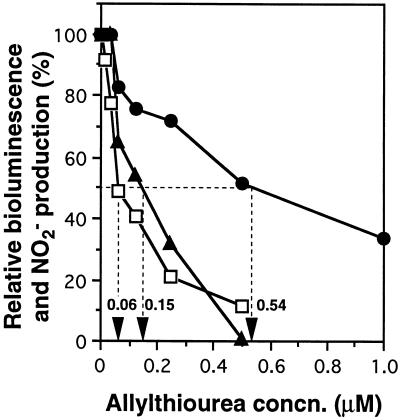
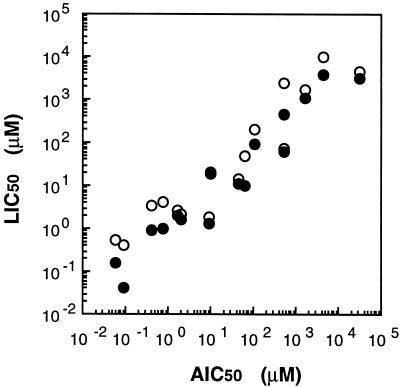
We attempted to clarify whether the intensity of bioluminescence reflected the inhibition of ammonia oxidation activity by various nitrification inhibitors and toxic compounds, including a HAO inhibitor (formaldehyde) and nonspecific inhibitors such as a heavy metal (HgCl2) and respiratory inhibitors (Na2S and NaN3), as well as AMO inhibitors (9, 27). We also used 2,4-dinitrophenol and pentachlorophenol as uncouplers. In the strict sense, uncouplers inhibit not only ATP-dependent pyridine nucleotide reduction in N. europaea but also the AMO-mediated ammonia oxidation process (1, 9). To evaluate the effect of each inhibitor on both activities, we used measurement of LIC50 and AIC50. Figure 4 shows the dose-response curve of allylthiourea and the LIC50s and AIC50s obtained from the graphed data. The LIC50s of allylthiourea were 0.54 and 0.15 μM when the incubation times were 1 and 5 min, respectively, and the AIC50 was 0.06 μM when the incubation time was 30 min. As shown in Table 1, 16 compounds had various AIC50s. Although allylthiourea and thioacetamide were strong inhibitors of AMO and inhibited ammonia-oxidizing activity at concentrations in the order of 10−2 μM, dicyandiamide and methanol were weak inhibitors and their AIC50s were 4.5 and 32.6 mM. These compounds also decreased light emission. A strong correlation was found between the LIC50s and AIC50s over 6 orders of magnitude, as shown in Fig. 5. These results indicated that the change in light emission reflected the inhibitory effect on ammonia-oxidizing activity not only of AMO inhibitors but also of nonspecific and HAO inhibitors. Furthermore, it is interesting that the bioluminescence response indicated the presence of a low concentration of inhibitor after only a few minutes, while the NO2− production rate was similarly affected after 30 min of incubation.
FIG. 4.
Dose-response curve of allylthiourea and determination of the LIC50s and AIC50s. The strength of inhibition of light emission in N. europaea (pHLUX20) was expressed as the LIC50, which was calculated from the graphed data as 0.54 and 0.15 μM when the reaction mixture was incubated for 1 (•) and 5 (▴) min, respectively. On the other hand, the strength of inhibition of ammonia-oxidizing activity in N. europaea was expressed as the AIC50, which was calculated as 0.06 μM for the 30-min incubation (□). Values are averages from three independent experiments.
TABLE 1.
LIC50s and AIC50sa of several nitrification inhibitors
| Inhibitor | LIC50 (μM) with an incubation time of:
|
AIC50 (μM)b | |
|---|---|---|---|
| 1 min | 5 min | ||
| Allylsulfide | 1.8 | 1.3 | 9.2 |
| Allylthiourea | 0.54 | 0.15 | 0.06 |
| Dicyandiamide | 9,790 | 3,840 | 4,530 |
| 2,4-Dinitrophenol | 71.2 | 62.6 | 539 |
| Formaldehyde | 1,680 | 1,110 | 1,750 |
| HgCl2 | 2.7 | 2.1 | 1.7 |
| Methanol | 4,440 | 3,230 | 32,600 |
| NaN3 | 2,330 | 460 | 562 |
| Na2Sc | 47.5 | 10.3 | 67.1 |
| Nitrapyrin | 4.1 | 0.74 | 0.76 |
| Pentachlorophenol | 13.7 | 10.6 | 45.5 |
| Phenol | 19.8 | 18.0 | 10.4 |
| Picolinic acid | 199 | 91 | 11.9 |
| 8-Quinolinol | 2.0 | 1.7 | 2.1 |
| Thioacetamide | 0.41 | 0.04 | 0.09 |
| Thiosemicarbazided | 3.6 | 0.9 | 0.4 |
LIC50s and AIC50s were calculated from graphed data of dose-response experiments as shown in Fig. 4.
Determined after 30 min of incubation.
Na2S · 9H2O was used.
Thiosemicarbazide hydrochloride was used.
FIG. 5.
Correlation between LIC50s and AIC50s. Sixteen different nitrification inhibitors and toxic compounds were used. Data were plotted as shown in Table 1. LIC50s were determined by incubations of 1 (○) and 5 (•) min.
Comparison of the ammonia-oxidizing rate and bioluminescence in the presence of inhibitor.
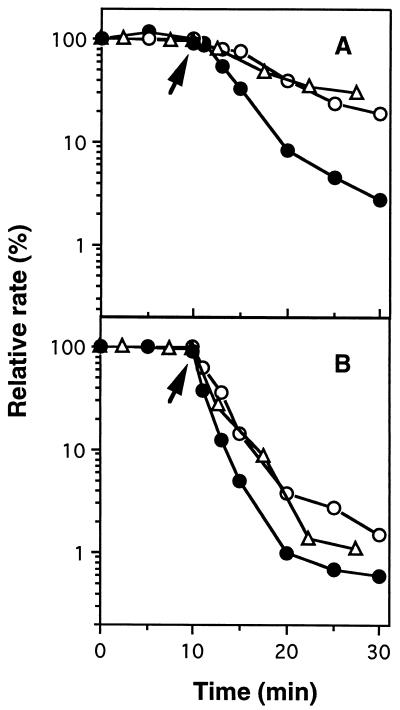
N. europaea(pHLUX20) cells were incubated in a DO electrode-mounted flask. When the steady-state rate of O2 uptake activity was established, allylthiourea was added to the reaction mixture, and the NO2− concentration and bioluminescence were measured simultaneously. There was no significant difference between the changes in the O2 uptake rate and the NO2− production rate, but the change in bioluminescence was faster than those in both rates, as shown in Fig. 6. Within 5 min after the addition of 0.1 μM allylthiourea, the intensity of the light emission decreased to 30% of the initial value, but about 70% of the O2 uptake and NO2− production rates remained (Fig. 6A). After 15 min of incubation, we observed a decline in the O2 uptake and NO2− production rates to about 30% of each of the initial rates. These results confirmed that the response of bioluminescence to the inhibitor took place faster than the response of the ammonia-oxidizing rate, as measured by both the O2 uptake and NO2− production rates. A similar finding was also observed in the experiment using 0.5 μM allylthiourea (Fig. 6B).
FIG. 6.
Comparison of bioluminescence and the ammonia-oxidizing rate in the presence of allylthiourea. The intensity of bioluminescence (•) and the ammonia-oxidizing rate, which was measured as both the O2 uptake rate (○) and the NO2− production rate (▵), were expressed as relative ratios. An N. europaea(pHLUX20) cell suspension (2.0 mg of protein/ml) of 500 μl was injected into the DO electrode-mounted flask containing 64 ml of 100 mM phosphate buffer (pH 7.8) with 19 mM (NH4)2SO4 (time zero) and was preincubated for 10 min with agitation by using a stirrer magnet at 25°C to establish the steady-state O2 uptake rate. Allylthiourea was then added at final concentrations of 0.1 (A) and 0.5 (B) μM after preincubation (indicated by arrows), and subsequent incubation was continued under the same conditions. The initial intensity of bioluminescence was 1,090 RLU/mg of protein. Steady-state rates of O2 uptake and NO2− production were 0.71 and 0.43 μmol/min/mg of protein, respectively. Values are averages from at least two independent experiments.
Effect of HAO substrates on bioluminescence.
The bacterial luminescence assay has been used for toxicity testing because toxic agents destroy the membrane, proteins, and several cellular metabolic pathways, resulting in the disappearance of light emission (5, 24, 31). However, in the assay described in this study, the disappearance of light emission was likely to depend only on inhibition of AMO activity rather than of other cellular metabolic pathways, when AMO inhibitor was added. We suspected that the specific inhibition of AMO resulted in the disappearance of light emission because of the limitation of the reducing power in the cell, because FMNH2 was necessary for the bacterial luciferase reaction and is generated by using the reducing power obtained from ammonia. To clarify this assumption, the effects of HAO substrates on light emission were examined. When intact cells were incubated with hydroxylamine or hydrazine, the intensity of bioluminescence increased by approximately 3 and 1.4 times the initial value, respectively (Table 2). Although allylthiourea-treated cells exhibited only 4.7% of the initial light emission value for intact cells, bioluminescence was immediately recovered by the addition of hydroxylamine or hydrazine. Interestingly, the recovered light emission was about 1.5 to 2 times stronger than the light emission produced by hydroxylamine- and hydrazine-utilizing intact cells. Similar results were also observed in phenol-treated cells with HAO substrates. These results indicate that the electron transfer pathway from HAO to luciferase is almost independent of the presence of allylthiourea and phenol and that the decrease in light emission could be caused by the prevention of electron flow within the cell due to the inhibition of the AMO reaction.
TABLE 2.
Effects of HAO substrates on bioluminescence in N. europaea(pHLUX20)a
| Cell conditionb | Concn of HAO substratec | Bioluminescenced (RLU/ml) | Relative ratioe (%) |
|---|---|---|---|
| Intact | None | 30.1 | 100 |
| 0.2 mM hydroxylamine | 89.2 | 296 | |
| 1 mM hydrazine | 41.1 | 137 | |
| Allylthiourea treated | None | 1.4 | 4.7 |
| 0.2 mM hydroxylamine | 111.8 | 371 | |
| 1 mM hydrazine | 89.9 | 299 | |
| Phenol treated | None | 3.1 | 10.3 |
| 0.2 mM hydroxylamine | 78.8 | 262 | |
| 1 mM hydrazine | 76.2 | 253 |
Inhibitor solution (10 μl) was added to 1 ml of N. europaea(pHLUX20) cell suspension (64 μg of protein/ml) in P medium. After incubation for 10 min at 25°C, HAO substrate solution (10 μl) was added. The bioluminescence of the mixture was measured after 1 min of incubation.
Allylthiourea and phenol were used at final concentrations of 1 and 50 μM, respectively.
Final concentrations are given.
Values are averages from three independent experiments.
The intensity of light emission in intact cells without inhibitor is taken as 100%.
DISCUSSION
The luxAB genes derived from V. harveyi were successfully expressed in N. europaea by transcriptional control of the promoter of the hao gene. Although there are only a few reports of the promoter sequence of N. europaea (3, 12, 18, 21), the hao promoter is one of the functionally well-characterized promoters. Because expression of the hao gene can be induced by the presence of ammonia (21), the hao promoter is thought to be suitable for the expression of foreign genes under normal growing conditions in N. europaea. Although the specific luciferase activity showed a constant ratio up to mid-logarithmic phase, it decreased in late-logarithmic phase. This phenomenon is not always caused by a decrease in the expression of luciferase, because the intensity of the light emission is dependent on the reducing power in the cell as described below, as well as on the production of luciferase.
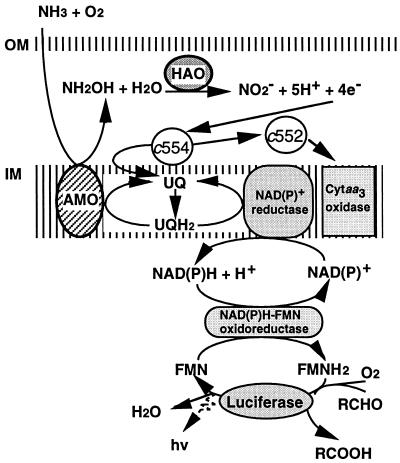
In this study, we demonstrate that the change in light emission reflected the inhibitory effect on AMO activity of AMO inhibitors, as well as the destruction of other cellular metabolic pathways by nonspecific inhibitors. The decrease in light emission brought about by AMO inhibitors is thought to be caused by prevention of electron flow due to inhibition of the AMO reaction. In the bacterial luciferase reaction, FMNH2 is generated from NADH or NADPH by a reaction catalyzed by NAD(P)H-FMN oxidoreductase, which is a ubiquitous enzyme found in several bacteria and is also present in N. europaea (17). If the quantities of luciferase and NAD(P)H-FMN oxidoreductase are constant in the cell, the intensity of bioluminescence depends on the concentration of NAD(P)H. In N. europaea, NAD(P)H is required for several enzyme reactions, for example, fixation of CO2. Although there are some enzymes, such as glutamate dehydrogenase (28), which may reduce NAD(P)+ by the oxidation of organic compounds, NAD(P)H is thought to be produced mainly by the reducing power created by the oxidation of hydroxylamine from the HAO reaction (4, 10, 30). Therefore, when AMO is inhibited by a nitrification inhibitor, the series of electron transfer pathways initiated by ammonia oxidation is terminated, leading to a drastic decrease in NAD(P)H concentration. Thus, the degree of AMO inhibition can be measured by monitoring the intracellular NAD(P)H concentration by use of the in vivo bacterial luciferase reaction. The integration of electron transport is shown in Fig. 7.
FIG. 7.
Hypothetical model of interaction between the electron transfer pathways and the luciferase reaction in N. europaea. The nitrification pathway is based on that proposed by Wood (30) and Hooper et al. (10). NAD(P)+ reductase and NAD(P)H-FMN oxidoreductase have not been identified in N. europaea. HAO generates reducing power by the oxidation of hydroxylamine, which is produced by the preceding oxidation of ammonia by AMO. The reducing power is then transferred to ubiquinone (UQ) via cytochrome c-554 (c554), and the resulting ubiquinol (UQH2) is thought to supply reducing power for the maintenance of the AMO reaction and the reduction of NAD(P)+. The remaining electrons from cytochrome c-554 may pass through cytochrome c-552 (c552) to cytochrome aa3 oxidase (Cytaa3 oxidase). NAD(P)+ is reduced by reverse electron transfer, which needs energy supplied by the hydrolysis of ATP. The reducing power for the luciferase reaction must be obtained from FMNH2, which is generated from the reduction of FMN in the NAD(P)H-FMN oxidoreductase reaction by using the reducing power of NAD(P)H. OM and IM, outer and inner membranes, respectively.
As shown in Fig. 6, loss of the intensity of the light emission due to AMO inhibitors is a sensitive reaction compared with the decrease in the O2 uptake and nitrite production rates. The reason for this difference is unclear. The reducing power generated from hydroxylamine by HAO is thought to pass through cytochrome c-554 to both cytochrome aa3 oxidase and ubiquinone (10, 16). The reducing power of the resulting ubiquinol appears to be used for the reduction of NAD(P)+, as well as for the maintenance of the AMO reaction (10). However, the reduction of NAD(P)+ by ubiquinol is an energy-consuming process called “reverse electron transfer,” and only a few electrons are likely to be used for this reaction (1, 30). When the reducing power decreases, the remaining electrons may be predominantly transferred to the cytochrome aa3 oxidase and the maintenance of the AMO reaction rather than NAD(P)+, resulting in a rapid decrease in the intensity of light emission.
When intact cells were incubated with hydroxylamine or hydrazine, an increase in the intensity of light emission was observed. This result suggests that the supply of reducing power is insufficient for luciferase to exhibit maximum activity under ammonia-utilizing growth conditions. The bioluminescence of allylthiourea-treated cells was recovered by the addition of hydroxylamine or hydrazine. The intensity of the recovered light emission was about 1.5 to 2 times higher than that produced by hydroxylamine- and hydrazine-utilizing intact cells. This phenomenon could be explained by the assumption that luciferase can utilize the excess reducing power gained from the prevention of electron flow to maintain the AMO reaction, resulting in an increase in the intensity of light emission. Although the bioluminescence of phenol-treated cells was also recovered by the addition of HAO substrates, the intensity of light emission was lower than in allylthiourea-treated cells. At low concentrations, phenol acts as a competitive inhibitor of AMO (11, 14). Typically, however, it is known to be a toxic compound that denatures proteins and membranes at high concentrations. At 50 μM, phenol is thought to function not only as an AMO inhibitor but also as a toxic compound which inhibits certain cellular metabolic pathways. A similar result was that an AMO activity of 40% was irreversibly inactivated when cells were treated with 300 μM phenol for 5 h (14).
The development of a rapid and sensitive bioassay which can evaluate overall ammonia-oxidizing activity and its inhibition has long been anticipated. This bioassay can be applied in the operational maintenance of wastewater treatment plants to help ensure effective treatment. By the conventional methods, inhibition of ammonia oxidation has been judged by the measurement of the O2 uptake rate or the NO2− production rate of ammonia-oxidizing bacteria (19, 23). However, measurement of these parameters requires several time-consuming and/or complicated steps. We propose that the luminous Nitrosomonas assay described in this paper is a more effective method for the detection of nitrification inhibitors, and for monitoring the nitrification process in wastewater treatment plants, because this luminescence reaction is more rapid and sensitive than conventional methods.
Several nitrification inhibitors are likely to be toxic to animals and other microorganisms. As mentioned above, the AMO activity of ammonia oxidizers is particularly susceptible to inhibition by a wide range of compounds at low concentrations. Categories of AMO inhibitors include halogenated compounds and oxidative phosphorylation inhibitors, and such compounds are toxic to several animals and microorganisms (2, 9, 10). Eckenfelder reported that nitrification inhibitors are generally related to biologically toxic compounds (8), as evidenced by the fact that the profile of the inhibition of Nitrosomonas by various chemical compounds correlates with the results of the Microtox test, a commercial toxicity-testing system based on the bioluminescence of Photobacterium phosphoreum (5). In practice, a biosensor using a DO electrode with immobilized whole N. europaea cells has been applied to the on-line monitoring of drinking-water toxicity in Japanese water purification plants (25). We anticipate that the luminous Nitrosomonas system will be used not only for the monitoring of nitrification but also for monitoring of the toxicity of harmful materials in environmental samples and for evaluation of the safety of industrial products.
REFERENCES
- 1.Aleem M I H. Generation of reducing power in chemosynthesis. II. Energy linked reduction of pyridine nucleotide in the chemoautotroph Nitrosomonas europaea. Biochim Biophys Acta. 1966;113:216–224. doi: 10.1016/s0926-6593(66)80062-0. [DOI] [PubMed] [Google Scholar]
- 2.Bédard C, Knowles R. Physiology, biochemistry, and specific inhibitors of CH4, NH4+, and CO oxidation by methanotrophs and nitrifiers. Microbiol Rev. 1989;53:68–84. doi: 10.1128/mr.53.1.68-84.1989. [DOI] [PMC free article] [PubMed] [Google Scholar]
- 3.Bergmann D J, Arciero D M, Hooper A B. Organization of the hao gene cluster of Nitrosomonas europaea: genes for two tetraheme c cytochromes. J Bacteriol. 1994;176:3148–3153. doi: 10.1128/jb.176.11.3148-3153.1994. [DOI] [PMC free article] [PubMed] [Google Scholar]
- 4.Berks B C, Ferguson S J, Moir J W B, Richardson D J. Enzyme and associated electron transport systems that catalyse the respiratory reduction of nitrogen oxides and oxyanions. Biochim Biophys Acta. 1995;1232:97–173. doi: 10.1016/0005-2728(95)00092-5. [DOI] [PubMed] [Google Scholar]
- 5.Bulich A A, Greene M W, Isenberg D L. A practical and reliable method for monitoring the toxicity of aquatic samples. Process Biochem. 1982;17:45–47. [Google Scholar]
- 6.Cohn D H, Mileham A J, Simon M I, Nealson K H, Rausch S K, Bonam D, Baldwin T O. Nucleotide sequence of the luxA gene of Vibrio harveyi and the complete amino acid sequence of the α subunit of bacterial luciferase. J Biol Chem. 1985;260:6139–6146. [PubMed] [Google Scholar]
- 7.Eaton A D, Clesceri L S, Greenberg A E, editors. Standard methods for the examination of water and wastewater. 19th ed. Washington, D.C: American Public Health Association; 1995. pp. 4-83–4-84. [Google Scholar]
- 8.Eckenfelder W W. Toxicity reduction methodologies—biological toxicant control. In: Ford D L, editor. Toxicity reduction: evaluation and control. Lancaster, Pa: Technomic Publishing Co., Inc.; 1992. pp. 67–108. [Google Scholar]
- 9.Hooper A B, Terry K R. Specific inhibitors of ammonia oxidation in Nitrosomonas. J Bacteriol. 1973;115:480–485. doi: 10.1128/jb.115.2.480-485.1973. [DOI] [PMC free article] [PubMed] [Google Scholar]
- 10.Hooper A B, Vannelli T, Bergmann D J, Arciero D M. Enzymology of the oxidation of ammonia to nitrite by bacteria. Antonie Leeuwenhoek. 1997;71:59–67. doi: 10.1023/a:1000133919203. [DOI] [PubMed] [Google Scholar]
- 11.Hyman M E, Sansone-Smith A W, Shears J H, Wood P M. A kinetic study of benzene oxidation to phenol by whole-cells of Nitrosomonas europaea and evidence for the further oxidation of phenol to hydroquinone. Arch Microbiol. 1985;143:302–306. [Google Scholar]
- 12.Iizumi T, Nakamura K. Cloning, nucleotide sequence, and regulatory analysis of the Nitrosomonas europaea dnaK gene. Appl Environ Microbiol. 1997;63:1777–1784. doi: 10.1128/aem.63.5.1777-1784.1997. [DOI] [PMC free article] [PubMed] [Google Scholar]
- 13.Johnston T C, Thompson R B, Baldwin T O. Nucleotide sequence of the luxB gene of Vibrio harveyi and the complete amino acid sequence of the β subunit of bacterial luciferase. J Biol Chem. 1986;261:4805–4811. [PubMed] [Google Scholar]
- 14.Keener W K, Arp D J. Transformation of aromatic compounds by Nitrosomonas europaea. Appl Environ Microbiol. 1994;60:1914–1920. doi: 10.1128/aem.60.6.1914-1920.1994. [DOI] [PMC free article] [PubMed] [Google Scholar]
- 15.Lewis R F, Pramer D. Isolation of Nitrosomonas in pure culture. J Bacteriol. 1958;76:524–528. doi: 10.1128/jb.76.5.524-528.1958. [DOI] [PMC free article] [PubMed] [Google Scholar]
- 16.McTavish H, Arciero D M, Hooper A B. Interaction with membranes of cytochrome c554 from Nitrosomonas europaea. Arch Biochem Biophys. 1995;324:53–58. doi: 10.1006/abbi.1995.9930. [DOI] [PubMed] [Google Scholar]
- 17.Meighen E A. Molecular biology of bacterial bioluminescence. Microbiol Rev. 1991;55:123–142. doi: 10.1128/mr.55.1.123-142.1991. [DOI] [PMC free article] [PubMed] [Google Scholar]
- 18.Nejidat A, Spector O, Abeliovich A. Isolation and characterization of a functional promoter from Nitrosomonas europaea. FEMS Microbiol Lett. 1996;137:9–512. doi: 10.1111/j.1574-6968.1996.tb08074.x. [DOI] [PubMed] [Google Scholar]
- 19.Painter H A. Nitrification in the treatment of sewage and waste-water. In: Prosser J I, editor. Nitrification. Oxford, United Kingdom: IRL Press; 1986. pp. 185–211. [Google Scholar]
- 20.Sanger F, Nicklen S, Coulson A R. DNA sequencing with chain-terminating inhibitors. Proc Natl Acad Sci USA. 1977;74:5463–5467. doi: 10.1073/pnas.74.12.5463. [DOI] [PMC free article] [PubMed] [Google Scholar]
- 21.Sayavedra-Soto L A, Hommes N G, Arp D J. Characterization of the gene encoding hydroxylamine oxidoreductase in Nitrosomonas europaea. J Bacteriol. 1994;176:504–510. doi: 10.1128/jb.176.2.504-510.1994. [DOI] [PMC free article] [PubMed] [Google Scholar]
- 22.Smith P K, Krohn R I, Harmanson G T, Mallia A K, Gartner F H, Provenzano M D, Fujimoto E K, Goeko N M, Olson B J, Klenk D C. Measurement of protein using bicinchoninic acid. Anal Biochem. 1985;150:76–85. doi: 10.1016/0003-2697(85)90442-7. [DOI] [PubMed] [Google Scholar]
- 23.Stensel H D, McDowell C S, Ritter E D. An automated nitrification biological toxicity test. J Water Pollut Control Fed. 1976;48:2343–2350. [PubMed] [Google Scholar]
- 24.Stewart G S A B, Williams P. lux genes and applications of bacterial bioluminescence. J Gen Microbiol. 1992;138:1289–1300. doi: 10.1099/00221287-138-7-1289. [DOI] [PubMed] [Google Scholar]
- 25.Tanaka Y, Tada H, Tanaka H, Nakamura E. Establishment of bioassay method using nitrifying bacteria and development of biosensor. J Jpn Soc Water Environ. 1997;20:387–388. . (In Japanese.) [Google Scholar]
- 26.Vannelli T, Hooper A B. Oxidation of nitrapyrin to 6-chloropicolinic acid by the ammonia-oxidizing bacterium Nitrosomonas europaea. Appl Environ Microbiol. 1992;58:2321–2325. doi: 10.1128/aem.58.7.2321-2325.1992. [DOI] [PMC free article] [PubMed] [Google Scholar]
- 27.Voysey P A, Wood P M. Methanol and formaldehyde oxidation by an autotrophic nitrifying bacterium. J Gen Microbiol. 1987;133:283–290. [Google Scholar]
- 28.Wallace W, Nicholas D J D. Glutamine dehydrogenase in Nitrosomonas europaea and the effects of hydroxylamine, oximes and related compounds on its activity. Biochim Biophys Acta. 1969;171:229–237. doi: 10.1016/0005-2744(69)90156-9. [DOI] [PubMed] [Google Scholar]
- 29.Wood L B, Hurley B J E, Matthews P J. Some observations on the biochemistry and inhibition of nitrification. Water Res. 1981;15:543–551. [Google Scholar]
- 30.Wood P M. Nitrification as a bacterial energy source. In: Prosser J I, editor. Nitrification. Oxford, United Kingdom: IRL Press; 1986. pp. 39–62. [Google Scholar]
- 31.Yates I E, Porter J K. Bacterial luminescence as a bioassay for mycotoxins. Appl Environ Microbiol. 1982;44:1072–1075. doi: 10.1128/aem.44.5.1072-1075.1982. [DOI] [PMC free article] [PubMed] [Google Scholar]


