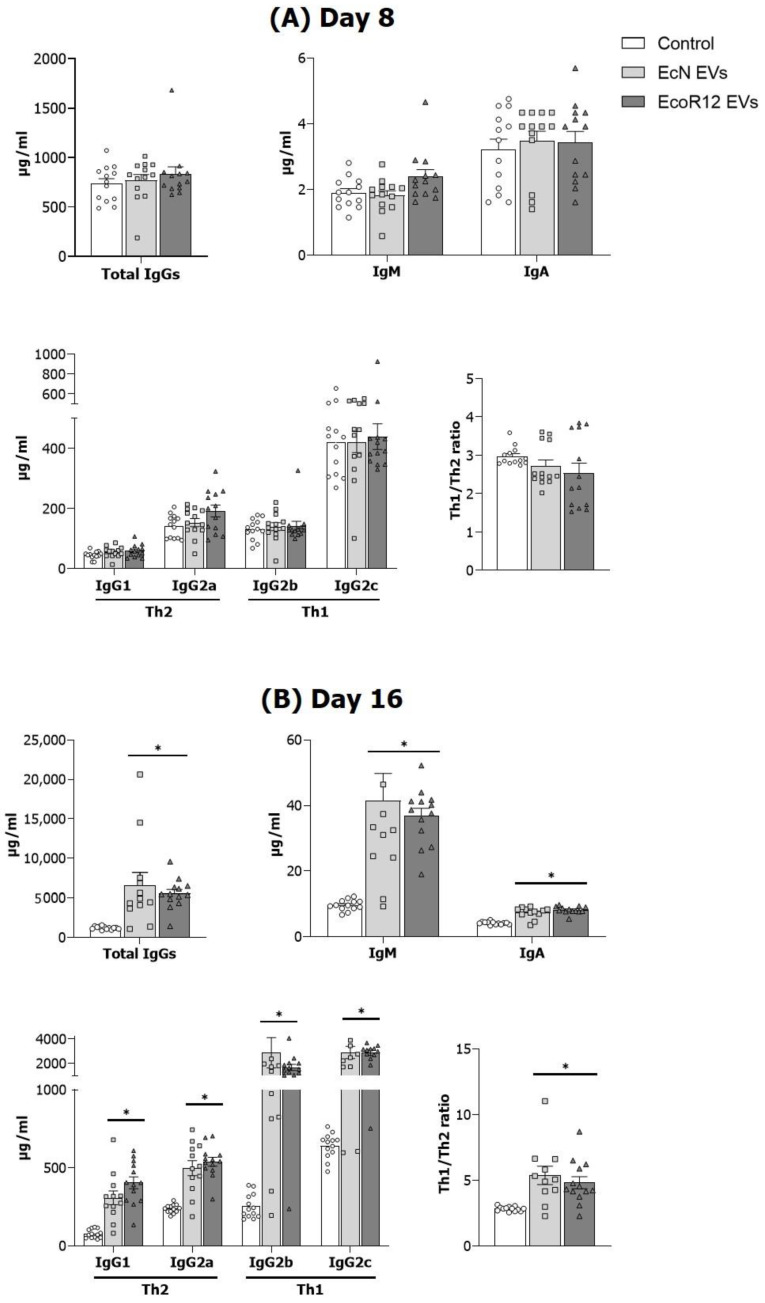
Figure 2.
Effect of the interventions with EcN and EcoR12 EVs on the Ig levels in plasma on days 8 (A) and 16 (B). The three experimental groups were: Control (white bars), EcN EVs (light gray bars), and EcoR12 EVs (dark gray bars). The Th1/Th2 Ig ratio applies to the relation (IgG2b + IgG2)/(IgG1 + IgG2a). Results are expressed as ± SEM (n = 12 animals/group at both days 8 and 16). Statistical differences: * p < 0.05 compared to control (by post hoc Dunn’s multiple comparison test).

