Abstract
Background
Perfusion imaging is one of the methods used to grade glial neoplasms, and in this study we evaluated the role of ASL perfusion in grading brain glioma.
Purpose
The aim is to evaluate the role of arterialized cerebral blood volume (aCBV) of multi-delay ASL perfusion for grading glial neoplasm.
Materials and methods
This study is a prospective observational study of 56 patients with glial neoplasms of the brain who underwent surgery, and only cases with positive diagnosis of glioma are included to evaluate the novel diagnostic parameter.
Results
In the study, ASL-derived normalized aCBV (naCBV) and T2*DSC-derived normalized CBV (nCBV) are showing very high correlation (Pearson’s correlation coefficient value of 0.94) in grading glial neoplasms. naCBV and nCBF are also showing very high correlation (Pearson’s correlation coefficient value of 0.876). The study also provides cutoff values for differentiating LGG from HGG for normalized aCBV(naCBV) of ASL, normalized CBV (nCBV), and normalized nCBF derived from T2* DCS as 1.12, 1.254, and 1.31, respectively. ASL-derived aCBV also shows better diagnostic accuracy than ASL-derived CBF.
Conclusion
This study is one of its kind to the best of our knowledge where multi-delay ASL perfusion-derived aCBV is used as a novel imaging biomarker for grading glial neoplasms, and it has shown high statistical correlation with T2* DSC-derived perfusion parameters.
Keywords: Perfusion magnetic resonance imaging, arterial spin labeling, glioma, cerebral blood volume, T2*dynamic susceptibility contrast
Introduction
Arterial spin-labeled (ASL) perfusion imaging is unique in its ability to use magnetically labeled or tagged blood as an endogenous contrast for perfusion imaging. However, the true potential of ASL with an improved signal-to-noise ratio (SNR) useful for clinical needs is materialized after the advent of modern high-field strength scanners with advanced instrumentation, software, and coil systems. 1 The magnetic labeling of water protons in the blood is done by applying radiofrequency (RF) pulses to invert their net magnetization. Once the tagging is done, the water protons act like diffusible tracers and the images are acquired after an interval called transit time, which is the time taken by flowing blood to reach the area of interest.2–4 Various studies have compared ASL-derived cerebral blood flow (CBF) with perfusion parameters of T2* dynamic susceptibility contrast (DSC) perfusion like rCBV and rCBF and have found a statistically significant correlation in differentiating various grades of glioma.5–9 Recently with the availability of multiple delay ASL, it has become possible to calculate arterial transit time (ATT) with good SNR. Using both ATT and CBF of multi-delay ASL, we can calculate a new parameter, that is, arterialized cerebral blood volume (aCBV). In a study by Wang D et al, they derived aCBV from CBF and ATT by mathematical calculations and studied its utility in acute ischemic stroke to decide on the ischemic core and penumbra based on cutoff values, and it has shown statistically useful results. 10 However, this calculated parameter of ASL, that is, aCBV, has never been utilized before in grading glial neoplasms of the brain. We are interested to evaluate the utility of this particular multi-delay ASL-generated parameter of aCBV in grading glial brain neoplasms. We want to evaluate how this parameter is useful as compared to T2* DSC perfusion parameters for grading glioma of the brain.
Materials and methods
This study was planned as a prospective observational study from Sept 2020 to Apr 2022 evaluating the role of multi-delay ASL (7 post-labeling delays) derived aCBV in grading glioma as compared to T2* DSC-derived parameters and the gold standard being the histopathological grading of glioma. IEC approval was obtained from the institutional ethical committee before commencing the study.
A total of 85 patients underwent brain tumor imaging during the study period out of which histopathological confirmation of diagnosis post-surgery was available for 56 patients. This study population of 56 patients comprised 39 (70%) males and 17 (30%) females. Inclusion criteria for patients include all new or follow-up cases of adults with likely glioma who have not undergone biopsy, definitive surgery or chemo radiotherapy before the imaging is done, and patients with no known contraindications for MRI examination.
Exclusion criteria include pediatric brain neoplasms; patients who underwent definitive surgery, post-radiation, or chemotherapy or cases with recurrence, and also any individual with contraindication for gadolinium administration or for MRI examination.
All the subjects included in the study underwent brain tumor MRI imaging on a 3T GE Discovery MR750w scanner with tumor protocol including T1WI, T2WI, FLAIR, SWAN, and DWI with ADC maps, MRS, multi-planar post-contrast T1WI, and perfusion imaging including multi-delay ASL (7 post-labeling delays) and T2* DSC perfusion imaging. Written informed consent was obtained from patients before undergoing imaging. After the brain tumor imaging protocol is completed, the perfusion data is processed.
ASL is done with 7 delays (post-labeling delays of 1.0, 1.22, 1.48, 1.78, 2.15, 2.63, and 3.32 s) FOV: 22.0, slice thickness 4 mm, bandwidth 62.4, NEX 1. A weighted delay (WD) was calculated and converted into ATT based on the theoretical relationship between WD and ATT. 11
where w(i) is the PLD. The estimation of ATT based on WD through a monotonic function provided a robust solution for pCASL data with 7 PLDs.
CBF at each delay, f(i), was calculated by using the following formula
where is the longitudinal relaxation rate of blood, M0 is the equilibrium magnetization of brain tissue, is the tagging efficiency, is the duration of labeling pulse, and is the blood/tissue partition coefficient. The final CBF was the mean sum of estimated CBF at each PLD.
The equation used for final CBF calculation based on the work of Alsop et al, 12 is as follows:
Factor of 6000 is used to convert units into ml/100 g of brain tissue. is the blood/tissue partition coefficient, TRPD is the repetition time of the saturation recovery proton density calibration sequence, and T1T and T1b are relaxation times of tissue blood (assumed to be 1.2 s and 1.5 s at 3T, respectively). SIcont, SIinv, and SIPD are the signal intensities of corresponding control, label/inverted, and proton density weighted pixels; PLD is the post-labeling delay time between the end of the pCASL inversion component and image acquisition. LT is the labeling time, is the tagging efficiency, KSF is a scaling factor for the perfusion-weighted sequence, and NEXPW is the number of excitations for ASL sequence. For calculation of CBF and arterial transit time (ATT) maps of the multi-delay ASL perfusion, we have used in-build software in the imaging console provided by the vendor which is based on a general kinetic model of perfusion.
Further processing of ASL parameters comprising CBF and ATT is done using a dedicated software in MATLAB version 2018b to calculate arterialized CBV (aCBV).
aCBV is calculated mathematically by multiplying CBF (ml/100 g/min) and ATT (min) to get aCBV (ml/100 g). Assuming brain density is ∼1 g/mL, aCBV values which come in pixel density are expressed as percentage (%). 13
T2* DSC perfusion is performed with Gadolinium contrast at the flow rate of 3 ml/sec followed by the saline chase of 20 ml of saline at the same rate. The imaging parameters being the TR of 2000 ms, TE of 30 ms, flip angle of 60 degrees, NEX 1.0, slice thickness 5 mm, pixel size 2.5 x 2.5 and SAR of 0.10 for head region. Image acquisition takes 2–3 min to take 42 phases of scans (5 phases pre-contrast and 37 phases post-contrast). Perfusion maps of T2*DSC comprising rCBV and rCBF were generated using vendor-provided software, GenIQ in the imaging console.
Thereafter, co-registration of perfusion maps (of various perfusion parameters calculated from ASL and T2* DSC) is done with structural imaging for accurate localization of a lesion and for automated ROI within the same slice prescription. ROIs placed in tumor tissues automatically exclude areas of necrosis, blood vessels, and hemorrhagic foci within the tumor. Control ROI of similar prescribed area for a lesion is placed in the contralateral normal white matter for normalization of values.
The images are analyzed by two independent observers (AA and XX with 27 and 08 years of neuroimaging experience, respectively), and high inter-observer agreement in terms of perfusion parameter calculation and profiling of lesion was obtained (kappa of 0.87).
Stata version 17 software is used for ROC graph generation by calculating and plotting the true positive rate against the false-positive rate for a single classifier at a variety of thresholds. With the same ROC curve, we have also calculated cutoff values for differentiating low-grade from high-grade gliomas. Mean values are used for defining various cutoffs across variables. To study the correlation amongst variable parameters, we have used Pearson’s correlation coefficient, and p<.05 is considered statistically significant in the study.
Results
A total of 56 patients, including 39 males and 17 females, were included in the study after applying inclusion and exclusion criteria. The age of patients in the study ranged from 20 to 69 years with a median age of 45.5 years (inter quartile range of 40.8–58.2 years). Out of the 56 patients of glioma, 30 patients were of low-grade gliomas (13 patients of WHO grade 1 and 17 patients of WHO grade 2) and 26 patients were of high-grade gliomas (12 patients of WHO grade 3 and 14 patients of WHO grade 4). The median age of patients with low-grade gliomas is 44 years (inter quartile range of 40–50.8 years), and for high-grade gliomas the median age is 56.5 years (inter quartile range of 45–63.2 years). The most common presentation in patients of glioma is seizure (64%), followed by headache (59%), motor weakness, and sensory symptoms in about a quarter of patients.
The various parameters of perfusion imaging in glioma calculated from the multi-delay ASL perfusion and T2* DSC perfusion were normalized using contralateral white matter. In the case of ASL perfusion, normalization is done by simply dividing lesion signal intensity (which represents values in percentage) in aCBV maps with the contralateral white matter signal intensity. For T2* DSC perfusion, normalization is done by dividing quantitative values of tumor tissue ROI by contralateral white matter ROI.
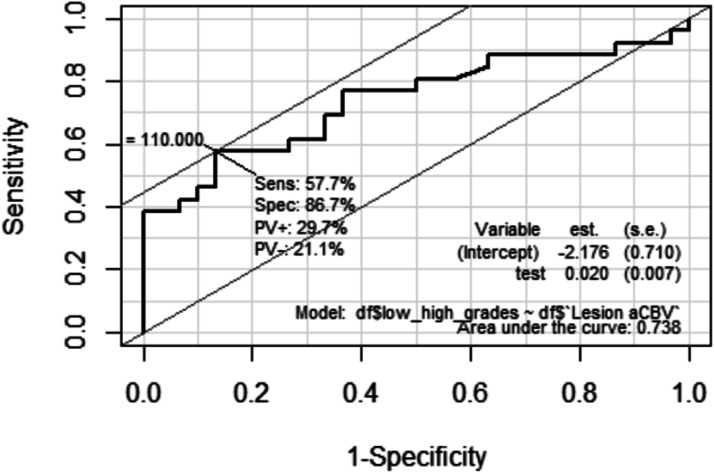
The arterialized CBV (aCBV) signal intensity value (expressed in percentage) calculated from multi-delay ASL in low-grade gliomas (LGGs) is 79.7% (+/−32.9) as compared to 131.9% (+/−67) in high-grade gliomas (HGGs). The absolute cutoff value of signal intensity (representing percentage) in aCBV for differentiating LGG from HGG is 110% with the sensitivity of 57.7%, specificity of 86.7%, and AUC of 0.738.
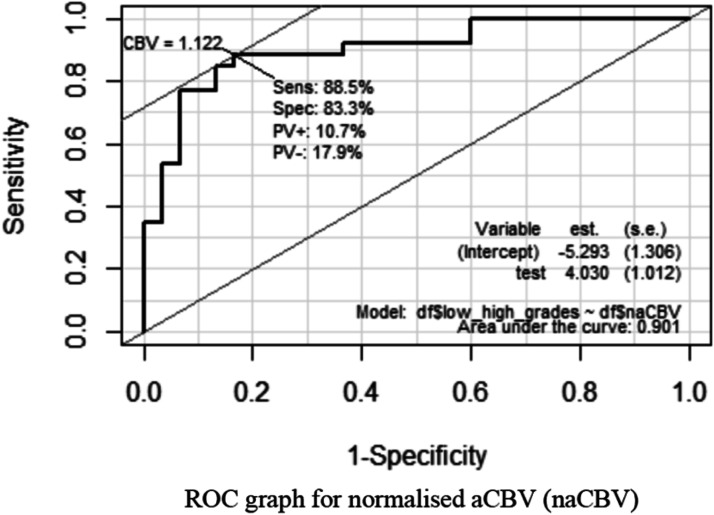
The mean of normalized aCBV (na CBV) value in the LGG group is 0.91 (+/−0.3) as compared to 1.8 (+/−0.7) in the HGG group with 95% confidence interval (p<.05). The cutoff value of normalized aCBV(naCBV) for differentiating LGG from HGG is 1.12 with the sensitivity of 88.5%, specificity of 83.3%, and AUC of 0.901 with 95% confidence interval (p<.05). Figure 1 Legend: ROC graph for normalized aCBV (naCBV).
Figure 1.
Receiver operating curve for normalized arterialized CBV (naCBV).
The absolute cutoff value of rCBV derived from T2* DSC perfusion, for differentiating LGG from HGG, is 1.84 mL/100 gm of the brain tissue with the sensitivity of 73.1%, specificity of 80%, and AUC of 0.796. The cutoff value of the normalized rCBV (nCBV) for differentiating LGG from HGG is 1.254 with the sensitivity of 88.5%, specificity of 90%, and AUC of 0.913 with 95% confidence interval (p<.05).
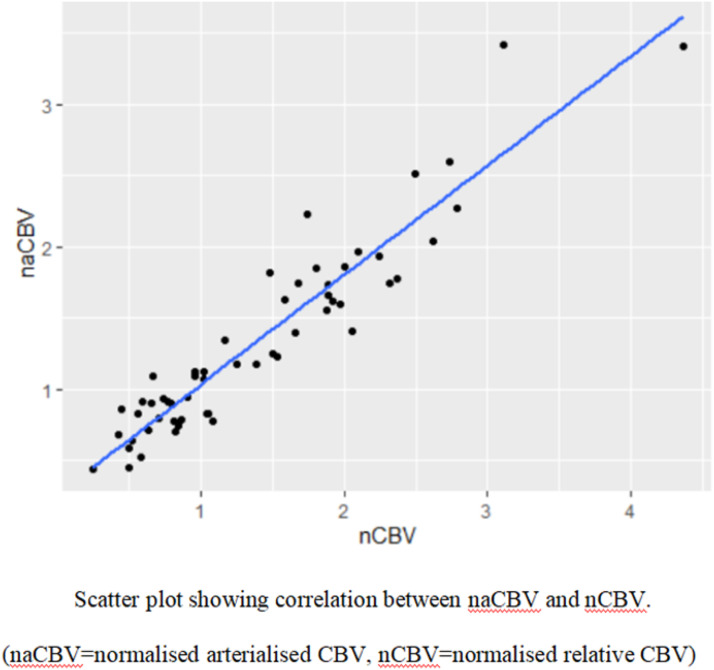
In this study, the statistical evaluation has shown a strong correlation between the ASL-derived aCBV and T2* DSC-derived rCBV with the Pearson’s correlation coefficient of 0.94 (at 95% confidence interval, p<.05), for grading glioma. Figure 2 Legend: Scatter plot showing a statistical correlation between naCBV and nCBV.
Figure 2.
Scatter plot showing correlation between normalized arterialized CBV (naCBV) and normalized CBV (nCBV).
The cutoff value of rCBF derived from T2* DSC for differentiating LGG from HGG is 12.23 mL/min/100 gm of brain tissue with the sensitivity of 76.9%, specificity of 73.3%, and AUC of 0.753. The cutoff value of the normalized nCBF for differentiating LGG from HGG is 1.31 with the sensitivity of 76.9%, specificity of 93.3%, and AUC of 0.895 with 95% confidence interval (p<.05). Figure 3 Legend: ROC graph for normalized CBV (nCBV) Legend 1–3.
Legend 2.
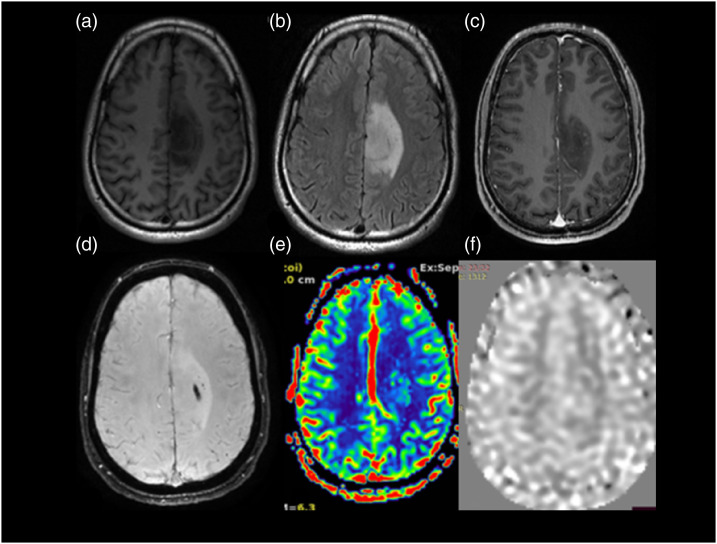
Anaplastic astrocytoma WHO grade 3 IDH mutant. A 56-year-old male with a history of unprovoked complex partial seizure. MRI scan shows FLAIR axial image (Figure (b)) with a hyperintense lesion in the left para central lobule and cingulate gyrus. It shows few foci of nodular enhancement within on T1WI post-contrast images (Figure (c)) and blooming on SWI (Figure (d)). On T2 DSC perfusion imaging (Figure (e)), the lesion shows increased perfusion. The value of normalized rCBV in the region is 1.46. Normalized aCBV (Figure (f)) in the region of tumor is 1.40. On histopathological evaluation, it was anaplastic astrocytoma WHO grade 3-IDH mutant.
Figure 3.
Receiver operating curve for normalised CBV (nCBV).
Legend 1.
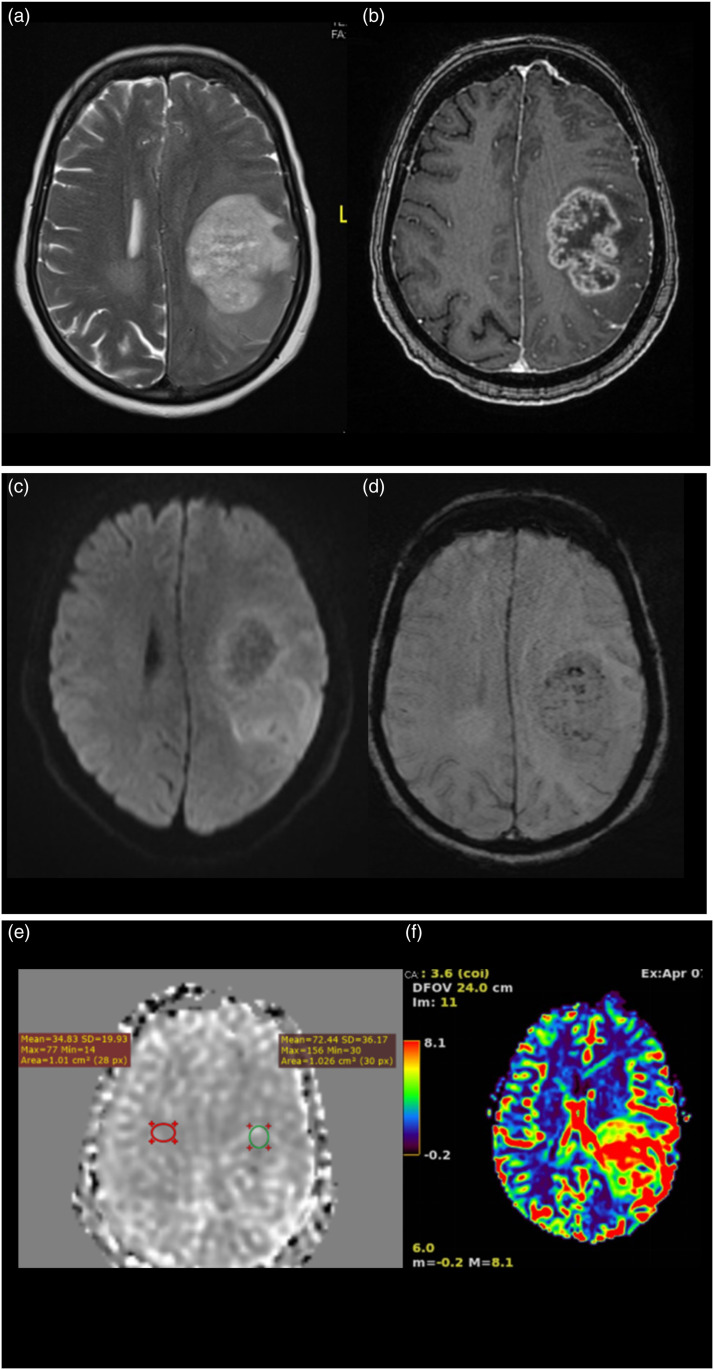
Glioblastoma WHO grade 4 IDH mutant. A 66-year-old female patient presented with headache of 3 months duration with associated episodes of vomiting and no neurological deficits. MRI T2WI axial image (Figure (a)) shows a heterogeneous hyperintense lesion in left frontoparietal region which on post-contrast T1WI (Figure (b)) shows predominantly peripheral enhancement shaggy wall and irregular inner margins. On DWI (Figure (c)) with b values of 1000 m2/s. Images there is heterogeneous restriction of diffusion noted, on SWI (Figure (d)) the lesion shows few foci of blooming within, suggestive of hemorrhagic foci. On ASL perfusion imaging (Figure (e)), the aCBV map shows a normalized aCBV (naCBV) value of 2.86 and T2* DSC-generated normalized rCBV (Figure (f)) value of 2.52 within the lesion at the same location. On histopathological evaluation, it turned out to be glioblastoma WHO grade 4-IDH mutant.
Legend 3.
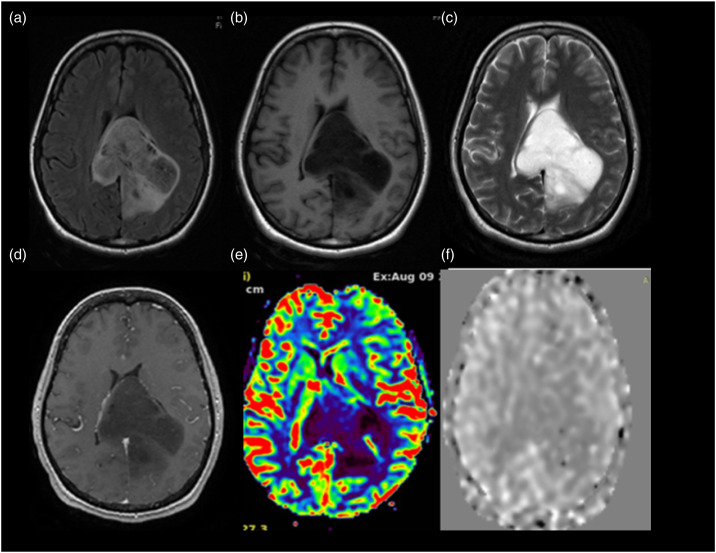
Glioma WHO grade 2 IDH mutant. A 33-year-old female presented with headache of 6 months duration. MRI scan shows a T2WI (Figure (c)) hyperintense lesion in the splenium of corpus callosum with extension on either side of midline with few areas appearing hypointense on FLAIR axial (Figure (a)) suggestive of T2-FLAIR mismatch. It appears hypointense on T1WI (Figure (b)). On perfusion imaging, the lesion shows low perfusion. The value of normalized T2*DSC perfusion rCBV (Figure (e)) in the lesion is 0.76. ASL perfusion (Figure (f)) also shows low value (0.70) of normalized aCBV in the region of tumor which corresponds with the low perfusion on T2* DSC perfusion imaging. On histopathological evaluation, it turned out to be diffuse astrocytoma WHO grade 2-IDH mutant.
Discussion
Brain glioma contributes to significant morbidity and mortality and incurs a huge loss in terms of productivity and quality of life,14,15 and no age group is immune to it.16,17 Despite the availability of best treatment options and management, the outcome in a majority of high-grade glial neoplasms remains unfavorable both in terms of 5-year survival and the disease-free interval.18,19 Neuroimaging has a pivotal role not only in the diagnosis and in defining the extent of disease but may also help in planning appropriate management by grading of glioma.20,21
One of the most important aspects of imaging in glioma is perfusion imaging which is commonly used in grading glial neoplasm. ASL-derived perfusion parameter of CBF shows a good correlation in grading glioma as compared to T2* DSC perfusion of CBV and CBF.22–27 One of the novel parameters of multi-delay ASL perfusion which has never been used for grading glial neoplasms is arterialized cerebral blood volume (aCBV). In this study, we have evaluated the role of aCBV in grading glioma. We also want to find out whether ASL-derived aCBV has any added advantage over ASL-derived CBF in terms of diagnostic utility. Moreover, we have seen in various studies that T2* DSC perfusion-derived rCBV has better accuracy in glioma grading than other parameters of T2* DSC perfusion like rCBF.28,29
For calculating aCBV from multi-delay ASL, we make use of both perfusion parameters of flow and time, that is, CBF and ATT. We wish to evaluate the diagnostic utility of aCBV in tumor grading because it represents calculated volume of blood in tumor tissue. In this way, we also wish to find out whether it could be similar to other parameters like rCBV calculated in T2*DSC perfusion imaging.
In this study, we have evaluated multi-delay ASL-derived aCBV as a novel perfusion parameter and found a statistically significant correlation with T2* DSC-derived rCBV with a Pearson correlation coefficient of 0.94 (at 95% confidence interval, p<.05), in grading glial neoplasms. Another important observation is that when we used normalized tumor aCBV (naCBV) for defining a cutoff between high-grade and low-grade gliomas as compared to arterialized CBV alone, there is a significant improvement in sensitivity without much change in specificity of naCBV. The sensitivity and specificity for cutoff between low- and high-grade gliomas using normalized aCBV (naCBV) are 88.5 and 83.3 as compared to aCBV which has a sensitivity and specificity of 57.7% and 86.7%, respectively. So, by using normalized values of perfusion parameters we tend to achieve standardization of these parameters using an internal control in the form of contralateral normal white matter. In this way, we can achieve uniformity to certain extent in our evaluation parameters by obviating effect of confounding factors like heart rate, effect of aging on neuroparenchyma vascularity, and so on. Similarly, the cutoff values derived statistically for differentiating glial neoplasm into high- versus low grade are 1.12 for T2* DSC-derived normalized aCBV and 1.24 for ASL perfusion-derived normalized rCBV (at 95% confidence interval). We also compared aCBV with CBF and found that aCBV has a sensitivity of 88.5 and specificity of 83.3% as compared to CBF which has a sensitivity of 65% and specificity of 76% in differentiating low-grade gliomas from high-grade gliomas which is statistically significant.
Similarly, we have simultaneously assessed other perfusion parameters for grading glial neoplasms and found that T2* DSC-derived normalized rCBF also has a strong correlation with normalized aCBV (ASL) as well as with normalized rCBV (T2* DSC). CBV and CBF are related parameters accounting for blood volume in the tumor and its flow rate, and these parameters are affected by tumor neo-vasculature volume and hemodynamics of the tumor which indirectly reflect the tumor vascularity.
The perfusion imaging parameters of T2*DSC and ASL perfusion in our study were not able to differentiate between WHO grade 1 from WHO grade 2 and WHO grade 3 from WHO grade 4. Similar findings were also observed in a meta-analysis on value of ASL in grading gliomas by Alsaedi et al. 20 In the meta-analysis, it was not possible to differentiate WHO grade 3 from WHO grade 4 but could differentiate low-grade gliomas from high-grade gliomas. Similarly in our study, the cutoff values show a significant overlap and no statistically significant cutoff to differentiate WHO grade 1 from 2 or WHO grade 3 from grade 4. Because of this reason, we have categorized the gliomas into two broad groups of low-grade gliomas (comprising WHO grades 1 and 2) and high-grade gliomas (comprising WHO grades 3 and 4) based on statistically significant cutoff values to differentiate one class from the other.
In this study, we have experimented with aCBV, a new parameter derived from ASL perfusion which uses magnetically labeled water as a diffusible endogenous tracer, and simultaneously attempted to study the correlation between ASL perfusion and T2* DSC perfusion parameters. Another important fact which is worth mentioning is that, since water is freely diffusible and it may not be limited to EES alone, the amount of labeled water gaining entry into the tumor cells is not completely traceable because of loss of signal as time passes. This is one of the major limitations of ASL and is also responsible for poor SNR.
If we could devise some mechanisms to prolong the decay of tagged water protons or trace very low signals for prolonged periods, we may be able to study the internal micro milieu of the tumor just by tracing the magnetically tagged water. At present due to limitations in the hardware and available software, we may not be able to stretch that far but we hope that in the near future it may be possible. So, ASL perfusion parameters have a great potential to study tumor micro-kinetics as well. The only limitation which the ASL perfusion might face is lack of availability of robust standardized models, but with the progress in technological advancement it should not be a limitation in the near future.
Limitations
Smaller sample size is one of the limitations of the study. In the future, studies with large samples are needed for further validation of this study’s findings.
Conclusion
Arterial spin labeling-derived arterialized CBV (aCBV) is a novel imaging parameter which has showed a statistically significant correlation in this study with T2* DSC-derived CBV in its ability to grade brain glioma with a definitive cutoff between low-grade and high-grade tumors. Also, it has shown better sensitivity and specificity than ASL-derived CBF in differentiating low-grade from high-grade gliomas. The role of aCBV as a novel perfusion biomarker needs further validation in larger study samples. Moreover, this novel parameter can also be tried in post-treatment cases of brain glioma with recurrence where differentiation of true progression from pseudoprogression and pseudoresponse is vital. In the future, more studies need to be carried out for better defining the role of aCBV in tumor imaging.
Footnotes
The author(s) declared no potential conflicts of interest with respect to the research, authorship, and/or publication of this article.
Funding: The author(s) received no financial support for the research, authorship, and/or publication of this article.
ORCID iDs
Krishna Pratap Singh Senger https://orcid.org/0000-0002-9276-634X
C Kesavadas https://orcid.org/0000-0003-4914-8666
Bejoy Thomas https://orcid.org/0000-0003-0355-3375
References
- 1.Golay X, Petersen ET. Arterial spin labeling: benefits and pitfalls of high magnetic field. Neuroimaging Clin 2006; 16: 259–268. [DOI] [PubMed] [Google Scholar]
- 2.Kety SS, Schmidt CF. The nitrous oxide method for the quantitative determination of cerebral blood flow in man: theory, procedure and normal values 1. J Clin Invest 1948; 27: 476–483. [DOI] [PMC free article] [PubMed] [Google Scholar]
- 3.Kety SS, Schmidt CF. The determination of cerebral blood flow in man by the use of nitrous oxide in low concentrations. American Journal of Physiology-Legacy Content 1945; 143: 53–66. [Google Scholar]
- 4.Sadowski EA, Bennett LK, Chan MR, et al. Nephrogenic systemic fibrosis: risk factors and incidence estimation. Radiology 2007; 243: 148–157. [DOI] [PubMed] [Google Scholar]
- 5.Boxerman JL, Prah DE, Paulson ES, et al. The role of preload and leakage correction in gadolinium-based cerebral blood volume estimation determined by comparison with MION as a Criterion Standard. Am J Neuroradiol 2012; 33: 1081–1087. [DOI] [PMC free article] [PubMed] [Google Scholar]
- 6.Floriano VH, Torres US, Spotti AR, et al. The role of dynamic susceptibility contrast-enhanced perfusion MR Imaging in differentiating between infectious and neoplastic focal brain lesions: results from a cohort of 100 consecutive patients. In: Harel N. (ed). PLoS One 2013; 8: e81509. [DOI] [PMC free article] [PubMed] [Google Scholar]
- 7.Li K-L, Buonaccorsi G, Thompson G, et al. An improved coverage and spatial resolution-using dual injection dynamic contrast-enhanced (ICE-DICE) MRI: A novel dynamic contrast-enhanced technique for cerebral tumors. Magn Reson Med 2012; 68: 452–462. [DOI] [PubMed] [Google Scholar]
- 8.Lüdemann L, Warmuth C, Plotkin M, et al. Brain tumor perfusion: comparison of dynamic contrast enhanced magnetic resonance imaging using T1, T2, and T2* contrast, pulsed arterial spin labeling, and H2(15)O positron emission tomography. Eur J Radiol July 2009; 70: 465–474. [DOI] [PubMed] [Google Scholar]
- 9.Knutsson L, van Westen D, Petersen ET, et al. Absolute quantification of cerebral blood flow: Correlation between dynamic susceptibility contrast MRI and model-free arterial spin labeling. Magn Reson Imag 2010; 28: 1–7. [DOI] [PubMed] [Google Scholar]
- 10.Wang DJ, Alger JR, Qiao JX, et al. Multi-delay multi-parametric arterial spin-labeled perfusion MRI in acute ischemic stroke-comparison with dynamic susceptibility contrast enhanced perfusion imaging. Neuroimage: Clinic 2013; 3: 1–7. [DOI] [PMC free article] [PubMed] [Google Scholar]
- 11.Dai W, Robson PM, Shankaranarayanan A, et al. Reduced resolution transit delay prescan for quantitative continuous arterial spin labeling perfusion imaging. Magn Reson Med 2012; 67: 1252–1265. [DOI] [PMC free article] [PubMed] [Google Scholar]
- 12.Alsop DC, Detre JA, Golay X, et al. Recommended implementation of arterial spin-labeled perfusion MRI for clinical applications: A consensus of the ISMRM perfusion study group and the European consortium for ASL in dementia. Magn Reson Med 2015; 73: 102–116. [DOI] [PMC free article] [PubMed] [Google Scholar]
- 13.Leithner C, Müller S, Füchtemeier M, et al. Determination of the brain-blood partition coefficient for water in mice using MRI. J Cerebr Blood Flow Metabol 2010; 30: 1821–1824. [DOI] [PMC free article] [PubMed] [Google Scholar]
- 14.Global Burden of Disease Cancer Collaboration . Global, regional, and national cancer incidence, mortality, years of life lost, years lived with disability, and disability-adjusted life-years for 32 cancer groups, 1990 to 2015: a systematic analysis for the global burden of disease study. JAMA Oncol 2017; 3: 524–548. [DOI] [PMC free article] [PubMed] [Google Scholar]
- 15.Park KB, Johnson WD, Dempsey RJ, et al. Global neurosurgery: the unmet need. World Neurosurgery 2016; 88: 32–35. [DOI] [PubMed] [Google Scholar]
- 16.Siegel RL, Miller KD, Jemal A. Cancer Statistics, 2020. CA A Cancer J Clin 2020; 70: 7–30. [DOI] [PubMed] [Google Scholar]
- 17.National Cancer Institute . SEER*Stat database: incidence—SEER 9 regs research data, nov 2020 sub (1975-2018) <Katrina/Rita population adjustment>—linked to county attributes—total us, 1969-2019 counties. Bethesda, MD, USA: National Cancer Institute, DCCPS, Surveillance Research Program, 2021. [Google Scholar]
- 18.Ostrom QT, Cioffi G, Gittleman H, et al. CBTRUS statistical report: primary brain and other central nervous system tumors diagnosed in the United States in 2012–2016. Neuro Oncol 2019; 21: 1–100. [DOI] [PMC free article] [PubMed] [Google Scholar]
- 19.Matérne M, Strandberg T, Lundqvist LO. Change in quality of life in relation to returning to work after acquired brain injury: a population-based register study. Brain Inj 2008; 32: 1731–1739. [DOI] [PubMed] [Google Scholar]
- 20.Bangiyev L, Rossi Espagnet MC, Young R, et al. Adult brain tumor imaging: state of the art. Semin Roentgenol 2014; 49: 39–52. [DOI] [PubMed] [Google Scholar]
- 21.Diehn M, Nardini C, Wang DS, et al. Identification of noninvasive imaging surrogates for brain tumor gene-expression modules. Proc Natl Acad Sci USA 2008; 105: 5213–5218. [DOI] [PMC free article] [PubMed] [Google Scholar]
- 22.Alsaedi A, Doniselli F, Jäger HR, et al. The value of arterial spin labelling in adults glioma grading: systematic review and meta-analysis. Oncotarget 2019; 10(16): 1589–1601. [DOI] [PMC free article] [PubMed] [Google Scholar]
- 23.Cebeci H, Aydin O, Ozturk-Isik E, et al. Assesment of perfusion in glial tumors with arterial spin labeling; comparison with dynamic susceptibility contrast method. Eur J Radiol 2014; 83(10): 1914–1919. [DOI] [PubMed] [Google Scholar]
- 24.Weber MA, Zoubaa S, Schlieter M, et al. Diagnostic performance of spectroscopic and perfusion MRI for distinction of brain tumors. Neurology 2006; 66: 1899–1906. [DOI] [PubMed] [Google Scholar]
- 25.Wolf RL, Wang J, Wang S, et al. Grading of CNS neoplasms using continuous arterial spin labeled perfusion MR imaging at 3 Tesla. J Magn Reson Imag 2005; 22: 475–482. [DOI] [PubMed] [Google Scholar]
- 26.Järnum H, Steffensen EG, Knutsson L, et al. Perfusion MRI of brain tumours: a comparative study of pseudo-continuous arterial spin labelling and dynamic susceptibility contrast imaging. Neuroradiology 2010; 52: 307–317. [DOI] [PMC free article] [PubMed] [Google Scholar]
- 27.Warmuth C, Günther M, Zimmer C, et al. Quantification of blood flow in brain tumors: comparison of arterial spin labeling and dynamic susceptibility-weighted contrast-enhanced MR imaging. Radiology 2003; 228: 523–532. [DOI] [PubMed] [Google Scholar]
- 28.Law M, Young RJ, Babb JS, et al. Gliomas: predicting time to progression or survival with cerebral blood volume measurements at dynamic susceptibility-weighted contrast-enhanced perfusion MR imaging. Radiology 2008; 247: 490–498. [DOI] [PMC free article] [PubMed] [Google Scholar]
- 29.Law M, Yang S, Wang H, et al. Glioma grading: sensitivity, specificity, and predictive values of perfusion MR imaging and proton MR spectroscopic imaging compared with conventional MR imaging. AJNR. American journal of neuroradiology 2003; 24: 89–98. [PMC free article] [PubMed] [Google Scholar]


