Abstract
Summary: Anatomic and functional neuroimaging with magnetic resonance imaging (MRI) includes the technology more widely known as magnetic resonance spectroscopy (MRS). Now a routine automated “add-on” to all clinical magnetic resonance scanners, MRS, which assays regional neurochemical health and disease, is therefore the most accessible diagnostic tool for clinical management of neurometabolic disorders. Furthermore, the noninvasive nature of this technique makes it an ideal tool for therapeutic monitoring of disease and neurotherapeutic decision making. Among the more than 100 brain disorders that fall within this broad category, MRS contributes decisively to clinical decision making in a smaller but growing number. In this review, we will cover how MRS provides therapeutic impact in brain tumors, metabolic disorders such as adrenoleukodystrophy and Canavan's disease, Alzheimer's disease, hypoxia, secondary to trauma or ischemia, human immunodeficiency virus dementia and lesions, as well as systemic disease such as hepatic and renal failure. Together, these eight indications for MRS apply to a majority of all cases seen. This review, which examines the role of MRS in enhancing routine neurological practice and treatment concludes: 1) there is added value from MRS where MRI is positive; 2) there is unique decision-making information in MRS when MRI is negative; and 3) MRS usefully informs decision making in neurotherapeutics. Additional efficacy studies could extend the range of this capability.
Keywords: Spectroscopy, MRI, brain, tumors, Alzheimer's disease, metabolic disorders, hypoxia
BACKGROUND OF MAGNETIC RESONANCE SPECTROSCOPY
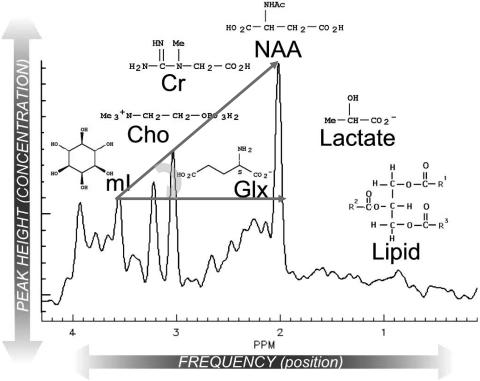
Magnetic resonance spectroscopy (MRS) defines neurochemistry on a regional basis by acquiring a radio-frequency signal with chemical shift from one or many voxels or volumes previously selected on MRI. From the resulting spectrum, up to 80 brain metabolites or flux rates can be distinguished.1 Each neurometabolite is localized on a horizontal scale (chemical shift), and their relative metabolite concentration is determined from the metabolite's peak height (FIG. 1). Routine neuroimaging centers are confined to automated or ready-made method of MRS, nevertheless, have found sufficient diagnostic information in proton (1H) MRS, which defines fewer than 15 brain metabolites. 1H MRS and routine MRI share the same radio-frequency range (and hence need no expensive upgrades to the MR scanner) and is therefore cost effective and expeditious. Prescribing a voxel, acquiring and displaying the metabolite scan, are accomplished in fewer than 3 min (not 35 min as stated in a recent Medicare Technology Assessment from Duke University2), with the electronic display, film, and interpretation available before the patient leaves the scanner. We therefore confine this review to proton spectroscopy. Discussion of the remaining approximately 65 brain metabolites for which special equipment is required is among the future directions for spectroscopy.3,4
FIG. 1.
Representative spectrum of the human brain in vivo. Each peak is labeled with the molecule and its structure (SciFinder). Note that lipid and lactate are not observed in healthy brain (as shown here), and therefore their absorptions are not visible. The curved arrow represents HA, which is drawn starting from mI to NAA.
INTERPRETATION
When analyzing and reporting MRS, it is important to read and record all peaks in the spectrum. We found the following mnemonic to be quite useful: Lying, Lazy No Good Crooks C(h)ollected My Insurance for right to left: lipids, lactate, N-acetylaspartate (NAA), glutamate/glutamine (Glx), creatine (Cr), choline (Cho), and myo-inositol (mI), respectively (FIG. 1).
Lipids
Lipids are broad peaks that occur at 0.9 and 1.2 parts per million (ppm). In healthy tissues, there should be very little lipid in the spectrum unless the area includes subcutaneous fat from the skull. The presence of lipid can have diagnostic value in brain tumor where lipid indicates necrosis.5 In this extreme setting, a third lipid peak, at 2 ppm may displace or mask the normal NAA resonance.
Lactate
Lactate is generally seen as a doublet (two peaks close together) that has a frequency of exactly 1.33 ppm. Again, healthy tissue does not have sufficient lactate to be detectable with MRS. CSF contains lactate at about 1 mm so that if the voxel is placed entirely in the ventricle lactate will appear in the spectrum (a potential source of error when examining patients with hydrocephalus). Lactate as a product of anaerobic glycolysis is detected in diseased brain, which is oxygen starved in stroke, mitochondrial myopathy, encephalopathy, lactacidosis, and stroke, recovery from cardiac arrest, neonatal hypoxia, etc. It is of greatest diagnostic value in cases of brain injury or trauma where hypoxia is part of the differential. It is also a nonspecific marker of tumor aggressiveness and is found in cysts and abscesses of all types.5
N-acetyl aspartate
At 2.0 ppm, NAA is an amino acid derivative synthesized in neurons and transported down axons. It is therefore an almost 100%-specific marker of viable neurons, axons, and dendrites. The diagnostic value of NAA lies in the ability to quantify neuronal injury or loss on a regional basis.5
Glutamate-glutamine
A mixture of closely related amino acids, amines and derivatives closely involved in excitatory and inhibitory neurotransmission that lies between 2.1 and 2.4 ppm. Because these are also integral products of intact TCA (Krebs) cycle activity and mitochondrial redox systems, Glx offers a vital marker(s) in MRS of stroke, lymphoma, hypoxia, and many metabolic brain disorders.5
Creatine
The primary resonance of creatine lies at 3.0 ppm. As phosphocreatine, it is the central energy marker of both neurons and astrocytes. A “constant” in the normal brain spectrum, the Cr peak intensity thereby standardizes its interpretation. Metabolite/Cr peak height ratios are astonishingly reproducible and a visual pattern described by Hunter's angle (HA) (see below), can be relied upon for radiological interpretation of almost all pathological spectra.5
Choline
Cho [sometimes designated trimethylamine (TMA)] is an umbrella term for several soluble components of brain myelin and fluid-cell membranes that resonate at 3.2 ppm. Because by far the majority of choline-containing brain constituents are not normally soluble, pathological alterations in membrane turnover (tumor, leukodystrophy, multiple sclerosis) result in a massive increase in MRS-visible Cho, providing a diagnostic gold mine.5
Myo-inositol
A previously little-known polyol (sugar-like molecules) that resonates at 3.6 ppm, mI is the missing osmolyte of the early neurological literature for brain volume regulation. In neurospectroscopy, mI is mostly a diagnostic modifier in those diseases that affect Cho (tumor, multiple sclerosis, etc). As an astrocyte marker and osmolyte, mI contributes specificity in dementia diagnosis and adds specificity to monitoring hepatic encephalopathy and hyponatremic brain syndromes.5
Additional resonance peaks
MRS is a “spectrum” of normal and abnormal brain constituents. Lots of “odd” things turn up in the brain after ingestion: alcohol, methylsulphonylmethane (a common health food supplement),6 mannitol and propylene glycol, common medications, glucose, acetate, acetone, succinate, phenyl-alanine, all defined by their chemical shift (ppm) and adding spice and diagnostic specificity to the clinical practice of neurospectroscopy.
Every metabolite has a normal concentration that generates a pattern of peaks that is the same from person to person unless there is an underlying pathology. Diagnosis with MRS can therefore be made by either comparing the numeric values of metabolite concentrations or by recognizing abnormal patterns of peaks in the spectra such as in electrocardiogram interpretations.
Hunter's angle.
Named for an eminent neurosurgeon who applied a pocket comb to the task of recognizing the 45-degree angle formed by the peaks mI, Cr, Cho, and NAA, when they are present in normal proportions, viz: NAA/Cr ∼1.5, Cho/Cr ∼0.75; mI/Cr: 0.5, thus, a very rough-and-ready approach for short-echo-stimulated echo acquisition mode (STEAM) spectroscopy. Like all rules, exceptions abound—moving from STEAM to point resolved spectroscopy (PRESS), from short to long echo time (TE) and repetition time (TR), from cortex to midbrain, all change HA. Nevertheless, it is rather convincing when applied to such common MRS diagnoses as tumor (HA < −50°), stroke, AD (HA = 15°), neonatal hypoxia (HA = −45°) or acquired immune deficiency syndrome (AIDS)-related progressive multifocal leukomalacia (HA = 0°).
Numerical peak-height ratios.
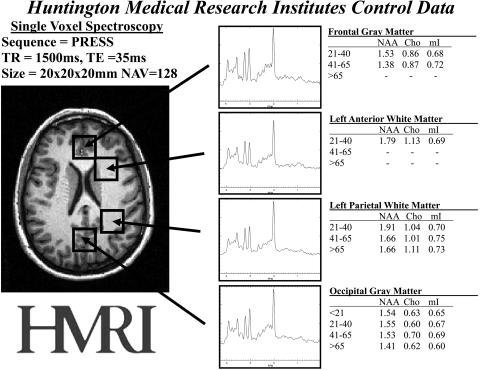
With the assumption that Cr = 1, software programs on most commercial MR scanners present integrals or peak heights to the second decimal place. Neurologists and radiologists are encouraged to have a table of normal values on hand (FIG. 2), so that reports contain more than the traditional MRI “impressions.” For tumor diagnosis in one scheme Cho/Cr of 0.92 ± 0.05 is normal; thus, Cho/Cr >1.02 is quite possibly tumor.7 In dementia diagnosis, normal NAA/Cr = 1.25 ± 0.07; a value NAA/Cr < 1.11 can be reported as probable AD.8
FIG. 2.
Normative proton MRS data from multiple regions of the brain. These four regions alone provide diagnostic value and precision for many diseases. The regions of interest are shown on the MRI on the left and representative spectra are shown in the middle. Normative metabolite ratio values are shown on the right. Standard deviations of 5–7% are omitted.
Multiple MRS abnormalities allow pattern recognition.
As with many diagnostic modalities, combining several features greatly expands our diagnostic acumen. So too in MRS: the radiologist must strive to see these common patterns of disease and become comfortable with their neurochemical origins. A simple example, which also “reverses” HA, is the excess lipid, lactate and Cho/Cr, with absence or reduction on NAA/Cr (absent neurons) found in necrotic, anoxic, and proliferating regions of a glioma, respectively.
Recognizing the NORMAL MRS is as vital as the NORMAL MRI and, exactly as with MRI, depends 100% on the pulse sequence and other parameters. It is critical for a clinical practice to select one protocol of parameters and become absolutely familiar with the results of that protocol. Selecting different parameters for different patients will only serve to confuse the interpretation of the spectra. Indeed, one factor delaying universal acceptance is the lack of a standard for MRS reporting in this by now enormous published literature. Like comparing T2- with T1-weighted images, spectroscopy acquired with different parameters cannot be assumed to be the same. Therefore, it is essential that one to be as consistent as possible to maintain low variability and avoid misinterpretation. Figure 2 provides normative values for different ages in different regions of the brain. It is important to keep in mind the parameters that were used to acquire this normative data: PRESS, TE = 35 ms, TR =1.5 s, using a voxel size of 8 cm3.
NEUROLOGICAL DIAGNOSIS AND NEUROTHERAPEUTIC DECISION MAKING WITH MRS
Magnetic resonance spectroscopy can be used to determine therapy in a variety of ways. Diseases that impact directly upon the metabolites measured by MRS can be monitored by MRS to determine if therapy is effective. For example, in tumors, the prevalence of an increased Cho signal would indicate the presence of cancerous cells. If therapy is effective, we would expect to see the Cho signal to return to a normal level or concentration. In this manner, MRS is similar to laboratory tests and their impact on therapeutics. Another way that MRS can impact therapy and patient management is by changing the diagnosis in cases where the disease state is unclear or unknown. Using the same example of brain tumors, there are often cases where MRI and other tests have been nondiagnostic for neoplasm. At this point, therapy is difficult to consider without a surgical biopsy. MRS can be used to diagnose the disease from which therapeutic choices can be made. Therapeutic decisions in unexplained coma can be greatly simplified with an interpretable metabolic profile of the normal-appearing brain. The following sections will describe diseases in which MRS can have a dramatic impact on therapy.
Alzheimer's disease
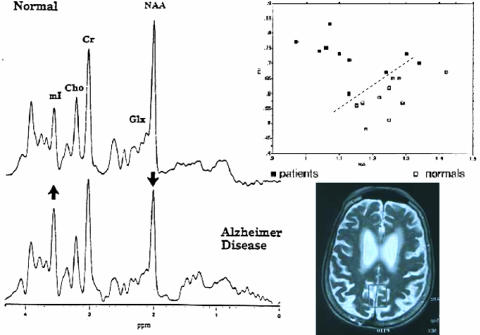
MRS has been demonstrated to be highly specific and sensitive to the diagnosis of Alzheimer's disease.8–14 A single blinded retrospective study evaluated MRS in 101 consecutive patients (26 males, 75 females) referred to a medical community geriatric center for memory loss or suspicion of dementia.15 On the initial visit, the patient underwent a complete evaluation for dementia, which included a history and physical, neuropsychological testing, including Mini Mental State Examination, and laboratory data. MRS was obtained immediately after the patients' first visit. The patients' diagnoses before and after MRS were obtained by a blinded chart review by an experienced clinical geriatrician, independent of the patient-managing physician. The initial clinical diagnosis was made based on criteria defined by the Diagnostic and Statistical Manual of Mental Disorders, fourth edition (DSM-IV). The final clinical diagnosis was made based on the same clinical factors combined with the MRS results. MRS results were expressed in NAA, Cho, and mI to Cr ratios using single voxel short echo (TE = 35 ms) proton spectroscopy in the posterior cingulate gyrus. These ratios were then entered into a database of known AD and non-AD patients and using a predetermined receiver operator characteristic (ROC) of the NAA/Cr and mI/Cr ratios,13 a diagnosis based on MRS results alone was made (FIG. 3).
FIG. 3.
MRS of AD. Left: Spectra of (top) normal age-matched control and (bottom) a patient suffering from AD are shown. Arrows indicate the increase in mI and the decrease in NAA. Right: Top: Nomogram of AD patients (filled squares) and normal controls (open squares) with an ROC indicated by the dotted line. Bottom: Location of the posterior cingulated gyrus or GM voxel position for standardized MRS.
The impact of MRS on clinical management of these AD patients can be demonstrated by examining the changes made between initial and final diagnosis and their agreements with MRS results.16 In patients who were initially diagnosed as non-AD, MRS results were positive for AD and the final diagnosis was changed to agree with MRS in 20 patients. This was often the case when the clinician was unsure of the diagnosis such as if dementia symptoms were due to either multi-infarct dementia or AD. The clinician often chose AD as the final diagnosis if the MR spectrum was consistent with AD. In patients originally diagnosed with AD, MRS did not agree, and subsequently the final diagnosis reflected a negative diagnosis in five patients. These patients were immediately taken off AD medications and treated for depression or other pathologies. Therefore, 29% of the patients would have been incorrectly diagnosed had it not been for MRS. MRS confirmed initial diagnosis in 53% of the patients, thus reaffirming treatment decisions. In the remainder of the cases, MRS did not affect decision making. The MRS results also changed the treatment plan in 31% of the cases. In a majority of these cases, Donepezil was started based on a MRS result positive for AD. This study was an example of how MRS can be incorporated into the standard work-up for AD and how its diagnostic power can be used to impact upon patient management and treatment. Now that Medicare has approved payment for positron emission tomography (PET) in AD diagnosis, it would be of interest to compare the power of MRI and MRS compared with PET to make such management decisions. On costs alone, MRS has an advantage over PET; more importantly, MRS is completely noninvasive without the use of radioactive reagents and can therefore be performed safely and repeatedly without risk to the patient.
MRS can also be used to measure the effectiveness of neurological treatments and sometimes in more than one way. A pilot study was conducted in a single patient with severe AD where fetal tissue was transplanted bilaterally into the hippocampus in an effort to recover memory function in that region.17 Single voxel short-echo spectroscopy was used to 1) monitor intrahippocampal neurotransplants to determine if there was rejection of the transplanted tissue; 2) assess the degree of incorporation of fetal tissue into normal tissue; and 3) determine if the transplantation affected the diagnosis of AD.
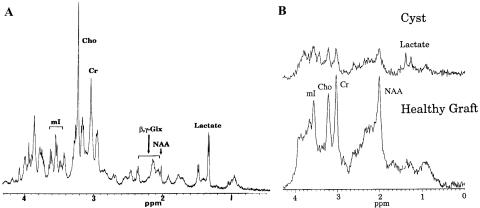
Previous studies have demonstrated that MRS can be very useful for monitoring neurotransplantation therapy in patients with Parkinson's and Huntington's disease.18 To understand this application of MRS, we should note that the neuronal marker NAA is an excellent reflection of gestational age of the human brain, reaching its peak concentration only at age 12 years19 Fetal tissue does not contain NAA (FIG. 4A). Initially, when the tissue was transplanted into the region, MRS demonstrated low levels of NAA as expected. However, if the grafts incorporated into the tissue had matured to healthy adult neuronal tissue, NAA would subsequently be expressed and MRS could be used to monitor the effectiveness of neurotransplantation therapy (FIG. 4B, bottom). In selected cases,20 functional MRI could demonstrate integration of new neuronal connections with these grafts using a motor paradigm to cause their activation and blood oxygen level-dependent (BOLD) response in vivo. If the graft did not incorporate into the tissue, it could result in cyst that is reflected spectroscopically by the presence of lactate in the spectrum (FIG. 4B, top). It was often difficult to discern on MRI alone whether fetal tissue was successfully grafted into the surrounding tissue due to edema and other confounding factors. MRS provided a completely noninvasive measure that was not only highly diagnostic but safe to repeat at any indicated interval.
FIG. 4.
Spectroscopy of neurotransplants grafts ex vivo and in vivo. A: Proton spectrum of neurotransplantation graft in a high-resolution NMR scanner. Note that there is no NAA in this progenitor tissue. B: Proton spectrum of bottom, healthy graft that has been incorporated into the surrounding tissue (note the presence of NAA); and top, graft rejection that results in a cyst with no NAA and presence of lactate.
In the AD neurotransplantation study, grafts were transplanted unilaterally into the left hippocampus using stereotactic surgery. The patient was then monitored in both the left and right hippocampus before and after surgery. Both MRS and neuropsychological testing were conducted every 3 months after transplantation. Our results with MRS confirmed that viable neurons had developed in the left hippocampus after transplantation and that the transplantation did not result in any negative biochemical effects.
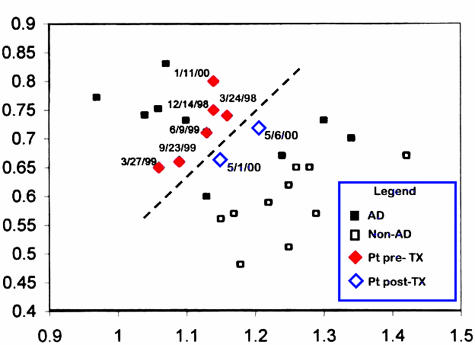
In this study, spectroscopy also doubled as an outcomes measure using the technique described in the previous study. Initially, measurements of NAA and mI in the posterior cingulate gyrus were used to measure disease progression. At 3-month intervals, neither MRI nor neuropsychological tests were sensitive enough to measure any evidence of disease progression. However, MRS results demonstrate progressively decreasing NAA and increasing mI as indicated by red diamonds in Figure 5. After the neurotransplantation, neuropsychological evaluation only demonstrated an improvement in visual-spatial tests; however, MRS demonstrated significant improvements in NAA and mI after surgery. Unfortunately, subsequent MRS examinations indicated further disease progression; nevertheless, this study demonstrates the high sensitivity of MRS measurements for monitoring disease progression.
FIG. 5.
MRS used to measure disease progression and treatment response. Using the same nomogram and ROC for AD diagnosis, measurements from the posterior cingulated gyrus of a patient are taken multiple times before (filled diamonds) and after (open diamonds) neurotransplantation. Note that decreasing NAA and increasing mI in this patient in just 1 year. Initial exciting news demonstrated that after surgery, NAA and mI return toward more normal values.
Brain tumors
Based upon nearly 20 years of clinical practice, it is now commonplace to see clinical decision making based upon results of MRS in patients with suspected or already treated malignant brain tumor. In a study conducted by our clinic,21 15 consecutive patients were examined by a neurosurgeon who mapped (and sealed) a management plan. Single voxel short-echo proton MRS was then conducted in all 15 patients. The MRS results were reported to the clinician, factored into the clinical decision making, and a final diagnostic and treatment plan was formulated. In the initial treatment plan, stereotactic biopsy was recommended in eight cases, repeat MRI every 6 weeks in three cases, resection in the another three cases, and proceed to chemotherapy in the final case. In the final treatment plan, stereotactic biopsy was avoided in seven of eight cases. Instead of repeat MRI, the MRS results initiated prompt treatment in two cases. In one case destined for resection, MRS showed radiation necrosis and resection was decided against. In remaining cases, MRS confirmed recurrent tumor and the original treatment plan was executed. This implies that in 67% of the cases MRS impacted upon the treatment decisions of the patients with brain tumor. The cases below serve to illustrate how MRS can be used to impact on patient therapeutics.
Radiation necrosis versus recurrence
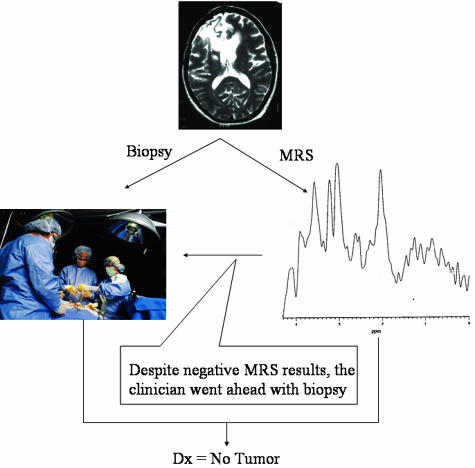
Although the authors do not advocate that MRS replace stereotactic biopsy altogether (because MRS does not provide complete histological information), MRS is especially useful in cases where MRI demonstrates enhancement, but it is difficult to determine whether it is radiation necrosis (positive treatment response) or recurrence (negative treatment response). A recent review of this specific application of spectroscopy demonstrates 84 separate published studies representing over 2500 cases where spectroscopy has provided definitive diagnosis where MRI is ambiguous.22 This review was conducted at the request of the American College of Radiology by the Division of Evidence-Based Medicine at Tufts University Medical School in 2003. Their report, based on the same data, reached the conclusion that MRS lacked benefit.22 In our study, there are eight cases where spectroscopy identified recurrence or necrosis. In one such case, the neurosurgeon proceeded with biopsy despite spectroscopic diagnosis of necrosis (FIG. 6). Histopathological results confirmed that there was no evidence of tumor, thereby confirming spectroscopic results. This is an excellent example of how an unnecessary surgery can be avoided by implementation of noninvasive MRS.
FIG. 6.
Brain tumor MRS: radiation necrosis versus recurrence. A second spectra obtained from the lesion demonstrated primary markers of necrosis (lipid evelated at 0.9, 1.2, and 2.0 ppm) is not shown. However, in the spectra displayed there is no obvious elevation of Cho/Cr necessary for the MRS diagnosis of recurrence. Biopsy was not urgent.
In addition, MRS as a noninvasive examination can be repeated often with no risk to the patient. This same patient was followed annually with spectroscopy for the next 5 years. It was not until the most recent examination that a recurrence was discovered, in a new area that was not the original region in question. Upon the MRS diagnosis of recurrence, the surgeon was able to proceed quickly to treatment instead of waiting for symptoms of recurrence or biopsy confirmation. The ability to quickly and safely assess patients truly demonstrates the power of spectroscopy as the virtual biopsy.
MRS is beneficial in situations where biopsy presents unacceptable risk
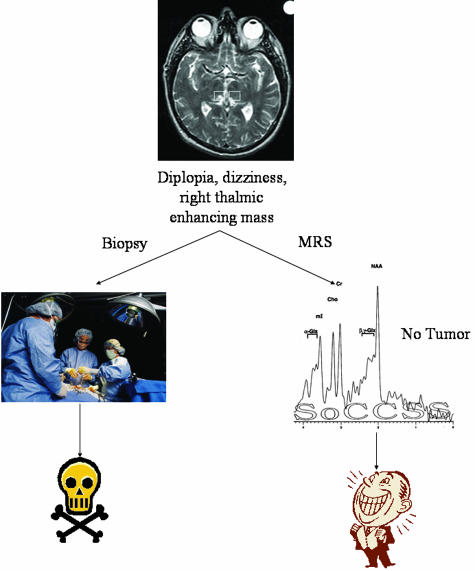
The noninvasive nature of MRS is essential in cases where brain biopsies carry a risk of particular morbidity, e.g., in diffuse brainstem lesions or those located in eloquent or inaccessible regions. Studies have demonstrated that there is approximately a 10% chance of surgical complications resulting directly from stereotactic brain biopsies. Two of the fifteen patients demonstrated changes in the brainstem, one that presented with a diffuse mass and the other with small enhancing mass. The latter case is illustrated in Figure 7. A 43-year-old male presented with diplopia and dizziness. Contrast-enhanced MRI revealed a small, enhancing mass in the right thalamus. After seeking six different neurosurgical consults, all of whom recommended biopsy, he consulted with the neurosurgeon involved in our project and was recommended MRS. MRS results demonstrated normal metabolite measurements in the initial examination and subsequent follow-up examination 3 months later. After 6 months, the lesion resolved spontaneously and the patient has been asymptomatic thereafter. A more careful clinical history elicited a closed head injury days before the original presentation.
FIG. 7.
MRS benefits in situations where biopsy is risky.
MRS improves patient quality of life
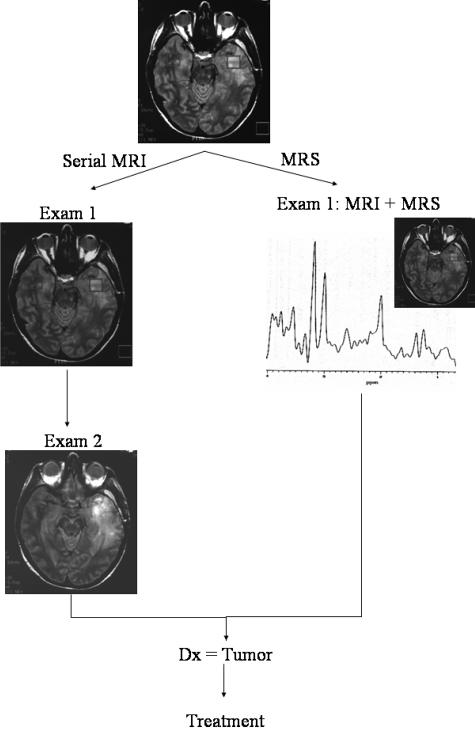
Some aspects of the study that are not quantified are the nonfinancial but significant benefits of improved quality of life from an accurate and noninvasive diagnostic procedure such as MRS. In cases where serial MRI were recommended, the patients would have unnecessarily waited until the tumor spread before treatment could be offered. Biochemical changes are readily identified by MRS before any increases in tumor size or change in shape can be detected. MRS therefore leads to earlier treatment of tumors, thereby reducing the amount of neurological damage sustained by the growth of the tumor but also increasing the chances of clinicians' success by earlier treatment. In one such case (FIG. 8), an initial MRI showed edema but lack of enhancement, and a follow-up MRI was requested. MRS conducted at the same time as MRI in the initial examination was positive for tumor. At that point, the patient should have, in our practice, proceeded directly to resection. Unfortunately, due to circumstances beyond the physician's control, the patient did not return for treatment until 6 weeks later, by which time the tumor had spread significantly throughout the right temporal lobe and required a greater volume of resection.
FIG. 8.
MRS improves patient quality of life.
HUMAN IMMUNODEFICIENCY VIRUS DEMENTIA AND LESIONS
Previous studies have shown that asymptomatic and symptomatic human immunodeficiency virus (HIV) patients with and without changes in MRI show changes in brain metabolites using MRS, indicating that MRS can be a more sensitive measurement in HIV-related neurological disease.23 By correlating the metabolite concentrations with the viral load of these patients after treatment, we hypothesized that MRS may be a more sensitive indicator of treatment response.
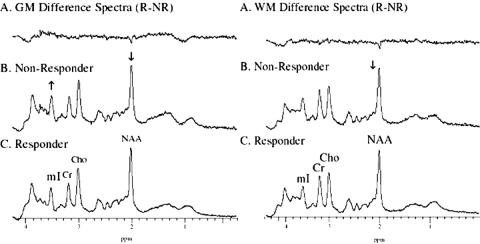
Nineteen patients with confirmed HIV infection were treated with a highly active antiretroviral therapy (HAART) including at least one protease inhibitor and two nucleoside analogs.24 Viral load measures were performed using the Roche first generation quantitative RT-PCR method and calculated on a logarithmic scale in copies/milliliter. Concomitant CD4 assays were performed in conjunction with viral load measurements. MRS in both the posterior cingulate gyrus and parietal white matter (see FIG. 2 for voxel locations) were acquired in patients within 4 weeks of clinical measures. Responders (n =14) were defined by a decrease in viral load and increase CD4 (greater than 350). Nonresponders (n = 5) were defined by no change in CD4 or viral count or an increase in viral count.
Summed difference spectra readily show significant differences between the groups as shown in Figure 9. Student's t test show that in the gray matter measurements, the mI/Cr was significantly (p < 0.05) greater in nonresponders than responders, and NAA was significantly decreased. When compared with control data, the biochemistry within the gray matter of both responders and nonresponders demonstrated a significantly increased Cho/Cr. Nonresponders also demonstrated a significantly increased mI when compared with controls. In the occipital white matter, nonresponders showed a significantly decreased NAA concentration. As in the gray matter, when compared with controls, both responders and nonresponders demonstrate a significantly increased Cho/Cr as well as significantly increased mI in nonresponders. Treated HIV patients with and without negative CD4 and viral load counts showed significant differences in 1H MRS parameters from controls, demonstrating that it is a more sensitive technique to treatment response. Early experience demonstrated that these changes might be reversible by treatment. In the present study, the importance of such reversibility receives further support in significant differences between the responder and nonresponder groups. We concluded that nonresponders can be identified and monitored by biochemical abnormalities that are in some way indicative of persistent HIV disease. A subsequent study of HIV patients with lipodystrophy further supports the effectiveness of MRS for monitoring outcomes in patients with HIV.25 Thirty-four patients were examined with proton spectroscopy in the same regions described in the previous study. Results demonstrated significant differences in brain MRS between those patients with lipodystrophy and those without. These changes include significantly decreased NAA/Cr, which supports the hypothesis that MRS is sensitive to persistent metabolic abnormalities despite normal MRI and viral load counts.
FIG. 9.
Summed spectra differences between responders and nonresponders of HAART treatment for HIV+ individuals.
The above studies demonstrate how MRS can monitor treatment effects and impact on patient management in the absence of routine neuroimaging abnormalities by revealing those patients who may require increased dosages of HAART therapy. MRS can most dramatically impact on the choice of therapy for HIV patients with focal changes in routine neuroimaging. Toxoplasmosis, lymphoma, cryptococcoma and progressive multifocal leukoencephalopathy (PML) are four types of CNS lesions that are prominent in HIV patients who are often difficult to diagnosis with MRI alone and have very different treatments dependent on the diagnosis. Neurosurgeons are understandably reluctant to subject such patients to biopsy. Fortunately, MRS can easily differentiate between each of the conditions as each provides a unique metabolic signature.26 Toxoplasmosis has decreased mI, Cho, Cr, and NAA with a 15- to 20-fold increase in lactate/lipids. CNS lymphomas have increased Cho, lactate, and lipids (but on the same order of magnitude) as well as decreased NAA and mI. PML has increased mI and Cho and decreased NAA and Cr. Cryptococcoma has decreased mI, Cho, Cr, NAA, and increased lipids but not lactate. These different metabolic patterns provide a differential diagnosis that significantly impacts the choice of treatment for each type of lesion.
Furthermore, one can use this metabolic profile for therapeutic monitoring. A recent study demonstrated that MRS was effective in demonstrating the retardation of PML progression by protease inhibitors.27 Two patients with PML on antiretroviral peptide-T drug therapy were studied sequentially by MRS in both the PML lesion and normal-appearing tissue of gray matter (GM) and/or white matter (WM). Their results were then compared with an untreated patient who demonstrated steadily decreasing NAA/Cr over a period of 12 months. The treated PML patients demonstrated a remarkable stabilization of NAA throughout the entire time period with no change in NAA from the start of treatment until the last examination. This demonstrated, for the first time, that the antiretroviral treatment arrested the progression of PML. Furthermore, there was no change in NAA in normal appearing tissue revealing no evidence of drug toxicity. However, mI was significantly increased in the normal-appearing tissue (both GM and WM) in treated PML patients when compared to normal (134% increased) and may indicate early signs of gliosis. Once again, MRS has proven to provide greater insight into drug therapeutics when other monitoring tools such as MRI and clinical diagnosis were ineffective.
METABOLIC DISORDERS
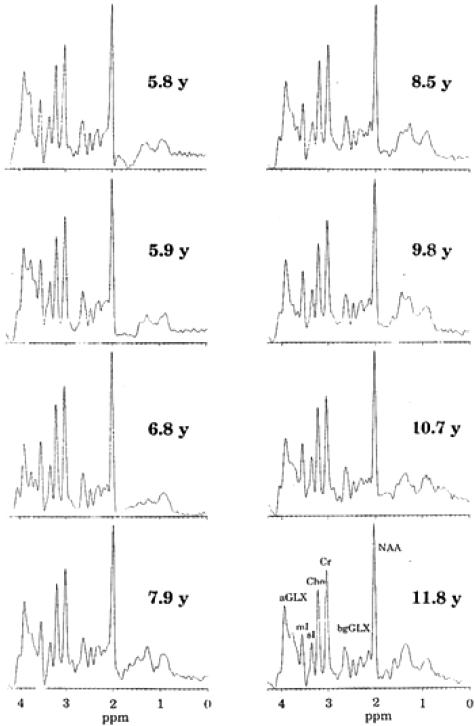
Spectroscopy can be used to monitor the effectiveness of therapy for metabolic disorders. An asymptomatic boy was diagnosed with x-linked adrenoleukodystrophy at age 3.8 years and was started on the then controversial Lorenzo's oil diet. He remained on the diet up to and including his latest MRS examination at age 11.8 years28 At various times in the long history, the patient was considered for bone marrow transplant (BMT) even to the extent of identification of a donor and cross-matching. BMT, at that time, carried with it a significant (30%) risk of death. Single voxel spectroscopy was once again acquired in the posterior parietal white matter location described above. Each examination was performed with careful and consistent positioning of the patient and voxel location. Data processing and analytical methods remained the same despite a series of hardware upgrades on the MR scanner. In a series of eight MRS examinations (shown in FIG. 10) in a period of 6 years, the patient did not show the increases in Cho/Cr and mI/Cr or decrease in NAA/Cr indicative of disease progression as reported by others.29–31 Based on the consistency of 1H MRS over the 6 years, BMT was delayed, and finally not recommended. The patient has remained healthy and asymptomatic to this day. In this patient, therefore, MRS has been used to determine the appropriate therapy by monitoring cerebral metabolite concentrations to ensure patient health and success.
FIG. 10.
Sequential monitoring of brain chemistry in white matter in an asymptomatic xALD patient on Lorenzo's oil therapy.
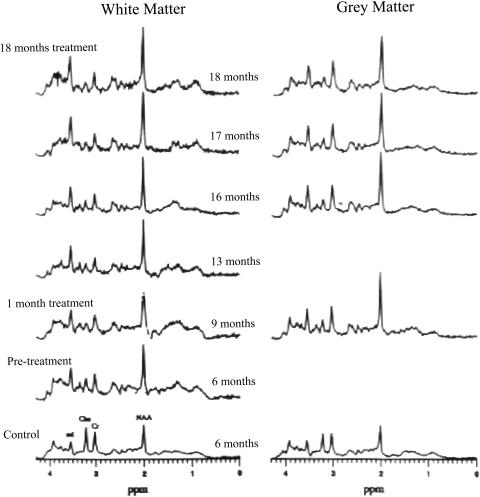
Other metabolic disorders can also be monitored with MRS. For example, Canavan's disease, a rare genetic disorder that results in white matter changes and a dramatic accumulation of NAA in the brain, can be monitored using spectroscopy. Gene therapy is now available for this disease. Whereas, unfortunately, in this case (as shown in FIG. 11), MRS demonstrates that the treatment was not successful, as NAA continued to accumulate in the brain, a larger patient series recently completed showed great promise, with stabilization or reversal of cerebral NAA accumulation.32 Creatine deficiency is another disease that is a result of a rare genetic disorder. As described by its name, this disorder presents a brain spectrum where the Cr peak is missing. When the gene deletion affects Cr biosynthesis, treatment by ingestion of Cr results in the remarkable replenishing of that peak, and partial reversal of the neurological deficit; when the deletion concerns the Cr-transporter, oral replacement is obviously ineffective, all of which can be monitored with MRS.33
FIG. 11.
Monitoring genetic therapies with MRS in Canavan's disease. Spectra were acquired before and after initial therapy. Unfortunately, as shown in the upper spectra, the medication did not ameliorate the increasing NAA in this case.
SYSTEMIC DISEASE
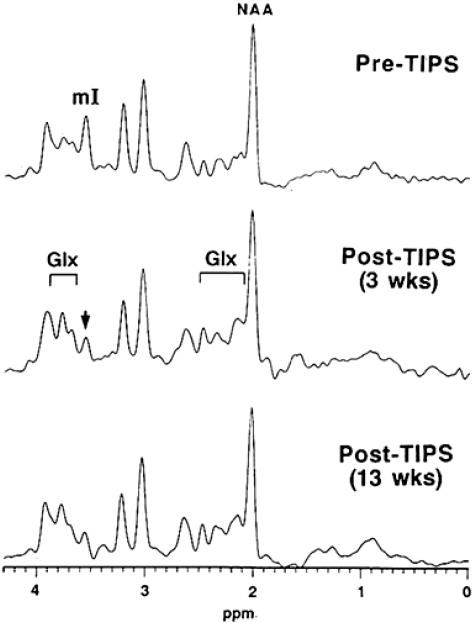
Spectroscopy can open a window into the brain for a variety of neurological disorders by measuring the impact of systemic disease upon the brain. In particular, renal failure and hepatic disease result in biochemical changes in the brain that often precede any detectable changes in clinical tests. Due to the heightened sensitivity of spectroscopy, it can be used as a primary therapeutic monitoring tool in transjugular intrahepatic systemic shunt therapy (TIPS) and other therapies for overt or subclinical hepatic encephalopathy (HE).34–36 TIPS is a novel therapy for life-threatening esophageal bleeding resulting from portal hypertension. MRS was used to measure brain metabolites in those patients awaiting TIPS and after TIPS surgery. It was discovered that 67% of the patients awaiting TIPS already had subclinical hepatic encephalopathy (SCHE) or overt HE. After TIPS, cerebral glutamine was increased in those patients, indicating an increased severity of HE after the surgical procedure. Those patients who showed no evidence of SCHE or HE developed decreased mI after surgery, indicating that TIPS may induce HE in those patients that do not already suffer from it (FIG. 12). In this sense, MRS can not only be used for monitoring patients for subclinical changes but also to screen TIPS candidates to permit the introduction of preventive therapies which reduce the incidence of overt HE after TIPS.
FIG. 12.
1H MR spectra showing the effects of TIPS on a patient without prior HE or SCHE. (Note the decrease in mI and increase in Glx that are indicative of SCHE.)
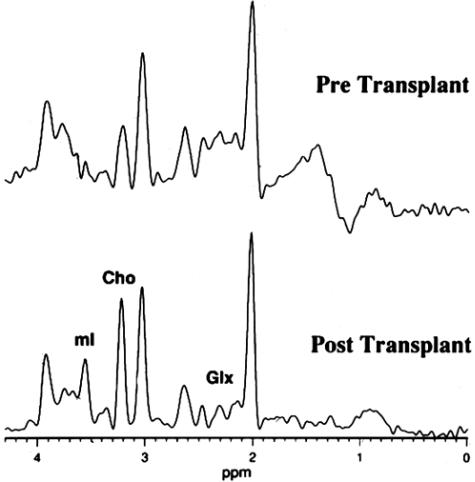
For the treatment of hepatic encephalopathy by liver transplantation, equally dramatic results can be achieved with neurospectroscopy. Once again, MRS can be used to screen those patients for SCHE or HE using brain metabolites alone. Those who are candidates for liver transplant are examined with MRS both before and after liver transplant. As can be expected, patients with severe HE demonstrate the three by now familiar metabolic changes associated with HE: severely decreased mI, increased glutamine, and decreased Cho. In a study of 14 candidates for liver transplant, MRS was acquired both before and after surgery.37 Just 7–8 weeks after transplantation, cerebral metabolite abnormalities were completely reversed to near-normal concentrations as shown in Figure 13. Even those patients with less severe metabolic changes (i.e., only reduced Cho) demonstrated reversal of brain metabolite abnormalities. A single patient in whom such normalization did not occur was found to have a portal vein thrombus which responded to further treatment (Ross, B.D., T. Michaelis, J. Videen, and M. Linsey, unpublished data).
FIG. 13.
Effect of liver transplant in a patient with chronic hepatic encephalopathy. Pretransplant spectra were acquired 1 year before liver transplantation. Note that all three spectral changes for HE are present: severely decreased mI, increased Glx, and decreased Cho. The post-transplant spectra were acquired just 7 weeks after surgery. Note that all of the metabolic changes in HE are now reversed: mI, Glx, and Cho have returned to normal levels.
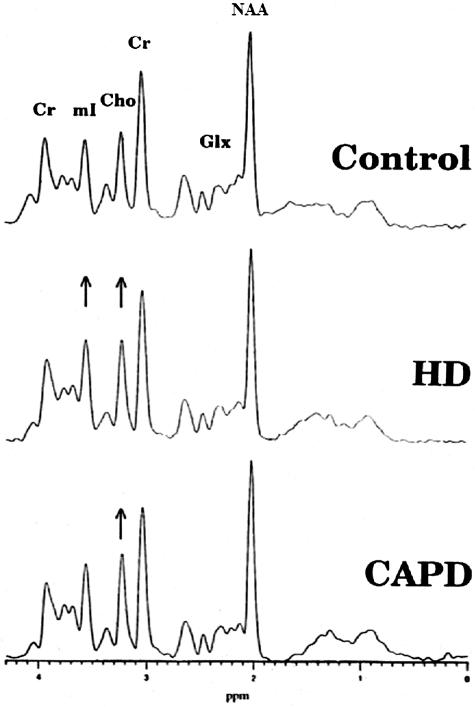
MRS can also provide criteria from which different choices of treatment can be determined. This is illustrated in end-stage renal failure (ESRF) where the choice of hemodialysis (HD) or continuous ambulatory peritoneal dialysis (CAPD) is offered. In a study of 20 ESRF patients where 15 were on HD and 5 on CAPD, MRS was used to determine the effects of these treatments on brain metabolites.38 Results of the study demonstrated significantly increased mI and Cho (18% and 12%, respectively) in patients with HD treatment, whereas CAPD demonstrated greater change in Cho than in HD but no change in mI as shown in Figure 14. In both treatments, NAA was slightly but not significantly decreased. These cerebral metabolite changes are thought to result from osmotic dysregulation as supported by abnormal concentrations of mI in the brain. Conversely, renal transplantation appears to completely normalize cerebral metabolites.35
FIG. 14.
MR spectroscopic evaluation of different treatments for end-stage renal failure. Top: Control spectrum can be compared to those patients on middle: hemodialysis (HD) and bottom: peritoneal dialysis.
Hypoxia
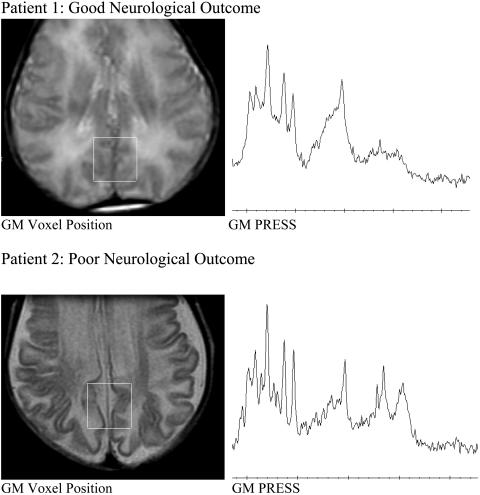
The diagnostic and predictive value of 1H MRS in hypoxic encephalopathy depends upon careful standardization of the MRS technique and an awareness of the strong dependence of spectral appearances and metabolite ratios upon the gestational and post-natal age of the subject. Two spectra are presented (FIG. 15). In each case MRS was performed at the neonatologist's request after a pediatric neurological opinion suggested severe hypoxic brain injury with very guarded prognosis in both infants. The same brain location (in the watershed area of gray matter in the future posterior cingulate gyrus) and the same 1H MRS method (PRESS TE 35 ms; voxel size 8 cm3) was selected for each infant: Patient 1 was comatose when examined on day 1, but the neurological outcome was excellent: the child was alert when examined with 1H MRS again on day 4 (not shown). Patient 2 was examined in coma on day 5 and again on day 35 (not shown). The clinical neurological outcome was poor. The presence of lipid and lactate, as well as lower than normal NAA/Cr, differentiated these two spectra sufficiently to provide prognostic information at the first MRS examination.
FIG. 15.
Predictive value of 1H MRS in hypoxic encephalopathy. Two pairs of studies are presented, and in each case MRS was performed at the neonatologist's request after a neurological opinion suggested severe hypoxic brain injury with very guarded prognosis: Patient 1, in whom the neurological outcome was excellent, was a comatose infant examined on day 1 and again on day 4 (not shown). Patient 2, in whom neurological outcome was poor, was examined in coma on day 5 and again on day 35 (not shown).
Since the early reports of long-echo time,39 short echo-time40 or chemical shift imaging,41 1H MRS has contributed to no fewer than 137 published papers, reviews, and full-length abstracts. Of these, 20 studies covering 459 patients find correlation between MRS performed early (1–20 days after birth) and neurological or neurodevelopmental outcome at up to 1 year. To our knowledge, 1H MRS is used in neonatal units throughout the world. Despite the many papers, none cites in either abstract or text the term efficacy. Hence, in evidence-based [efficacy-based medicine (EBM)-Cochrane system] analysis, MRS does not feature among the many approved diagnostic management tools for hypoxic brain injury. Given the diagnostic precision discussed in the preceding paragraphs, this is a surprising conclusion. EBM asks another question: does MRS improve patient outcome? MRS studies, which often speak of outcome in the context of neurological sequence of the original insult, miss the point of outcome measure in EBM. Here we know of only one report in which 1H MRS actually influenced patient outcome.42 With the approval of the local Hospital Ethics Committee, ventilator support was terminated if 1H MRS findings, clinical neurology, and EEG all concurred in predicting vegetative outcome as the result of near-drowning. The complexity of researching efficacy in a disease when there is no treatment is well recognized.
We must also consider competing technologies. Depending upon the age of the patient, clinical neurological examination, bed-side ultrasound for detection of intracerebral hemorrhage, infrared spectroscopy for assay of redox-state, computerized tomography (CT) for detection of hemorrhage, cortical atrophy and ventricular dilatation, and above all the ever-growing list of MRI techniques T1, T2 fluid-attenuated inversion recovery (FLAIR), diffusion-weighted imaging, perfusion and magnetic resonance angiography (MRA) must be considered as barriers to use of 1H MRS. This is because such techniques are familiar and accepted as efficacious by international regulatory bodies. To be fair to 1H MRS, studies need only to report efficacy equal to one other of the procedures to pass the test of efficacy-based medicine. Only two published reports have been found which meet these stringent requirements.42,43 A single well-designed, multiple-site clinical trial involving a total of 100 cases of neonatal (or adult) hypoxic-ischemic brain injury would be extremely beneficial toward correcting this defect.
PART II
What does the neurologist have to gain from the use of MRS?
The previous discussion, based largely upon anecdotal or small published studies from our clinical practice of MRS, introduces several opportunities for the treating clinician. If we can, through MRS, at minimum cost and little inconvenience to our patients, add precision to existing diagnoses, make new and unexpected diagnoses, define responses to therapy rapidly and noninvasively and in a time-frame that permits real-time modifications, alter our treatment regime or predict the neurological outcome early in a hospital stay, much is to be gained. The intellectual advantages are obvious; the cost-benefits equally so. The patient benefits in terms of quality of life and the societal benefits that flow from the improved application of medical technology to neurology are likely to be great. Translating the current state of knowledge to neurological practice is more difficult, not least because of the scattered supportive evidence for MRS. An important missing factor is an available literature on efficacy of MRS in clinical decision making and therapeutic choice. We have extracted from over 20,000 published MRS reports known to us, a fraction (approximately 30) of papers that include this goal in the title, abstract, and results. This provides much less assurance than needed to alter neurological clinical practice. To do that requires (still!) well-organized prospective clinical trials of diagnostic impact for each of the MRS findings in more than 100 neurological diagnoses that have been demonstrated to date. This aspect is addressed below (Section III). Here we ask ourselves why after more than 20 years of MRS in clinical neurology, and quite unlike PET, single-photon emission computer tomography, electro-encephalogram (EEG), and magneto-encephalogram (MEG), the technique of MRS has thus far failed to gain acceptance among clinicians? MRS, as a functional and chemical analytical tool, has not sat easily within the MRI establishment where training and experience focus on structural anatomy. Treating physicians, in this case usually neurologists, must be responsible for the ordering, evaluation, and reading of the spectra on their own patients. The nuances of MRS are at least as complex as those of the electrocardiogram or EEG, both of which are firmly in the hands of clinicians of their specialties—cardiology and neurology, respectively.
PART III
Toward evidence-based MRS in neurological diagnosis and treatment
MRS recently failed its only test at the hands of EBM! Prepared by the Tufts-New England Medical Center Evidence-based Practice Center, the review assessed the value of MRS for diagnostic evaluation, surgical planning and patient management of space-occupying brain tumors (Agency for Healthcare Research and Quality; Contract No. 290-02-0022) and was published on-line in April 2003.22 The report never received peer review and is no longer available on the CMS web site. Despite that, a recent ruling by Medicare determined after several years of approved use under CPT 76390 that MRS is “investigational.” The brief conclusion is given in full here, and summarized with the present authors' comments as Table 1.
TABLE 1.
MRS for differentiation of brain tumor from radiation necrosis technology assessment (2003):22 present author's comment and proposed action summary
| Category | Description | Evidence Summary | Author's Comments | Action Proposed |
|---|---|---|---|---|
| 1 | Technical feasibility and optimization | Large amount of evidence | Agree | Standardization, automation, quality assurance, multisite trials in the U.S. and abroad |
| 2 | Diagnostic accuracy | Limited evidence | Strongly disagree | 2500 Cases from published literature |
| Distinguish neoplasm from non-neoplasm | Limited evidence | Disagree | Added value implicit in 1 | |
| MRS added to MRI | Limited evidence | Disagree | Work in progress | |
| Tumor grading | Limited evidence | Agree | Computer-aided diagnosis | |
| Differentiate intracranial cystic lesions | Limited evidence | Disagree | Several publications/assessment limited to too-few and incorrect measure(s) | |
| 3 | Diagnostic thinking impact | Limited evidence | Agree | Trials required |
| 4 | Therapeutic choice impact | Limited evidence | Agree | Trials required |
| 5 | Patient outcome impact | No evidence | Agree | Trials required |
| 6 | Societal impact | No evidence | Agree | QOL/health-care economist designed trials required |
“Human studies conducted on the use of MRS for brain tumors demonstrate that this noninvasive method is technically feasible and suggest potential benefits for some of the proposed indications. However, there is a paucity of high quality direct evidence demonstrating the impact on diagnostic thinking and therapeutic decision making. In addition, the techniques for acquiring the MRS spectra and interpreting the results are not well standardized. In summary, whereas there are a large number of studies that confirm MRS' technical feasibility, there are very few published studies to evaluate its diagnostic accuracy and whether it can positively affect diagnostic thinking and therapeutic choice. Those studies that do address these areas often have significant design flaws including inadequate sample size, retrospective design and other limitations that could bias the results.” The italics are ours: automation, standardization and systematic reporting of MRS, identified as lacking from the published literature on MRS is actually a “fact-of-clinical-life” and available to all clinical Neurospectroscopists from whatever discipline,44 and can reasonably be expected to dominate all future publications (see Recommendations, below).
The effects of this utterly negative assessment have been dire based on this single adverse EBM. Medicare has reversed its reimbursement for CPT 76390 for MRS in all neurological diagnoses, declaring MRS once again investigational for all clinical applications, not merely the one examined in the EBM. What went wrong? What can be done?
What went wrong is identified with great precision by the authors of the Technology Assessment and recommendations to right these wrongs.
Lack of standardization in acquisition and interpretation of MRS? MRS, to the expert, is a rather simple and quantitative science. Different magnetic field strengths, different methods of localization, single or multiple spectra, acquisition protocols, different expressions for metabolite ratios, and markedly different appearances of the spectra themselves are of no consequence to the expert. They are no more baffling than the differences between T1- or T2-weighted MRI and should not have been of much concern to the assessors in this case. The story in brain tumor is relatively simple, with 5 well-rehearsed biochemical markers that distinguish recurrent tumor, from necrosis and tumor from other mass lesions. They are, however, very difficult for the uninitiated. The assessors took the easy way out—one metabolite (choline) rather than 5—and confusion over which ratio to believe. We now have a near-consensus among manufacturers and users (MR technologists bear the primary responsibility and have, to date, received no systematic training, although such programs are becoming available45), with normative data for all common MRS techniques. Perhaps it is time for journal editors, reviewers, and typesetters to apply a Vancouver Convention to their MRS publications? At the very least, the clinician should insist upon a convention for MRS. (Interestingly, no such convention has been applied to MRI protocols, which also differ greatly from one Institution and one diagnosis to another, despite many years of exhortation from authors of textbooks of radiology.) Perhaps we can do better in MRS?
The assessors identified poor study design! The practice of MRS has been almost exclusively “defensive” up to now. By which we mean, the authors are more concerned with avoiding criticism of their fledgling technique, dotting i's and crossing t's but ignoring controls, blind studies, reference to gold standards and above all, working with far too few patients. Hence, the summary that 90% of all accepted literature dealt with technical features—and thankfully that is now in the past. Studies in the future should concentrate on issues of efficacy, effect on patient management, improved clinical outcome, and societal impact.
Clinical trials almost entirely avoided the real questions—possibly because they are only now for the first time being clearly enunciated. EBM (and Medicare) want impact, not information. Those (mostly scientists) who have dominated clinical MRS trials live in a different world where accurate information is knowledge, knowledge is paramount, and impact is self-evident. Not so for EBM—impact must itself be quantified. In this assessment (of brain tumor), only three papers from two institutions fit the ideals of EBM! We have added approximately 30 papers we have casually identified which address impact of MRS in this and other neurological diagnoses (see references). Nonetheless, studies to specifically address those concerns by EBM must be undertaken.
Although the assessors cannot be criticized for doing what they were asked by the American College of Radiology and DHSS, in the opinion of the authors, this was the wrong battlefield on which to fight for the future of MRS in neurology. Given the almost stagnant state of therapy, tumor diagnosis in the brain currently has so little impact that improving it by even a healthy margin, as MRS undoubtedly does, has almost no bearing on clinical outcome, which is universally dismal. We would hope that the next EBM evaluation will be in areas where diagnosis and therapeutic monitoring decisions can be decisive. Several of these are offered in the earlier part of our article.
A recent search for clinical utility and efficacy of spectroscopy across the multitude of neurological diseases covered in this review is included.46–93
REFERENCES
- 1.Ross BD. Real or imaginary? Human metabolism through nuclear magnetism. IUBMB Life 50: 177–187, 2000. [DOI] [PubMed] [Google Scholar]
- 2.Matchar D, Kulasingam S, Huntington B, Patwardhan M, Mann L. Technology assessment: Positron emission tomography, single photon emission computed tomography, computed tomography, functional magnetic resonance imaging, and magnetic resonance spectroscopy for the diagnosis and management of Alzheimer's disease. Durham, NC: Duke Center for Clinical Health Policy Research and Evidence Practice Center, 2004. [PubMed]
- 3.Bluml S, Philippart M, Schiffmann R, Seymour K, Ross BD. Membrane phospholipids and high-energy metabolites in childhood ataxia with CNS hypomyelination. Neurology 61: 648–654, 2003. [DOI] [PubMed] [Google Scholar]
- 4.Ross B, Lin A, Harris K, Bhattacharya P, Schweinsburg B. Clinical experience with 13C MRS in vivo. NMR Biomed 16: 358–369, 2003. [DOI] [PubMed] [Google Scholar]
- 5.Danielsen E, Ross BD. Magnetic resonance spectroscopy diagnosis of neurological diseases. New York: Marcel-Dekker, 1999.
- 6.Lin A, Nguy CH, Shic F, Ross BD. Accumulation of methylsulfonylmethane in the human brain: identification by multinuclear magnetic resonance spectroscopy. Toxicol Lett 123: 169–177, 2001. [DOI] [PubMed] [Google Scholar]
- 7.Lin AP, Ross BD. Short-echo time proton MR spectroscopy in the presence of gadolinium. J Comput Assist Tomogr 25: 705–712, 2001. [DOI] [PubMed] [Google Scholar]
- 8.Shonk TK, Moats RA, Gifford P, Michaelis T, Mandigo JC, Izumi J, et al. Probable Alzheimer disease: diagnosis with proton MR spectroscopy. Radiology 195: 65–72, 1995. [DOI] [PubMed] [Google Scholar]
- 9.Dickerson BC, Sperling RA. Neuroimaging biomarkers for clinical trials of disease-modifying therapies in Alzheimer's disease. NeuroRx 2: 348–360, 2005. [DOI] [PMC free article] [PubMed] [Google Scholar]
- 10.Kantarci K, Xu Y, Shiung MM, O’Brien PC, Cha RH, Smith GE, et al. Comparative diagnostic utility of different MR modalities in mild cognitive impairment and Alzheimer’s disease. Dement Geriatr Cogn Disord 14: 198–207, 2002. [DOI] [PMC free article] [PubMed] [Google Scholar]
- 11.Moats RA, Ernst T, Shonk TK, Ross BD. Abnormal cerebral metabolite concentrations in patients with probable Alzheimer disease. Magn Reson Med 32: 110–115, 1994. [DOI] [PubMed] [Google Scholar]
- 12.Miller BL, Moats RA, Shonk T, Ernst T, Woolley S, Ross BD. Alzheimer disease: depiction of increased cerebral myo-inositol with proton MR spectroscopy. Radiology 187: 433–437, 1993. [DOI] [PubMed] [Google Scholar]
- 13.Moats RA, Shonk T. Evaluation of automated MR spectroscopy: application in Alzheimer disease. AJNR Am J Neuroradiol 16: 1779–1782, 1995. [PMC free article] [PubMed] [Google Scholar]
- 14.Valenzuela MJ, Sachdev P. Magnetic resonance spectroscopy in AD. Neurology 56: 592–598, 2001. [DOI] [PubMed] [Google Scholar]
- 15.Chien N, Shieh D, Izum iJ, Nguyen C, Shic F, Lin A, et al. Validation of magnetic resonance spectroscopy in diagnosing Alzheimer's disease. J Am Geriatr Soc 48: 176, 2000. [Google Scholar]
- 16.Nguy C, Zapata M, Shic F, Lin A, Shieh D, Chien N. Efficacy of magnetic resonance spectroscopy (MRS) for clinical Alzheimer's disease. Proc Int Soc Magn Reson Med 9: 989, 2001. [Google Scholar]
- 17.Lin A, Kopyov O, Ross B, Philipott L, Jacques D. Monitoring intrahippocampal neurotransplant for Alzheimer's disease. Neurology 56: 20, 2001. [Google Scholar]
- 18.Ross BD, Hoang TQ, Bluml S, Dubowitz D, Kopyov OV, Jacques DB, et al. In vivo magnetic resonance spectroscopy of human fetal neural transplants. NMR Biomed 12: 221–236, 1999. [DOI] [PubMed] [Google Scholar]
- 19.Kreis R, Ernst T, Ross BD. Development of the human brain: in vivo quantification of metabolite and water content with proton magnetic resonance spectroscopy. Magn Reson Med 30: 424–437, 1993. [DOI] [PubMed] [Google Scholar]
- 20.Bluml S, Kopyov O, Jacques S, Ross BD. Activation of neurotransplants in humans. Exp Neurol 158: 121–125, 1999. [DOI] [PubMed] [Google Scholar]
- 21.Lin A, Bluml S, Mamelak AN. Efficacy of proton magnetic resonance spectroscopy in clinical decision making for patients with suspected malignant brain tumors. J Neurooncol 45: 69–81, 1999. [DOI] [PubMed] [Google Scholar]
- 22.Jordan H, Bert R, Chew P, Kupelnick B, Lau J. Magnetic resonance spectroscopy for brain tumors. EPC Technical Support of the CPTA Technology Assessment Program. Prepared for the Agency for Healthcare Research and Quality (AHRQ). Rockville, MD: AHRQ; 2003. Contract No. 290-02-0022, Task Order 1.
- 23.Meyerhoff DJ, Bloomer C, Cardenas V, Norman D, Weiner MW, Fein G. Elevated subcortical choline metabolites in cognitively and clinically asymptomatic HIV+ patients. Neurology 52: 995–1003, 1999. [DOI] [PubMed] [Google Scholar]
- 24.Lin A, Grossman T, Shriner K, Friedman M, Nguy C, Ling J, et al. Double blind trial of 1H MRS monitoring antiretroviral therapy. Proc Int Soc Magn Reson Med 8: 1174, 2000. [Google Scholar]
- 25.Lin A, Denham J, Smillie J, Wijesinge A, Enriquez C, Harris K, et al. Abnormal brain 1H MRS may be predictive of lipodystrophy in HIV positive patients. Paper presented at the International Society of Magnetic Resonance in Medicine Workshop on Dynamic Spectroscopy and Measurements of Physiology, Metabolism, and Function, Orlando, FL, 2003.
- 26.Chang L, Miller BL, McBride D, Cornford M, Oropilla G, Buchthal S, et al. Brain lesions in patients with AIDS: H-1 MR spectroscopy. Radiology 197: 525–531, 1995. [DOI] [PubMed] [Google Scholar]
- 27.Tan J, Ross BD, Hoang TQ, Bluml S, Moats R. Retardation of PML progression by protease inhibitor. Proc Int Soc Magn Reson Med 6: 1755, 1998. [Google Scholar]
- 28.Seymour K, Hwang J, Bluml S, Danielsen E, Ross B. Potential of proton MRS in the management and therapeutic monitoring of white matter diseases. J Mol Neurosci 13: 258–261, 1999. [Google Scholar]
- 29.Eichler FS, Barker PB, Cox C, Edwin D, Ulug AM, Moser HW, et al. Proton MR spectroscopic imaging predicts lesion progression on MRI in X-linked adrenoleukodystrophy. Neurology 58: 901–907, 2002. [DOI] [PubMed] [Google Scholar]
- 30.Kruse B, Barker PB, van Zijl PC, Duyn JH, Moonen CT, Moser HW. Multislice proton magnetic resonance spectroscopic imaging in X-linked adrenoleukodystrophy. Ann Neurol 36: 595–608, 1994. [DOI] [PubMed] [Google Scholar]
- 31.Pouwels PJ, Kruse B, Korenke GC, Mao X, Hanefeld FA, Frahm J Quantitative proton magnetic resonance spectroscopy of childhood adrenoleukodystrophy. Neuropediatrics 29: 254–264, 1998. [DOI] [PubMed] [Google Scholar]
- 32.Leone P. Results of human genetic engineering trials to restore aspartoacylase in cases of Canavan disease. Paper presented at the First International Symposium on N-Acetylaspartate, Bethesda, MD, September 13, 2004.
- 33.Cecil KM, DeGrauw TJ, Salomons GS, Jakobs C, Egelhoff JC, Clark JF. Magnetic resonance spectroscopy in a 9-day-old heterozygous female child with creatine transporter deficiency. J Comput Assist Tomogr 27: 44–47, 2003. [DOI] [PubMed] [Google Scholar]
- 34.Farrow N, Korula J, Kries R, Ernst T, Villami F, BD R, et al. Does transhepatic intraportal systemic shunt induce hepatic encephalopathy? Radiology 185: 173, 1992.1523303 [Google Scholar]
- 35.Geissler A, Farrow N, Villami F, Makowka L, Ernst T, Kries R, Ross BD. Is hepatic encephalopathy reversed by liver transplantation? Proc Soc Magn Reson Med 11: 647, 1992. [Google Scholar]
- 36.Shonk T, Ernst T, Lee J, Moats R, Korula J, Ross B. 1H MRS defines increased incidence of hepatic encephalopathy in TIPS candidates. Proc Soc Magn Reson Med 12: 1554, 1993. [Google Scholar]
- 37.Kreis R, Geissler A, Ernst T, Villami F, Ross B. Reversal of chronic hepatic encephalopathy by liver transplantation as defined by localized proton magnetic resonance spectroscopy. Paper presented at the Falk Symposium, Basel, Switzerland, October 1992.
- 38.Michealis T, Videen J, Linsey M, Ross B. Cerebral metabolites in end stage renal disease. Proc Soc Magn Reson Med 13: 306, 1994. [Google Scholar]
- 39.Grodd W, Krageloh-Mann I, Klose U, Sauter R. Metabolic and destructive brain disorders in children: findings with localized proton MR spectroscopy. Radiology 181: 173–181, 1991. [DOI] [PubMed] [Google Scholar]
- 40.Kreis R, Ernst T, Arcinue E, Lieberman R, Ross B. Myoinositol in short TE 1H-MRS: a new indicator of neonatal brain development and pathology. Proc Soc Magn Reson Med 10: 1007, 1991. [Google Scholar]
- 41.Peden CJ, Cowan FM, Bryant DJ, Sargentoni J, Cox IJ, Menon DK, et al. Proton MR spectroscopy of the brain in infants. J Comput Assist Tomogr 14: 886–894, 1990. [DOI] [PubMed] [Google Scholar]
- 42.Kreis R, Arcinue E, Ernst T, Shonk TK, Flores R, Ross BD. Hypoxic encephalopathy after near-drowning studied by quantitative 1H-magnetic resonance spectroscopy. J Clin Invest 97: 1142–1154, 1996. [DOI] [PMC free article] [PubMed] [Google Scholar]
- 43.Ashwal S, Holshouser BA, Shu SK, Simmons PL, Perkin RM, Tomasi LG, et al. Predictive value of proton magnetic resonance spectroscopy in pediatric closed head injury. Pediatr Neurol 23: 114–125, 2000. [DOI] [PubMed] [Google Scholar]
- 44.GE MR Master Series: MR Spectroscopy Course. General Electric Healthcare. Available at: http://www.gehealthcare.com/usen/mr/education/docs/ross.pdf. Accessed October 2, 2004.
- 45.sMRT Course: Spectroscopy for MR Technologists. Spectroscopy Institute. Available at: http://www.spectroscopy.org/sMRT.htm. Accessed October 2, 2004.
- 46.Chan AA, Lau A, Pirzkall A, Chang SM, Verhey LJ, Larson D, et al. Proton magnetic resonance spectroscopy imaging in the evaluation of patients undergoing gamma knife surgery for Grade IV glioma. J Neurosurg 101: 467–475, 2004. [DOI] [PubMed] [Google Scholar]
- 47.Gajewicz W, Goraj B. [Possibilities in the differential diagnosis of brain neoplasms using the long and short time sequences of proton magnetic resonance spectroscopy]. Pol Merkuriusz Lek 16: 151–156, 2004. [PubMed] [Google Scholar]
- 48.Gajewicz W, Papierz W, Szymczak W, Goraj B. The use of proton MRS in the differential diagnosis of brain tumors and tumor-like processes. Med Sci Monit 9: MT97–MT105, 2003. [PubMed] [Google Scholar]
- 49.Cho YD, Choi GH, Lee SP, Kim JK. (1)H-MRS metabolic patterns for distinguishing between meningiomas and other brain tumors. Magn Reson Imaging 21: 663–672, 2003. [DOI] [PubMed] [Google Scholar]
- 50.Dembowska-Baginska B, Perek D, Perek-Polnik M, Drogosiewicz M, Jurkiewicz E, Pakula-Kosciesza I, et al. [Can proton magnetic resonance spectroscopy be of any value as a prognostic factor in medulloblastoma?]. Med Wieku Rozwoj 7: 229–239, 2003. [PubMed] [Google Scholar]
- 51.Rutkowski T, Tarnawski R, Sokol M, Maciejewski B. 1H-MR spectroscopy of normal brain tissue before and after postoperative radiotherapy because of primary brain tumors. Int J Radiat Oncol Biol Phys 56: 1381–1389, 2003. [DOI] [PubMed] [Google Scholar]
- 52.Murphy PS, Rowland IJ, Viviers L, Brada M, Leach MO, Dzik-Jurasz AS. Could assessment of glioma methylene lipid resonance by in vivo (1)H-MRS be of clinical value? Br J Radiol 76: 459–463, 2003. [DOI] [PubMed] [Google Scholar]
- 53.Weber MA, Lichy MP, Thilmann C, Gunther M, Bachert P, Maudsley AA, et al. [Monitoring of irradiated brain metastases using MR perfusion imaging and 1H MR spectroscopy]. Radiologe 43: 388–395, 2003. [DOI] [PubMed] [Google Scholar]
- 54.Kubas B, Tarasow E, Dzienis W, Lebkowski W, Zimnoch L, Dzieciol J, et al. [Magnetic resonance proton spectroscopy in neurooncology—preliminary report]. Neurol Neurochir Pol 35(Suppl 5): 90–100, 2001. [PubMed] [Google Scholar]
- 55.Traber F, Block W, Flacke S, Lamerichs R, Schuller H, Urbach H, et al. [1H-MR spectroscopy of brain tumors in the course of radiation therapy: use of fast spectroscopic imaging and single-voxel spectroscopy for diagnosing recurrence]. Rofo 174: 33–42, 2002. [DOI] [PubMed] [Google Scholar]
- 56.Sabatier J, Ibarrola D, Malet-Martino M, Berry I. [Brain tumors: interest of magnetic resonance spectroscopy for the diagnosis and the prognosis]. Rev Neurol (Paris) 157: 858–862, 2001. [PubMed] [Google Scholar]
- 57.Dowling C, Bollen AW, Noworolski SM, McDermott MW, Barbaro NM, Day MR, et al. Preoperative proton MR spectroscopic imaging of brain tumors: correlation with histopathologic analysis of resection specimens. AJNR Am J Neuroradiol 22: 604–612, 2001. [PMC free article] [PubMed] [Google Scholar]
- 58.Walecki J, Sokol M, Pieniazek P, Maciejewski B, Tarnawski R, Krupska T, et al. Role of short TE 1H-MR spectroscopy in monitoring of post-operation irradiated patients. Eur J Radiol 30: 154–161, 1999. [DOI] [PubMed] [Google Scholar]
- 59.Girard N, Wang ZJ, Erbetta A, Sutton LN, Phillips PC, Rorke LB, et al. Prognostic value of proton MR spectroscopy of cerebral hemisphere tumors in children. Neuroradiology 40: 121–125, 1998. [DOI] [PubMed] [Google Scholar]
- 60.Taylor JS, Langston JW, Reddick WE, Kingsley PB, Ogg RJ, Pui MH, et al. Clinical value of proton magnetic resonance spectroscopy for differentiating recurrent or residual brain tumor from delayed cerebral necrosis. Int J Radiat Oncol Biol Phys 36: 1251–1261, 1996. [DOI] [PubMed] [Google Scholar]
- 61.Moats RA, Watson L, Shonk T, Tokuyama S, Braslau D, Eto R, et al. Added value of automated clinical proton MR spectroscopy of the brain. J Comput Assist Tomogr 19: 480–491, 1995. [DOI] [PubMed] [Google Scholar]
- 62.Rudkin TM, Arnold DL. Proton magnetic resonance spectroscopy for the diagnosis and management of cerebral disorders. Arch Neurol 56: 919–926, 1999. [DOI] [PubMed] [Google Scholar]
- 63.Silberstein M, Dodd S. Proton MR spectroscopy of the brain: clinically useful information obtained in assessing CNS damage in children. AJR Am J Roentgenol 168: 1379–1380, 1997. [DOI] [PubMed] [Google Scholar]
- 64.Wang Z, Zimmerman RA, Sauter R. Proton MR spectroscopy of the brain: clinically useful information obtained in assessing CNS diseases in children. AJR Am J Roentgenol 167: 191–199, 1996. [DOI] [PubMed] [Google Scholar]
- 65.Holshouser BA, Ashwal S, Luh GY, Shu S, Kahlon S, Auld KL, et al. Proton MR spectroscopy after acute central nervous system injury: outcome prediction in neonates, infants, and children. Radiology 202: 487–496, 1997. [DOI] [PubMed] [Google Scholar]
- 66.Ashwal S, Holshouser BA, Tomasi LG, Shu S, Perkin RM, Nystrom GA, et al. 1H-magnetic resonance spectroscopy-determined cerebral lactate and poor neurological outcomes in children with central nervous system disease. Ann Neurol 41: 470–481, 1997. [DOI] [PubMed] [Google Scholar]
- 67.Danielsen ER, Thomsen C. [Proton MRS: a prognostic and diagnostic tool in the diagnosis of diffuse brain diseases]. Ugeskr Laeger 163: 4358–4364, 2001. [PubMed] [Google Scholar]
- 68.Korson MS. Advances in newborn screening for metabolic disorders: what the pediatrician needs to know. Pediatr Ann 29: 294–301, 2000. [DOI] [PubMed] [Google Scholar]
- 69.Garnett MR, Blamire AM, Rajagopalan B, Styles P, Cadoux-Hudson TA. Evidence for cellular damage in normal-appearing white matter correlates with injury severity in patients following traumatic brain injury: a magnetic resonance spectroscopy study. Brain 123(Pt 7): 1403–1409, 2000. [DOI] [PubMed] [Google Scholar]
- 70.Rovaris M, Filippi M. The value of new magnetic resonance techniques in multiple sclerosis. Curr Opin Neurol 13: 249–254, 2000. [DOI] [PubMed] [Google Scholar]
- 71.Hagberg G. From magnetic resonance spectroscopy to classification of tumors. A review of pattern recognition methods. NMR Biomed 11: 148–156, 1998. [DOI] [PubMed] [Google Scholar]
- 72.Taylor DJ. Clinical utility of muscle MR spectroscopy. Semin Musculoskelet Radiol 4: 481–502, 2000. [DOI] [PubMed] [Google Scholar]
- 73.Lichy MP, Bachert P, Henze M, Lichy CM, Debus J, Schlemmer HP. Monitoring individual response to brain-tumour chemotherapy: proton MR spectroscopy in a patient with recurrent glioma after stereotactic radiotherapy. Neuroradiology 46: 126–129, 2004. [DOI] [PubMed] [Google Scholar]
- 74.Grand S, Esteve F, Remy C, Rubin C, Le Bas JF. [Proton magnetic resonance spectroscopy: a metabolic approach of cerebral tumors and their follow-up after external radiation therapy]. Rev Med Interne 18: 865–875, 1997. [DOI] [PubMed] [Google Scholar]
- 75.Byrd SE, Tomita T, Palka PS, Darling CF, Norfray JP, Fan J Magnetic resonance spectroscopy (MRS) in the evaluation of pediatric brain tumors. Part II: Clinical analysis. J Natl Med Assoc 88: 717–723, 1996. [PMC free article] [PubMed] [Google Scholar]
- 76.Houkin K, Kamada K, Sawamura Y, Iwasaki Y, Abe H, Kashiwaba T. Proton magnetic resonance spectroscopy (1H-MRS) for the evaluation of treatment of brain tumours. Neuroradiology 37: 99–103, 1995. [DOI] [PubMed] [Google Scholar]
- 77.Vion-Dury J, Meyerhoff DJ, Cozzone PJ, Weiner MW. What might be the impact on neurology of the analysis of brain metabolism by in vivo magnetic resonance spectroscopy? J Neurol 241: 354–371, 1994. [DOI] [PubMed] [Google Scholar]
- 78.Swindells S, McConnell JR, McComb RD, Gendelman HE. Utility of cerebral proton magnetic resonance spectroscopy in differential diagnosis of HIV-related dementia. J Neurovirol 1: 268–274, 1995. [DOI] [PubMed] [Google Scholar]
- 79.McConnell JR, Swindells S, Ong CS, Gmeiner WH, Chu WK, Brown DK, et al. Prospective utility of cerebral proton magnetic resonance spectroscopy in monitoring HIV infection and its associated neurological impairment. AIDS Res Hum Retroviruses 10: 977–982, 1994. [DOI] [PubMed] [Google Scholar]
- 80.Ernst T, Chang L, Arnold S. Increased glial metabolites predict increased working memory network activation in HIV brain injury. Neuroimage 19: 1686–1693, 2003. [DOI] [PubMed] [Google Scholar]
- 81.Shu SK, Ashwal S, Holshouser BA, Nystrom G, Hinshaw DB Jr. Prognostic value of 1H-MRS in perinatal CNS insults. Pediatr Neurol 17: 309–318, 1997. [DOI] [PubMed] [Google Scholar]
- 82.Jalan R, Olde Damink SW, Hayes PC, Wardlaw JM. Diagnosis of hepatic encephalopathy: will in vivo proton MRS play a role? Hepatology 29: 1605–1607, 1999. [DOI] [PubMed] [Google Scholar]
- 83.Ross BD, Danielsen ER, Bluml S. Proton magnetic resonance spectroscopy: the new gold standard for diagnosis of clinical and subclinical hepatic encephalopathy? Dig Dis 14(Suppl 1): 30–39, 1996. [DOI] [PubMed] [Google Scholar]
- 84.Barkovich AJ, Baranski K, Vigneron D, Partridge JC, Hallam DK, Hajnal BL, et al. Proton MR spectroscopy for the evaluation of brain injury in asphyxiated, term neonates. AJNR Am J Neuroradiol 20: 1399–1405, 1999. [PMC free article] [PubMed] [Google Scholar]
- 85.Amess PN, Penrice J, Wylezinska M, Lorek A, Townsend J, Wyatt JS, et al. Early brain proton magnetic resonance spectroscopy and neonatal neurology related to neurodevelopmental outcome at 1 year in term infants after presumed hypoxic-ischaemic brain injury. Dev Med Child Neurol 41: 436–445, 1999. [PubMed] [Google Scholar]
- 86.Groenendaal F, van der Grond J, Eken P, van Haastert IC, Rademaker KJ, Toet MC, et al. Early cerebral proton MRS and neurodevelopmental outcome in infants with cystic leukomalacia. Dev Med Child Neurol 39: 373–379, 1997. [DOI] [PubMed] [Google Scholar]
- 87.Garnett MR, Blamire AM, Corkill RG, Cadoux-Hudson TA, Rajagopalan B, Styles P. Early proton magnetic resonance spectroscopy in normal-appearing brain correlates with outcome in patients following traumatic brain injury. Brain 123(Pt 10): 2046–2054, 2000. [DOI] [PubMed] [Google Scholar]
- 88.Friedman SD, Brooks WM, Jung RE, Chiulli SJ, Sloan JH, Montoya BT, et al. Quantitative proton MRS predicts outcome after traumatic brain injury. Neurology 52: 1384–1391, 1999. [DOI] [PubMed] [Google Scholar]
- 89.Federico F, Simone IL, Lucivero V, Giannini P, Laddomada G, Mezzapesa DM, et al. Prognostic value of proton magnetic resonance spectroscopy in ischemic stroke. Arch Neurol 55: 489–494, 1998. [DOI] [PubMed] [Google Scholar]
- 90.Hsu YY, Chang CN, Chu NS, Lim KE, Chang C, Hsu JC. Lateralization and prognostic value of proton magnetic resonance spectroscopy in patients with intractable temporal lobe epilepsy. Chang Gung Med J 24: 768–778, 2001. [PubMed] [Google Scholar]
- 91.Chang KH, Kim HD, Park SW, Song IC, Yu IK, Han MH, et al. Usefulness of single voxel proton MR spectroscopy in the evaluation of hippocampal sclerosis. Korean J Radiol 1: 25–32, 2000. [DOI] [PMC free article] [PubMed] [Google Scholar]
- 92.Waldman AD, Rai GS, McConnell JR, Chaudry M, Grant D. Clinical brain proton magnetic resonance spectroscopy for management of Alzheimer's and sub-cortical ischemic vascular dementia in older people. Arch Gerontol Geriatr 35: 137–142, 2002. [DOI] [PubMed] [Google Scholar]
- 93.Vion-Dury J, Salvan AM, Confort-Gouny S, Cozzone PJ. [Brain proton magnetic resonance spectroscopy. Indications for diagnosis and follow-up of HIV-related encephalopathy in the adult]. Presse Med 27: 1398–1405, 1998. [PubMed] [Google Scholar]


