

SUMMARY
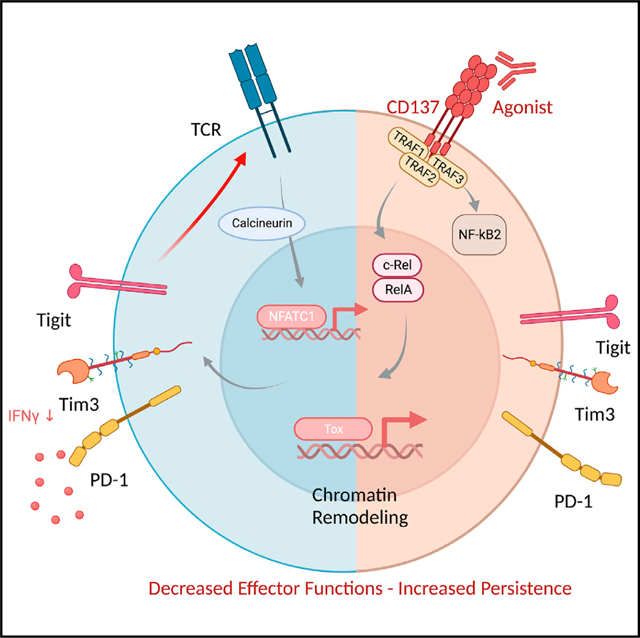
CD137 (4–1BB)-activating receptor represents a promising cancer immunotherapeutic target. Yet, the cellular program driven by CD137 and its role in cancer immune surveillance remain unresolved. Using T cell-specific deletion and agonist antibodies, we found that CD137 modulates tumor infiltration of CD8+-exhausted T (Tex) cells expressing PD1, Lag-3, and Tim-3 inhibitory receptors. T cell-intrinsic, TCR-independent CD137 signaling stimulated the proliferation and the terminal differentiation of Tex precursor cells through a mechanism involving the RelA and cRel canonical NF-κB subunits and Tox-dependent chromatin remodeling. While Tex cell accumulation induced by prophylactic CD137 agonists favored tumor growth, anti-PD1 efficacy was improved with subsequent CD137 stimulation in pre-clinical mouse models. Better understanding of T cell exhaustion has crucial implications for the treatment of cancer and infectious diseases. Our results identify CD137 as a critical regulator of Tex cell expansion and differentiation that holds potential for broad therapeutic applications.
In brief
Manipulating exhausted T (Tex) cells has therapeutic implications. Pichler et al. found that the activating receptor, CD137 (4–1BB), was specifically expressed by Tex cells. CD137 signaling promoted TCR-independent proliferation and terminal differentiation of Tex cells. In murine tumor models, treatment with CD137 agonists specifically after anti-PD1 therapy improves anti-tumor responses.
Graphical Abstract
INTRODUCTION
Co-inhibitory receptors, such as PD1, Tim3, Lag-3, TIGIT, and CTLA-4 play a key role in driving a state of CD8+ T cell hyporesponsiveness called T cell exhaustion, that is frequently observed in chronic viral infections and cancer.1 Although, exhausted T (Tex) cells represent a unique T cell lineage, “T cell exhaustion” is a general term that includes various distinct epigenetic and metabolic states associated with effector T cell dysfunction.2–5 Several transcription factors (TFs) regulate Tex cell program including Eomes, TCF-1,6–10 and the high-mobility group (HMG) protein Tox.11–13 The latter is required for the epigenetic remodeling and survival of exhausted CD8+ T cells.11,12,14,15 Prolonged T cell receptor (TCR) signaling due to persistent antigen exposure seems to represent a cardinal cause of exhaustion in chronic infection and cancer.16 However, additional signals may also participate in exhaustion program since the mechanisms impacting Tex cell differentiation are still poorly understood.9,17–19
Targeting T cell exhaustion is a promising therapeutic strategy against cancer as illustrated by the clinical success achieved with monoclonal antibodies (mAbs) blocking PD1 and CTLA-4.20,21 Still, these immune checkpoint blockers (ICBs) may only reinvigorate a subset of Tex cells with a progenitor or stem-like signature and the clinical responses are observed only in a fraction of cancer patients.22,23 Therefore, finding alternatives to increase ICB efficacy is being actively pursued. Most current strategies target additional inhibitory receptors, but activating receptors may also impact the efficacy of cancer immunotherapy as recently evidenced for CD226 (DNAM-1).24–26
CD137 (TNFRSF9, 4–1BB) is a costimulatory member of the tumor necrosis factor receptor (TNFR) superfamily, expressed by activated T cells and other cells.27 The engagement of CD137 with its natural ligand CD137L (4–1BBL, TNFSF9) on activated dendritic cells (DCs) enhances T cell proliferation and cytokine secretion and protects T cells from activation-induced cell death.28–30 CD137 stimulation expands CD8+ effector memory T (Tem) cells and promotes tumor regression in diverse mouse models.31–33 CD137 hence represents a promising immunotherapeutic target against cancer. Yet, anti-CD137 mAbs such as urelumab had limited efficacy and showed liver toxicity in early-phase clinical trials.34,35 In addition, the mechanisms underlying the anti-tumor vs. the immune regulatory activity of anti-CD137 agonists are largely unexplained. Indeed, anti-CD137 agonists decrease clinical symptoms in several mouse models of autoimmunity, suggesting that the CD137 stimulation may dampen immune responses.36–39 Thus, there is a clear need to better understand the cellular programs driven by CD137 receptor stimulation.
In this study, using T cell-specific CD137-deficient mice and different tumor models, we found that CD137 absence limited the accumulation of tumor-infiltrating Tex cells. Through single-cell transcriptomic, epigenomic, and functional analysis, we demonstrated that NF-κB-dependent CD137 signaling induces the TCR-independent expansion of CD8+ T cells already committed into Tex cell program. Our results uncovering the role of CD137 signaling in T cell exhaustion may have broad therapeutic implication in chronic infectious disease and cancer as shown by the ability of CD137 agonists to improve anti-PD1 efficacy in our pre-clinical mouse models.
RESULTS
CD137 deficiency limits tumor-infiltrating Tex cells
To address the role of CD137 in CD8+ T cell anti-tumor surveil-lance, we crossed Cd137fl/fl mice with Cd4cre mice, specifically deleting CD137 expression in the T cell compartment. Cd4CreCd137fl/fl and Cd137fl/fl, referred to as Cd137−/− and Cd137+/+ mice, respectively, were injected s.c. with MC38 colon carcinoma cells or B16K1 melanoma cells (Figure 1A), two CD8+ T cell-dependent immunogenic tumor models.24–26 CD137 deficiency resulted in higher tumor burden at later time points in both B16K1 and MC38 mouse models suggesting that the absence of CD137 negatively impacts T cell anti-tumor immune response (Figure 1A). Indeed, CD137 deficiency decreased the frequency and number of CD8+ tumor-infiltrating T lymphocytes (TILs) in these tumor models (Figures 1B and S1A). B16K1 or MC38-CD8+ TIL phenotypic differences were also observed with a reduction in PD1- and Tim3-expressing CD8+ TILs in Cd137−/− mice compared with Cd137+/+ counterparts (Figures 1C and S1A). Nonetheless, splenic CD8+ T cell numbers and phenotypes were similar between tumor-bearing Cd137−/− and Cd137+/+-mice, and CD137 deficiency did not alter T cell homeostasis in naive mice (Figure S1B).
Figure 1. CD137 deficiency limits tumor-infiltrating Tex cells.

(A–C) Cd4cre Cd137fl/fl (Cd137−/−) and Cd137fl/fl (Cd137+/+) were injected s.c. with MC38 or B16K1 cells. (A) Tumor area. (B) Frequency and number of CD8+ T cells. (C) Expression of the indicated markers by CD8+ T cells.
(D–J) Cd4creCd137fl/flROSA26tomato and Cd137fl/flROSA26tomato mixed BM chimeras were injected s.c. with B16K1 cells. Cd137−/− (tomato+) and Cd137+/+ (tomato−) spleen and tumor-infiltrating CD8+ T cells were analyzed by single-cell RNA sequencing (scRNA-seq) after 21 days. (n = 7 pooled mice/group.) (D) Ratio of CD137+/+ vs. CD137−/−(CD137WT/KO) spleen and tumor-infiltrating CD8+ T cells. (E) Spleen and tumor-infiltrating CD8+ T cells transcriptomic landscape scattered in 6 clusters. (F and G) Relative expression of the indicated genes (F) and signatures (G).
(H and I) UMAP (H) and graphs (I) showing cluster frequency in the indicated samples.
(J) Fold change in expression and adjusted p value of relevant pathways enriched in Cd137+/+ vs. Cd137−/− tumor-infiltrating CD8+ T cells.
(K) Expression of CD137 by the indicated spleen or B16K1-tumor-infiltrating CD8+ T cell subsets after 19 days.
(L) CD137WT/KO ratio in the indicated CD8+ T cell subsets from B16K1 bearing mixed BM chimeras as in (D). Data are presented as mean ± SEM from at least 2 independent experiments. Each symbol represents an individual mouse. *p < 0.05; **p < 0.01, ***p < 0.001 (Mann-Whitney test or ANOVA with Tukey’s post-test analysis).
To exclude any impact of CD137 deletion on other T cell subsets, we generated mixed hematopoietic bone marrow (BM) chimeras. Lethally irradiated C57BL/6 mice reconstituted with Cd4creCd137fl/flROSA26tomato (Cd137−/−; tomato+) and Cd137fl/fl ROSA26tomato (Cd137+/+; tomato−) donor BM cells were injected with B16K1 cells (Figure 1D). We observed an increase in the ratio of Cd137+/+ vs. Cd137−/− (CD137WT/KO) CD8+ T cell in the tumor microenvironment as compared with the spleen (Figure 1D), resulting in higher numbers of Cd137+/+ than Cd137−/− CD8+ T cells within tumor lesions (Figures S1C and S1D). The frequency and number of Cd137−/− CD8+ TILs expressing PD1 and Tim3 were also reduced compared with Cd137+/+ counterparts (Figures S1C and S1D). These results were confirmed using Cd137+/+ and Cd137−/− CD8+ T cells transferred into lymphopenic Rag2−/−Il2rg−/− mice injected with B16K1 cells suggesting a CD8+ T cell-intrinsic impact of CD137 on T cell exhaustion (Figures S1E and S1F). To confirm these results at the molecular level, we performed a single-cell RNA sequencing (scRNA-seq) analysis of spleen and tumor CD8+ T cells isolated from Cd137−/− and Cd137+/+ mixed chimeras bearing B16K1 tumor (Figure 1E). The transcriptomic landscape of splenic CD8+ T cells was similar between Cd137+/+ and Cd137−/− and was mostly composed of cell clusters expressing naive and memory T (Tmem) cell signature genes (Ccr7, Sell, and Tcf7) (Figures 1F–1I and S1G). By contrast, the difference between Cd137+/+ and Cd137−/− transcriptomic profiles was more profound in CD8+ TILs (Figures 1H, 1I, and S1H). The Tex cell cluster that was enriched in expanded clonotypes (Figures S1I and S1J) and expressed Tnfrsf9, Pdcd1, Tigit, Tox, and Tex cell signatures (Figures 1F and 1G) was the most abundant in Cd137+/+ TILs. This cluster was decreased among Cd137−/− TILs that were enriched in clusters expressing central memory T (Tcm) cells and activated T cell signature genes (Figures 1F–1I, S1G, and S1H). GSEA, performed on Cd137+/+ and Cd137−/− CD8+ TIL differentially expressed genes, confirmed that Cd137+/+ TILs were enriched in chronic lymphocytic choriomeningitis virus (LCMV) infection and cancer exhaustion signatures,11,13,19,22,40,41 while Cd137−/− TILs were enriched in cancer-associated Tmem cell signatures42–46 (Figure 1J). Together, these results confirm that the absence of CD137 affects the presence of Tex cells within tumor lesions.
CD137 expression was restricted to tumor-infiltrating PD1+ Tem (CD62L−CD44hi) cells upon tumor development (Figure 1K). A more detailed analysis revealed that terminal Tex cells (TermTex; PD1+TCF1−Tim3+) displayed a higher CD137 expression than progenitor Tex cells (Tpex; PD1+ TCF1+Tim3−) (Figure 1K). Accordingly, TermTex cells were the more affected subset by the absence of CD137 while Tpex CD137WT/KO ratios were only mildly increased compared with PD1− counterparts (Figure 1L). In contrast, the ratios of CD137WT/KO naive T cells (Tn, CD62L+CD44low) and Tcm cells (CD62L+CD44high) were similar in mixed chimeras among the spleen, draining lymph node (DLN), and tumor, consistent with their very-low CD137 expression (Figures 1K and 1L). Analysis of public datasets of CD8+ TIL scRNA-seq from human melanoma47 and breast cancer48 confirmed the higher expression of TNFRSF9 on Tex cell clusters (Figures S1K and S1N). TNFRSF9 expression strongly correlated with terminally Tex cell genes HAVCR2, TIGIT, and TOX (Figure S1L). Reciprocally, in silico-gated TNFRSF9-expressing TILs had a higher Tex cell signature49 than TNFRSF9 negative TILs (Figures S1M and S1O). Together, these data showed the specific expression of CD137 on tumor-infiltrating CD8+ Tex cells. Furthermore, the reduction of this subset in the absence of CD137 receptor suggests a role for this receptor in Tex cell accumulation within tumors.
CD137 stimulation favors tumor Tex cell accumulation
To address whether CD137 signaling favors Tex cell accumulation in the tumor, we analyzed the impact of CD137 stimulation on tumor associated CD8+ T cells using a well-described anti-CD137 agonist mAb (clone 3H3).30 WT mice bearing detectable B16K1 tumors were injected with control Ig or anti-CD137 mAbs, and the TIL composition was analyzed (Figure 2A). Anti-CD137 treatment increased the frequency and number of CD8+ T cells expressing PD1 and Tim3 markers compared with Ig-treated controls, while PD1− Tmem TIL numbers remained stable (Figures 2B and 2C). This increase in Tex cells induced by anti-CD137 treatment was negligible in Cd137−/− mice (Figures 2B and 2C). To address the impact of CD137 agonists on tumor antigen-specific TILs, CD8+ T cells from OT-1 mice, which express a transgenic TCR recognizing a peptide from ovalbumin (ova) in the context of major histocompatibility complex (MHC) class I, were transferred into B16-ova-bearing Cd45.1 mice and treated with Ig or anti-CD137 (Figure 2D). Anti-CD137 increased the frequency and the number of exhausted PD1+Tim3+ OT-1 cells infiltrating B16-ova tumors as compared with Ig treatment (Figure 2D). Thus, CD137 agonism enhances the exhaustion program in exhaustion prone immunogenic solid tumor models.
Figure 2. CD137 stimulation favors tumor Tex cell accumulation.

(A–C) Cd4creCd137fl/fl (Cd137−/−) and Cd137fl/fl(Cd137+/+) were injected s.c. with B16K1 cells and treated with anti-CD137 (3H3, 10 μg) or Ig control mAbs. (A) Experimental design. (B and C) FACS plots (B) and graphs (C) showing the frequency and numbers of PD1+Tim3+ CD8+TILs after 21 days.
(D) Cd45.1 mice reconstituted with 107 OT-1 cells were injected B16-ova tumors and treated with anti-CD137 or Ig mAbs. Experimental design and graphs showing the intratumor Tpex and TermTex OT-1 CD8+ T cells frequency.
(E–J) WT mice were challenged with Vk12653 myeloma cells and after 10 days, mice were injected with anti-CD137 or Ig mAbs. Bone marrow CD8+ T cells were analyzed by scRNA-seq (n = 5 pooled mice/group). (E) Experimental design. (F) UMAP split by Ig or anti-CD137 treatment. (G) Relative expression of the indicated Tex-specific signature.41,50,51 (H) Identification of four clusters on UMAP plots. (I) Frequency of the indicated clusters along Ig or anti-CD137 treatment.
(J) Log-normalized gene-expression heatmap showing the expression of naive, Tpex, effector-like, and TermTex cell signature genes by the indicated clusters defined as in (H). Data are scaled rowwise (violet low – yellow high).
(K–M) Comparison of anti-CD137 scRNA-seq as in (E) with Giles et al.52 dataset of CD8+ T cells from LCMV Arm and cl13. (K) UMAP plot colored by experimental conditions. (L) Relative expression of Tnfrsf9. (M) Left, UMAP plot colored by transcriptional clusters of interest. Center and right, projection of the indicated anti-CD137-treated CD8+ T cells over UMAP coordinates. Data are presented as mean ± SEM from at least 2 independent experiments. Each symbol represents an individual mouse. *p < 0.05; **p < 0.01, ***p < 0.001 (Student’s t test or ANOVA with Tukey’s post-test analysis).
In the VK12653 mouse model of myeloma, which develops in the BM and does not induce strong T cell exhaustion,33,53 anti-CD137 treatment induced the expansion of CD8+ T cells co-expressing the inhibitory receptors PD1, Tim3, TIGIT, and Lag-3 and the TFs Tox and Eomes (Figures S2A and S2B). A kinetic scRNA-seq analysis of CD8+ T cells infiltrating VK12653 lesions treated with anti-CD137 or control Ig confirmed these findings (Figures 2E–2J and S2C). Indeed, most TILs from Ig controls and early-stage anti-CD137 treatment (day 1 and day 4) were located in cluster C1 and expressed Tn genes (Ccr7, Il7r, and Sell) (Figures 2H–2J, S2D, and S2E). In contrast, TILs from day 11 and day 18 anti-CD137 condition were located in clusters C2–C4 and were characterized by the expression of tumor and LCMV Tex cell signatures40,41,50,51 and genes (Figures 2G–2J, S2D, and S2E). Cluster 2 had features of Tpex cells (Tcf7, Cxcr5, and Slamf6) while cluster 3 had proliferating and effector-like Tex cell features (Top2a, Hmgb2, H2afz, Tbx21, Cxcr3, and Klrg1) (Figure 2J). Both clusters peaked by 11 days of anti-CD137 (Figure 2I). Cluster 4 was enriched in TermTex genes (Lag3, Havcr2, Pdcd1, and Tox) and represented most of the TILs after 18 days of anti-CD137 (Figures 2I and 2J). Comparison of our scRNA-seq data that from chronic (Cl13) or acute (Arm) LCMV and tumor-specific CD8+ T cell datasets10,41,52 confirmed that day 11 and day 18 anti-CD137 TILs shared important similarities with chronic infection and tumor Tex program (Figures 2K–2M, S2F, and S2G). Tnfrsf9 expression was only visible on chronic LCMV and tumor Tex cell clusters but not acute LCMV effectors (Figure 2L). Together, these data demonstrate that anti-CD137 agonists induce the accumulation of CD8+ T cells characterized by a Tex cell transcriptomic program.
CD137 promotes Tex cell expansion and differentiation
We found that anti-CD137 mAbs induced Tex cell accumulation not only in the tumor but also in all the lymphoid organs tested even in the absence of tumors (Figures S3A–S3C). These PD1- and Tim3-expressing CD8+ Tem cells that accumulated in naive mice upon CD137 stimulation had decreased ability to proliferate and produce IL-2, IFN-γ, and TNF compared with PD1− and Tim3− counterparts confirming their functional exhaustion (Figures S3D and S3E). Similar results were obtained with a different CD137 agonist (clone LOB12.3, Rat IgG1) with a lower affinity, a different isotype and whose mechanism of action requires FcγR cross linking54 (Figure S3F). Increased expression of PD1 and Tim3 by CD8+ Tem cells in non-tumor-bearing mice was also evident with low doses of CD137 agonists (Figure S3G). These results indicate that CD137 stimulation leads to a systemic Tex-cell-promoting effect, independent of tumor or chronic infection. We therefore questioned the mechanisms involved.
CD137 has been implicated in T cell survival,55,56 but we did not observe differences in the expression of active caspase 3/7 among Cd137+/+ and Cd137−/− CD8+ TILs (Figure S3H). In addition, anti-CD137 treatment did not affect the level of CD8+ T cells apoptosis suggesting that decreased apoptosis may not explain the Tex-cell-promoting effect of CD137 (Figure S3I). CD137 has also been suggested to represent a growth factor for Tmem cells.32 Accordingly, anti-CD137 treatment quickly increased Ki67 expression in PD1− CD44hi CD8+ Tmem cells in WT mice (Figures 3A and 3B). Ki67 expression was primarily restricted to PD1+CD44+ memory CD8+ T cells upon CD137 stimulation (Figures 3A and 3B). The proliferation of both Tpex-like (PD1+TCF1+Tim3−) and TermTex-like (PD1+TCF1−Tim3+) phenotype cells was increased upon CD137 stimulation compared with naive and PD1− Tmem cells (Figures 3C and 3D). This suggests that CD137 specifically triggers the expansion CD8+ T cells with a Tex cell phenotype even in naive mice. Indeed, accumulating evidence supports the progressive expansion in “specific-pathogen-free” (SPF) mice, with age, of CD8+ T cells with Tex-like features including PD1+ and Tim3+ expression and functional defects, probably reactive to commensal/endemic pathogens or self-antigens.57–59 To address this question, we sorted naive (Tn, CD44− CD62L+), memory (Tmem, PD1− CD44hi), and PD1+ (Tex-like CD44hi PD1+) cells from Cd45.1 mice and transferred them into Cd137−/− mice whose T cells do not respond to CD137 agonists (Figure 3E). The percentages of CD45.1 Tn and Tmem cells recovered after 2 weeks were very low for both conditions, while CD45.1 PD1+ Tex-like cells were increased by anti-CD137 treatment (Figure 3F). To confirm the differential impact of CD137 stimulation on CD8+ T cell subsets, we performed a scRNA-seq analysis of PD1− (Tmem), PD1+SLAMF6+Tim3− (Tpex-like), and PD1+SLAMF6−Tim3+ (Tex-like) splenic CD44hiCD8+ T cells isolated from WT mice treated with anti-CD137 mAbs or rare cells expressing the same markers in the Ig-treated controls (Figures 3G and S3J). The composition of PD1− Tmem cells was almost similar between Ig and CD137 conditions, once again suggesting the lack of impact of CD137 engagement on these PD1− Tmem cell subsets (Figures 3H and 3I). They were composed mainly of clusters C0 and C2 with naive and central Tmem cell signature genes and had almost undetectable Tnfrsf9 expression (Figures 3H, 3I, and S3K). Tpex-like cells from Ig and CD137 treated mice were also quite similar except a small cluster of Tnfrsf9-expressing cells (C5), characterized by proliferating and progenitor-exhausted signatures that expanded in CD137-treated mice (Figures 3H–3J and S3K). The main differences between Ig and anti-CD137 conditions were observed for the Tex-like cell subsets (Figures 3H and 3I). Most of the Ig Tex-like cells belonged to cluster 3, with a mixed signature of pre-exhausted, effector-like, and proliferating Tex cells while, in the anti-CD137 condition, these cells belonged to cluster 4, mainly characterized by chronic LCMV and tumor TermTex signature genes (Figures 3H, 3I, and S3K). The canonical signatures and genes related to Tex cell terminal differentiation (e.g., Pdcd1, Havcr2, Nr4a2a, and Lag3) that were already expressed by Tex-like cells in the Ig condition were further increased upon anti-CD137 treatment (Figures 3K, 3L, and S3L). Projection of our scRNA-seq with Giles et al.52 confirmed these findings (Figures S3N and S3M). We further validated the differential effect of CD137 engagement on PD1− Tmem, Tpex, and Tex cells by transferring these subsets into Rag2−/−Il2rg−/− mice that were subsequently treated with anti-CD137 mAbs (Figure 3M). Tpex and Tex cell numbers were higher upon anti-CD137 treatment compared with Ig controls while PD1− Tmem cell numbers did not differ (Figure 3N). In addition, PD1− Tmem cells did not acquire a Tpex or TermTex phenotype upon anti-CD137 treatment while most of the Tpex-like cells acquired a TermTex phenotype characterized by PD1 and Tim3 expression (Figures 3O and 3P). Together these results indicate that CD137 stimulation induces the expansion of memory CD8+ T cells that are already committed into a Tex cell program and favors their differentiation into terminally differentiated Tex cells.
Figure 3. CD137 promotes Tex cell expansion and differentiation.

(A–D) Naive WT mice were treated with anti-CD137 (3H3, 10 μg) or IgG control mAbs. (A) Experimental design. (B–D) FACS plot and graphs showing Ki-67 expression by the indicated CD8+ T cell subsets along treatment.
(E and F) The indicated CD45.1 CD8+ T cell subsets were injected i.v. into Cd137−/− mice that were treated with anti-CD137 or IgG. (E) Experimental design. (F) FACS plot and graphs showing the frequency of CD45.1+ CD8+ T cells after 14 days.
(G–K) WT mice were injected with anti-CD137 or IgG. The indicated splenic CD8+ T cell subsets were analyzed by scRNA-seq (n = 5–10 pooled mice/group). (G) Experimental design. (H and I) UMAP (H) and bar plots (I) showing CD8+ T cell cluster distribution. (J) Relative expression of Tnfrsf9. (K) Clustered heatmap showing the indicated signature expression (1: Miller et al.41; 2: Siddiqui et al.50; 3: Utzschneider et al.51; 4: Giles et al.52). Data are scaled rowwise.
(L) Clustered heatmap showing the 280 differentially expressed genes between Tex-like cells treated with anti-CD137 or Ig (log2FC > 0.25).
(M–P) The indicated CD8+ T cell subsets isolated from WT mice treated with anti-CD137 were injected i.v. into Rag2−/−Il2rg−/− mice treated with anti-CD137 or IgG. (M) Experimental design. (N) FACS plots and numbers of CD8+ T cells recovered after 7 days. (O) FACS plots and graphs showing PD1 and Tim3 expression and numbers. (P) Frequency of CD8+ T cells with a Tmem (CD44hiPD1−), Tpex (PD1+TCF1+Tim3−), or TermTex (PD1+TCF1−Tim3+) cell phenotype. Data are presented as mean ± SEM from at least 2 independent experiments. Each symbol represents an individual mouse. *p < 0.05; **p < 0.01, ***p < 0.001 (paired t test or ANOVA with Tukey’s post-test analysis).
CD137-induced Tex cell expansion does not require TCR/calcineurin signaling pathway
Our results showing that CD137 engagement promotes the proliferation and the differentiation of Tex cells, even in naive mice, raised the question of the role of TCR signaling in this effect. To date, TCR-induced calcineurin-NFAT signaling is the main—if not the only—identified driver of T cell exhaustion.11,60 Yet, anti-CD137 agonism induced the expansion of Tex cells upon transfer of OT-1 cells into WT mice in the absence of ova antigen (Figures S4A and S4B) and in the absence of MHC-I/TCR inter-actions upon transfer of CD8+ T cells into B2m−/− mice (Figures 4A and 4B). In addition, calcineurin inhibitors FK506 or cyclosporin did not decrease CD8+ T cell expression of Tox, Tim3, and PD1 induced by anti-CD137 agonists (Figure 4C), whereas they decreased the percentage of memory CD8+ T cells from Ig control mice (Figure S4C). The use of fluorescent reporter Nur77GFP transgenic mice61 in which T cells specifically express GFP in response to TCR stimulation confirmed that CD137-induced Tex cell expansion does not involve TCR stimulation. CD8+ T cells from Nur77GFP mice did not express GFP in the different organs tested upon anti-CD137 treatment, in sharp contrast with anti-CD3+CD28 stimulation (Figures 4D, S4D, and S4E). Finally, we analyzed the single-cell TCR repertoire of sorted CD8+ Tmem, Tpex-like, and Tex-like treated with anti-CD137 or Ig control mAbs (see Figure 3G). We first calculated a clonal expansion score based on Shannon’s entropy62,63 and compared it across transcriptional clusters and treatments. In both Ig and anti-CD137-treated animals, the highest TCR clonal expansion was found in the Tex-like cell subsets, specifically in clusters 3 and 4, respectively (Figure 4E). Yet, we observed a lower clonal expansion in the anti-CD137 condition, evidenced by the lower frequency of T cells belonging to large clones representing more than 1% of the total repertoire (Figures 4E and 4F). We next quantified the repertoire overlap between transcriptional clusters. In Ig control mice, Tpex-like cluster 1 and Tex-like clusters 3 and 4 were interconnected as shown by their high Morisita index62 (Figures 4G and 4H). Repertoire overlap between Tex clusters 3 and 4 was also evident upon anti-CD137-treatment, but these clusters were poorly connected with cluster 1 (Figures 4G and 4H). The lower clonal expansion and overlap of Tpex and Tex cells from CD137-stimulated mice are consistent with the TCR-independent Tex pathway induced by this receptor. To confirm these results, we wanted to compare common clonotypes found in Ig control and CD137 treated mice. If CD137 stimulation drives the expansion of existing Tex cells, we reasoned that the Tex cell TCR repertoire of anti-CD137-treated mice would include at least the TCR species found upon Ig treatment and potential additional clonotypes that were below detection in the Ig group. Because the mouse TCR repertoire is largely private, we did not quantify identical clonotypes, but rather TCR sequence-based groups using two different sequence-based methods (Levenshtein distance [LD] and Kidera factor [KF]).62 To avoid biases due to TCR groups containing few highly expanded TCRs, we only retained TCR groups of at least 100 cells and at least 10 clonotypes, which for the LD method only retained TCR alpha chain groups (Figure S4F). With both methods we observed that, while TCR groups derived from Tmem cells were equally likely to include cells from either condition, the Tpex and Tex subsets contained more TCR groups highly skewed for anti-CD137 treatment (Figures S4G and S4H). Collectively, these data indicate that, starting from the Tpex stage, CD137 agonism pushes toward exhaustion a similar repertoire to the one naturally found in naive mice, but also a broader number of TCR species, resulting in an overall more polyclonal repertoire.
Figure 4. CD137-induced Tex cell expansion does not require TCR/calcineurin signaling pathway.

(A and B) WT CD8+ T cells were transferred into B2m−/− mice subsequently treated with anti-CD137 (10 μg; 3H3, i.p. twice a week) or Ig mAbs. (A) Experimental design. (B) Frequency of splenic PD1+Tim3+ CD8+ Tem cells.
(C) WT mice were treated with cyclosporin A or FK506 in combination with anti-CD137 or Ig. Frequency of Tim3+PD1+ or Tox+ CD8+Tem cells.
(D) Nur77GFP mice were treated with anti-CD137 or IgG for the indicated period. Expression of GFP by CD8+ Tem cells after 1, 7, and 14 days of treatment or upon 24 h of anti-CD3+CD28 in vitro.
(E) Shannon entropy-based expansion score of clusters from Figure 3H. Color of the dots indicates the intensity of the score and size the number of cells.
(F) Frequency of CD8+ T cells according to their expansion between subsets and treatments. Each dot represents a resampling of the original dataset equivalent to 90% of the smallest treatment-subset sample.
(G and H) Clonal overlap between the main Tpex and Tex clusters. Circos plots (G) and Morisita index (H). Data are presented as mean ± SEM from at least 2 independent experiments. Each symbol represents an individual mouse. *p < 0.05; **p < 0.01, ***p < 0.001 (Mann-Whitney or ANOVA with Tukey’s post-test analysis).
T cell-intrinsic CD137-induced canonical NF-κB signaling drives T cell exhaustion
To confirm that direct CD137 signaling accounts for the exhaustion program observed upon anti-CD137 treatment, we used Cd137−/−(tomato+) and Cd137+/+(tomato−) mixed BM chimeras (Figure 5A). Anti-CD137 mAbs induced the expansion of Cd137+/+ CD8+ Tem cells with an exhausted phenotype while Cd137−/− counterparts did not expand nor express exhaustion markers (Figures 5B–5D). Similar results were obtained when we transferred Cd137−/− CD8+ T cells (CD45.2+) into Cd45.1 mice (Figures S5A–S5C) or when Cd137+/+(tomato−) and Cd137−/−(tomato+) CD8+ T cells were transferred into Rag2−/−Il2rg−/− mice (Figures S5D–S5F). In the latter model, we confirmed that anti-CD137 promoted the functional exhaustion of Cd137+/+ CD8+ T cell while Cd137−/− CD8+ T cells were not affected (Figure S5G). Anti-CD137 treatment also increased the percentage of CD8+ Tex cells in the absence of other potential exhaustion-inducing inflammatory mediators19,64 as observed in Ccl5−/−, Il1r−/−, Il6−/−, IL10−/−, Il12p40−/−, Il18−/−, Il27ra−/−, Ifnar−/−, Ifngr−/−, and Tnf−/− mice (Figure S5H). Taken together, these results exclude the role of inflammatory mediators and demonstrate the intrinsic role of CD137 signaling in promoting CD8+ Tex cell expansion.
Figure 5. T cell-intrinsic CD137-induced canonical NF-κB signaling drives T cell exhaustion.

(A–D) Cd4creCd137fl/flROSA26tomato (tomato+) and Cd137fl/flROSA26tomato (tomato−) mixed BM chimeras were treated with anti-CD137 (10 μg; 3H3, i.p. twice a week) or IgG control mAbs. (A) Experimental design. (B) Ratio of tomato− and tomato+ among splenic CD8+ T cells. (C) Frequency and absolute number of CD8+ T cells. (D) Frequency of CD8+ T cells expressing the indicated markers.
(E) Frequency of splenic PD1+Tim3+ CD8+ Tem cells in Traf1−/− and WT mice treated with anti-CD137 or IgG control for 18 days.
(F and G) Frequency of splenic PD1+Tim3+ CD8+ Tem cells in Cd4cre+/− control mice and Cd4cre+/− crossed with Relafl/fl, Relfl/fl, Relbfl/fl, or Nfkb2fl/fl mice treated with anti-CD137 or IgG for 18 days.
(H–J) scRNA-seq as in Figure 2F.
(H) Relative expression of NF-κB target gene signature.
(I) In silico gating of PD1−Tim3− double-negative (DN), PD1+ simple-positive (SP), and PD1+Tim3+ double-positive (DP) cells and their numbers in the different Ig or anti-CD137 conditions.
(J) Relative expression of the NF-κB target gene signature.
(K) UMAP and violin plot comparing NF-κB target gene signature in CD8+ T cell subsets as in Figure 3H.
(L) Violin plot comparing NF-κB target gene signatures in Cd137−/− and Cd137+/+ CD8+ T cell subsets as in Figure 1E. Data are presented as mean ± SEM from at least 2 independent experiments. Each symbol represents an individual mouse. *p < 0.05; **p < 0.01, ***p < 0.001 (Mann-Whitney, paired t test or ANOVA with Tukey’s post-test analysis).
CD137 signaling relies on TNFR-associated-factor (TRAF) adapter proteins and more specifically TRAF1, TRAF2, and TRAF3.65 CD8+ Tex cells expanded similarly in WT and Traf1−/− mice upon treatment with anti-CD137 agonists (Figure 5E), thus suggesting a TRAF1-independent mechanism for CD137-induced T cell exhaustion. TRAF2 stimulates the canonical pathway involving NF-κB heterodimers containing primarily p65 or cRel (encoded by Rela and Rel respectively) bound to p50, whereas TRAF3 promotes the non-canonical NF-κB pathway consisting of RelB and p52 dimers (encoded by Relb and Nfkb2 respectively).65 Therefore to refine the CD137 signaling pathway promoting CD8+ T cell exhaustion, we explored the specific roles of the canonical and non-canonical NF-κB subunits using Cd4cre crossed with Relafl/fl, Relfl/fl, Relbfl/fl, or Nfkb2fl/fl mice.66–68 All of these different strains of mice underwent similar increase in CD44hiCD62L− CD8+ Tem cell upon anti-CD137 treatment (Figures 5F and 5G). In contrast, we observed a lower frequency of PD1+Tim3+ Tex cells in Cd4creRelafl/fl and Cd4creRelfl/fl compared with Cd4creRelbfl/fl, Cd4creNfkb2fl/fl, and Cd4cre control mice treated with anti-CD137 mAbs (Figures 5F, 5G, and S5J). While the levels of Tim3, PD1, and Eomes were reduced on CD8+ Tem cells from both Cd4creRelafl/fl and Cd4creRelfl/fl, only cRel deficiency significantly affected Tox expression (Figure S5I). The importance of canonical NF-κB signaling in the Tex-inducing effects of CD137 was confirmed in our scRNA-seq datasets. In both tumor and non-tumor contexts, the NF-κB signature was increased in the CD137 expanded Tex subsets (Figures 5H–5K). Conversely, we found that NF-κB signature was decreased in Cd137−/− CD8+ TILs compared with WT counterparts in mixed BM chimera bearing B16K1 tumors (Figure 5L). Taken together, these results confirm the importance of the canonical NF-κB pathway and more particularly the RelA and cRel subunits in the CD8+ exhaustion program promoted by CD137 stimulation. Agonist antibodies directed against other TNFR receptors including GITR and OX40, that share signaling with CD137, did not promote the accumulation of CD8+ Tem cells with an exhausted phenotype when injected into WT mice suggesting that the NF-κB-dependent stimulation of T cell is a specific feature of CD137 engagement by agonist antibodies (Figure S5J).
Anti-CD137 drives early epigenetic remodeling of Tex-cell-associated genes
The progressive epigenetic remodeling of CD8+ Tex-cell-associated genes such as inhibitory receptors is critical to enforce Tex cell program. To better understand the mechanism of the CD137-induced exhaustion program, we analyzed the splenic CD44hi CD8+ T cell chromatin states along anti-CD137 treatment through assay for transposase-accessible chromatin using sequencing (ATAC-seq). Analysis of day 5 and day 18 anti-CD137 vs. Ig differentially accessible peaks revealed that CD137 agonism induces early chromatin remodeling that is strengthened in the course of treatment (Figures 6A, S6A, and S6B). Among the 10,101 open peaks after 18 days of CD137 stimulation, 3,602 were already opened at day 5 (log2FC > 2 adjusted [adj] p < 0.01) (Figures 6B and 6C). These were enriched in LCMV and tumor exhaustion signature genes, indicating that CD137 engagement rapidly promoted CD8+ T cell exhaustion program at the chromatin level (Figures 6D and 6E). Increased ATAC signals were clearly visible in the promoter and regulatory regions of exhausted signature genes such as Pdcd1, Havcr2, Lag3, Gzmk, Nr4a2, and Tox after anti-CD137 treatment (Figures 6F, S6C, and S6D). These included two Tex cells’ selectively accessible open chromatin region located at −22 kb 5′ of the Pdcd1 TSS and ~3 kb 3′ of the Lag3 gene.4,69,70 We next performed TF inference for differentially accessible peaks between Ig and CD137 condition using chromVAR package71 that confirmed the importance of NF-κB canonical pathway in the epigenetic changes induced by anti-CD137 treatment. Indeed, CD137 differentially accessible peaks were enriched in NF-κB pathway especially at D5 and promoters differentially opened by CD137 were enriched NF-κB canonical pathway (Figures 6G, S6E, and S6F). Together these data confirm that NF-κB-dependent CD137 signaling directly regulates the T cell exhaustion program at the epigenetic level.
Figure 6. Anti-CD137 drives early epigenetic remodeling of Tex-cell-associated genes.

(A–D) WT mice were treated with anti-CD137 (3H3, 10 μg) or IgG control mAb for 5 or 18 days and splenic CD44hi CD8+ T cell chromatin states was determined through ATAC-seq. Data from 4 mice for each condition. (A) PCA of ATAC signal on peaks detected in all conditions. (B) Venn diagram showing up and down differentially accessible regions (DARs) from the indicated pairwise comparisons. (log2FC > 2 and adj p < 0.01.) (C) ATAC signals around up and down DARs (−1.5 kb +1.5 kb) for each sample. (D) GSEA between the indicated signatures and the day 18 anti-CD137 condition.
(E) Heatmap showing log-normalized ATAC-seq signal in the peaks overlapping the indicated Tex cell subset’s genes as in Figure 2J.
(F) ATAC signals across the Pdcd1, Lag3, and Havcr2 loci. Previously described Tex-specific peaks are highlighted in gray.
(G) Graph showing the transcription factor (TF) that account for the variability in chromatin accessibility between anti-CD137 and Ig conditions identified using chromVar package.
(H) Heatmap showing for each TF the deviation score in each sample calculated with chromVar. Only TF with a variability >10 and an adj p < 0.01 were selected.
(I) Cd4cre Cd137fl/fl (Cd137−/−) and Cd45.1 (Cd137+/+) mixed BM chimera were injected s.c. with B16K1 melanoma cells. Expression of Tox on tumor-infiltrating CD8+ memory T cells.
(J and K) CD45.1 CRISPR-Cas9 control and CD45.2 CRISP-Cas9 Tox-deficient CD8+ T cells were injected i.v. into Rag2−/−Il2rg−/− mice. After 7 days, mice were treated with anti-CD137 (10 μg; 3H3, i.p. twice a week) or IgG. (J) Experimental design. (K) Expression of the indicated markers on splenic CD8+ T cells. Data are presented as mean ± SEM from at least 2 independent experiments. Each symbol represents an individual mouse. *p < 0.05; **p < 0.01, ***p < 0.001 (paired t test).
Tox has been shown to play a critical role in the chromatin remodeling of Tex-specific genes.11,12,14,15 Tox expression was decreased in Cd137−/− CD8+ TILs compared with WT counterparts in mixed BM chimeras bearing B16K1 tumors (Figure 6I). Conversely, CD137 agonists induced Tox expression by CD8+ T cell in a cRel-dependent manner (see Figure S5I), suggesting a link between CD137 signaling, Tox, and Tex cell program. To address this hypothesis, we generated CD45.1 CRISPR-Cas9 control and CD45.2 CRISPR-Cas9 Tox-deficient CD8+ T cells by nucleofection of sgRNA plus Cas9 protein RNPs, which were co-transferred into Rag2−/−Il2rg−/− mice (Figure 6J). CD45.1 control CD8+ T cells had increased expression of Tox, PD1, Tim3, and LAG3 upon treatment with anti-CD137 while CD45.2 Tox-deficient CD8+ T cells failed to up-regulate these markers (Figure 6K). Thus, our data point toward a role for Tox-induced epigenetic remodeling in CD137-induced T cell exhaustion.
Contrasting effect of anti-CD137 on immune surveillance and anti-PD1 efficacy
Finally, we wanted to determine whether Tex cell accumulation induced by systemic anti-CD137 treatment may affect anti-tumor immunosurveillance in vivo. To address this point, WT mice were pre-treated with anti-CD137 mAbs for 3 weeks, before being challenged with B16K1 (Figure 7A). Anti-CD137 pre-treatment increased tumor burden compared with Ig control (Figure 7B). These results were confirmed in the B16F10 and VK12653 models (Figures S7A–S7C). A short anti-CD137 conditioning of 4 days before B16K1 injection was sufficient to increase tumor growth compared with Ig control, confirming that anti-CD137-induced Tex cell expansion may limit anti-tumor efficacy (Figure 7A). Adoptive transfer of PD1+ Tex or PD1− Tmem cells from OT-1 mice treated with anti-CD137 mAbs into Rag2−/−Il2rg−/− mice injected with B16-ova confirmed that Tex cells expanded upon anti-CD137 treatment have lower anti-tumor functions than their Tmem counterparts (Figures 7C and 7D). Anti-PD1 treatment only partially reversed dysfunctions induced by anti-CD137 treatment (Figure S7D). Indeed, anti-PD1 treatment decreased tumor growth in anti-CD137 pre-treated mice although anti-PD1 efficacy was still reduced compared with anti-PD1 treatment alone (Figure S7D). Accumulating evidence supports that activation of Tpex cells in the DLN, rather than TermTex cell reinvigoration, is a key mechanism underlying anti-PD1 efficacy.23,50,72 Given the ability of CD137 stimulation to drive the expansion of CD8+ Tex cells, we reasoned that anti-CD137 agonists may have better efficacy when injected after anti-PD1 mAbs. To address this, WT mice with detectable B16K1 or B16-ova tumors were treated with either anti-PD1, anti-CD137, or a combination of both mAbs (Figure 7E). Anti-PD1 treatment on well-established tumors (day 9) limited tumor progression but was not sufficient to promote tumor regressions (Figures 7F and 7G). Again, anti-CD137 was poorly effective in reducing tumor growth when injected on well-established tumors consistent with previous report.73 In contrast, anti-CD137 treatment given after anti-PD1 decreased tumor burden and prolonged survival compared with anti-PD1 in both B16-ova model and B16K1 models (Figures 7F and 7G). Of note, anti-PD1 limited tumor progression in both Cd137−/− and Cd137+/+ mice (Figures S7E–S7G). While we have not ruled out that the accumulation of Tex cells triggered by the systemic CD137 agonist injection may favor tumor relapse and limit subsequent immunotherapeutic interventions, the combination of anti-PD1 followed by anti-CD137 provides a clear enhancement of tumor rejection in the models we have examined.
Figure 7. Contrasting effect of anti-CD137 on immune surveillance and anti-PD1 efficacy.

(A and B) C57BL/6 WT mice were treated with anti-CD137 (10 μg; 3H3, i.p. twice a week) or control IgG for the indicated period. Experimental design (A) and tumor volumes (B). (n = 5/group).
(C and D) Spleen Tmem and Tex cells were FACS sorted from OT-1 mice treated with anti-CD137 (100 μg; 3H3, i.p. twice a week) for 18 days and transferred into Rag2−/−Il2rg−/− mice subsequently injected with B16-ova tumor cells. (C) Experimental design. (D) Tumor area and survival of the indicated groups of mice. (n = 5 mice per group from one experiment.)
(E–G) C57BL/6 WT mice were injected with B16K1 (F) or B16-ova (G) and were treated from day 9 with IgG control, anti-CD137 (10 μg; 3H3, i.p. twice a week), anti-PD1 (250 μg i.p., RMP1–14) or both. (E) Experimental design. (F and G) Tumor area and survival of the indicated groups of mice. (n = 10–15/group). Unless otherwise specified, data are presented as mean ± SEM from at least 2 independent experiments. Each symbol represents an individual mouse. *p < 0.05; **p < 0.01, ***p < 0.001 (Mann-Whitney, Mantel-Cox log rank or ANOVA with Tukey’s post-test analysis).
DISCUSSION
CD137 is an intriguing receptor with potential therapeutic applications, as a target of agonist agents, in both cancer and autoimmune disease. Thus, there is a clear need to understand the functional ramifications of CD137 signaling. Here, through transcriptomic, epigenomic, and functional assays, we demonstrated the importance of T cell-specific CD137 signaling in CD8+ T cell exhaustion program. Using T cell-specific CD137-deficient mice, we found that CD137 absence limited tumor associated Tex cell in different mouse tumor models. CD137 was specifically expressed by CD8+ Tex cells and CD137 agonists promoted the TCR-independent, NF-κB-dependent proliferation and terminal differentiation of these cells. Finally, while Tex cell accumulation induced by prophylactic anti-CD137 treatment favored tumor escape, we found that PD1 efficacy is improved with subsequent CD137 stimulation.
We have provided extensive evidence that T cell-intrinsic CD137 signaling is an important component favoring Tex cell expansion and differentiation, thus raising questions about the role of TCR signaling in this mechanism. Chronic TCR stimulation represents the main, if not the only known, driver of CD8+ T cell exhaustion.8,13,74 Yet, experiments with Nur77GFP TCR reporter, TCR transgenic MHC-I-deficient mice, or calcineurin inhibitors all point toward a TCR/calcineurin-independent Tex-cell-promoting role of CD137. In contrast, our results revealed the importance of RelA and cRel subunits in the Tex-cell-inducing effects of CD137, suggesting that the activation of canonical NF-κB pathway may favor CD8+ Tex cell program. Our findings raise the question whether additional TNFR members that share signaling pathways with CD137 may also promote T cell exhaustion program. However, neither OX-40 nor GITR agonists induced exhaustion-associated markers in our experiments, even though both receptors promote TRAF2-dependent NF-κB signaling and survival like CD137.75 Future experiments are required to refine the CD137 signaling that stimulates Tex cell expansion.
Our results do not exclude the role of TCR signaling in T cell exhaustion. Indeed, we found that CD137 stimulation did not affect naive or PD1− memory CD8+ T cells and rather expanded and promoted the terminal differentiation of cells already committed to a Tex-like program. Indeed, flow cytometry and scRNA-seq analysis, in human and mouse tumoral and chronic infected tissues, all support the CD8+ T cell-specific expression of CD137 by Tex cells. Notably, the analysis of public datasets10,41,52 showed that Tnfrsf9 expression is restricted to Tex cell populations that arise upon chronic LCMV or tumors but not bona-fide effector memory CD8+ T cells found in acute LCMV infections. While chronic TCR signaling may account for CD137 expression by Tex cells, several TCR-independent mechanisms were identified, including IL-15 or IL-276 and GITR-induced expression.77 Hypoxia driven Hif1α also induces CD137 expression in the tumor context.78 TCR-independent expression of CD137 was suggested to contribute to the maintenance of a CD8 Tmem cell pool in the absence of their specific antigen.76 Our results suggest a similar mechanism whereby high CD137 expression on CD8+ Tex cells may contribute to their maintenance and expansion even in the absence of active TCR signaling.
Many laboratories, including ours, have found an anti-tumor function of anti-CD137 agonists against diverse tumor models.31,33,35 Yet, despite promising pre-clinical results, the clinical efficacy of anti-CD137 mAbs was limited in the different clinical trials that also revealed severe adverse events (SAEs) in the case of the human anti-CD137 mAb urelumab.34,35 The systemic expansion of Tex cells with limited effector functions induced by anti-CD137 mAbs may account for the so-far disappointing efficacy of CD137 agonists. Indeed, we found that the prophylactic treatment of mice with anti-CD137 mAbs subsequently increased the growth of different immunogenic tumor models and limited the efficacy of anti-PD1 immunotherapy. In line with these results, anti-CD137 agonists have been shown to limit autoimmune disease in several mouse models.36–39 The systemic expansion of Tex cells may also account for the SAE induced by anti-CD137 in cancer patients.34,35 Indeed, aged patients have a long history of infections and may contain a larger repertoire of CD8+ Tex cells that could expand and may be responsible for liver inflammation upon systemic CD137 stimulation.79–81 These results highlight the importance of therapeutic strategies favoring intratumor delivery of anti-CD137 mAbs to limit the risk of systemic activation of bystander Tex subsets, although the long-term benefit for TILs is still hypothetical.82,83
The T cell exhaustion program is often considered as a tumor escape mechanism limiting anti-tumor functions of CD8+ T cells.5 Indeed, Tex cells have reduced effector functions and display high levels of inhibitory receptors. Yet Tex cells are not inert, and T cell exhaustion may not always be unfavorable in cancer and chronic infectious disease.16 Indeed, Tex cells present residual functions, which may be important in vivo for control of tumor growth and viral replication. For example, depletion of CD8+ Tex cells during the chronic phase of simian immunodeficiency virus (SIV) infection resulted in exacerbation of viremia.84 Here, we found that decreased Tex cell frequency in CD137-deficient mice reduced CD8+ T cell infiltration and increased tumor growth as compared with WT counterparts. Similar decrease in effector T cell persistence was described in chronic infectious disease in the absence of Tox.13 Thus, the Tex cell program seems to ensure chronic pathogen or tumor control while limiting T cell-mediated immunopathology that fully activated cells would engender. Manipulating such subsets represents one of the most promising anti-tumor strategies. Yet, pre-existing tumor-specific T cells may have limited reinvigoration capacity, and the T cell response to checkpoint blockade rather derives from a distinct repertoire of T cell clones that may have recently entered the tumor.85 In this context, Tex cell expansion by anti-CD137 agonists may useful and could improve ICB efficacy, as shown in our tumor mouse models.
Limitations of the study
We found that the impact of CD137 deficiency on Tpex cells was more modest than on TermTex cells in the mixed chimera tumor model. This suggests that Tpex cells, at least in tumors, may depend less on CD137 than TermTex cells although CD137 stimulation by agonists quickly promoted Tpex cell proliferation. These questions regarding the relative importance of CD137 in the different Tex cell subset remains to be addressed. In addition, further experiments are required to determine the source of CD137-L in the tumor context. While activated DCs express high level of CD137-L, they might not be the only source in tumor contexts as many tumor cell types have been shown to express this ligand.86 Finally, the importance of CD137 signaling for Tex expansion differentiation or persistence in chronic infectious disease will need to be investigated.
STAR★METHODS
RESOURCE AVAILABILITY
Lead contact
Further information and requests for resources and reagents should be directed to and will be fulfilled by the lead contact, Ludovic Martinet (ludovic.martinet@inserm.fr).
Materials availability
Unique reagents and cell lines generated in this study may be made available on request (pending continued availability) from the lead contact with a completed materials transfer agreement.
Data and code availability
The datasets in this publication have been deposited in NCBI’s Gene Expression Omnibus and are accessible through GEO Series accession numbers GSE205702, GSE205703, GSE230626, and GSE228271. All analyses were done with custom R scripts and are available upon request using standard R packages. No new algorithms were developed during this study.
EXPERIMENTAL MODEL AND STUDY PARTICIPANT DETAILS
Mouse models
Mouse strains were maintained either in the SPF animal facility of the US006 CREFRE-Inserm/UPS which is accredited by the French Ministry of Agriculture (accreditation number A-31 55508). Unless specified tumor experiments used both male and female mice between 6 and 12 weeks of age. Donors and recipients of adoptive T cell transfers were sex matched. Animal experiments were conducted and approved by the Ministère de l’Enseignement Supérieur, de la Recherche et de l’Innovation (APAFIS#5614–20 16060815487810 v4) and are in compliance with the French regulations on care and protection of laboratory animals. For survival analysis, mice were monitored daily according to institutional ethic guidelines, and were euthanized when mice developed signs of reduced mobility including paralysis, hunched posture, or respiratory distress. All mice used in this study were on a C57BL/6 genetic background. WT mice were purchased from Janvier laboratories. Ifngr−/−, Ifnar−/−, Il12p40−/−, Il18−/−, Il6−/−, Tnf−/−,Il10−/−, Il1r−/−, Il27ra−/−,Ccl5−/−, Rag2−/−Il2rg−/−, B2m−/−, OT1 and CD45.1 mice have already been described. ROSA26tomatoxCd137fl/fl and Cd137fl/fl mice were generated by Dr. B. Salomon (Infinity, Toulouse) and crossed with Cd4cre mice. Cd4cre crossed with Relafl/fl, Relfl/fl, Relbfl/fl or Nfkb2fl/fl mice were kindly provided by Dr Yenkel Grinberg-bleyer (CRCL, Lyon). Traf1−/− mice were kindly provided by Dr T. Watts (University of Toronto).
Cell lines and cell culture
B16F10 melanoma cell line and variants stably expressing the MHC-I molecule H-2Kb (B16K1)87 or ova (B16-ova) as well as MC38 colon cancer cell line were used in this study. B16F10, B16-ova and B16K1 cells lines were cultured in DMEM medium containing 10% heat-inactivated fetal calf serum (FCS); MC38 were cultured in DMEM medium High glucose containing 10% heat-inactivated fetal calf serum (FCS). Cells were tested negatively for mycoplasma contamination and maintained in culture for a limited number of passages. Transplantable Vk*MYC MM cell line (Vk12653) was kindly provided by Bergsagel. L (Mayo clinic, USA). Transplantable MM cell line Vk12653 were generated and expanded as previously described.33,96
METHOD DETAILS
Flow cytometry
Single cell suspensions were stained according to standard protocols with previously described anti-mouse and human antibodies listed in the key resources table. Antibodies were purchased from miltenyi biotec, eBioScience, BioLegend, or BD Biosciences. Surface staining was performed with Abs for 30 min at 4 °C in PBS supplemented with 2% FCS and 2 mM EDTA. For the intracellular staining, cells were fixed and permeabilized using BD Cytofix/Cytoperm permeabilization kit (BD Biosciences) or Transcription Factor Fixation/Permeabilization kit (Thermofisher).
Mouse tumor implantation, tumor measurement, and tumor digestion
The left flank of mice was shaved and B16F10 (5.105), B16K1 cells (106), B16-ova cells (106), MC38 cells (2.106) were injected subcutaneously (s.c.) in 100 μl of PBS. Tumor area and volume were estimated by measuring the tumor size in two dimensions using a caliper. Tumors were measured three times per week. Mice were sacrificed at the indicated time points or when the estimated tumor volume reached 2 cm3. TILs were analyzed as previously described. Briefly, solid tumors were excised, manually dissociated and enzymatically digested with Tumor Dissociation Kit (Miltenyi Biotec) and then incubated at 37 °C for 30 min. After incubation, digested tumors were mashed through 70μm filters and immune cells were enriched using CD45 microbeads (Miltenyi Biotec) before TILs analysis. Vk12653 MM cells (2.106) were injected i.v. into tail vein of indicated strains of mice. The percentage of monoclonal Ig in the serum was quantified by serum protein electrophoresis (Sebia Hydrasys system). The phenotype, percentage and number of BM B220− CD138+CD155+PCs and CD8+ TILs were analyzed by flow cytometry at the indicated time points as described previously.33
Mouse T-cell functional assays
For cytokine production assays, freshly isolated CD8+ Tem cells or PD1+ and PD1− CD8+ T cells were isolated using mouse CD8+ T cell isolation kit (Miltenyi Biotec) and FACSaria™ Fusion (BD biosciences) and were stimulated with plate-bound anti-CD3 (0.3–3 μg/ml, 145–2C11, Biolegend) and soluble anti-CD28 (1 μg/ml, 37.51, Biolegend) or with Phorbol myristate acetate (PMA; 50 ng/ml, Sigma) and ionomycin (1 μg/ml, Sigma) in the presence of Golgi Plug (BD biosciences) for 5 h. Intracellular cytokine staining was performed as described above. For T cell proliferation assay, freshly sorted CD8+ T cells were loaded with CTV (Thermo Fisher Scientific) according to manufacturer’s instructions prior to stimulation. CTV dilution was analyzed after 4 days. Cytokine levels were measured in the corresponding cell culture supernatants by Cytometric Bead Array (CBA, BD Biosciences) after 48 hrs.
CD8+ T cell gene editing
Ribonucleoprotein (RNP) complexes were assembled using recombinant Cas9 (IDT) and predesigned Alt-R CRISPR-Cas9 gRNAs (IDT) duplexed with atto550 conjugated tracrRNA (IDT). CD8+ T cells were isolated from the spleen as previously described and 10×106 CD8+ T cells were resuspended in 20uL P3 primary cell nucleofection buffer (Lonza), mixed with 5uL of Cas9-RNP complex and transferred to wells of a 16 well nucleocuvette strip (Lonza-V4XP-3032). CD8+ T cells underwent nucleofection using the DN100 program in a Lonza 4D-nucleofector device. Immediately after nucleofection, cells were harvested and cultured in complete RPMI supplemented with IL-7 (10 ng/mL) for 24 hrs. Following incubation, cells were harvested and washed. 106 CD8+ T cells were adoptively transferred into recipient mice. For negative control treated cells, RNP complexes included negative control crRNA #1 (IDT). For tox targeted cells, RNP complexes included three predesigned sgRNAs (IDT) targeting the tox gene. Guides: Mm.Cas9.TOX.AA – AACCGGATTCTACCTCATTC; Mm.Cas9.TOX.AB – GATCACGGTGTCCAACATGC; Mm.Cas9.TOX.AC – TTTGTTCTTTCGTGATACCC Negative control scrRNA #1 – cat# 1072544 (IDT) – no guide sequence publicly available.
TNFR agonist treatment
C57BL/6 WT were treated by i.p. injection of anti-CD137 (1–100 μg, mIgG2a 3H3 or mIgG1 Lob12.3, BioXcell, twice a week), anti-OX40 (200 μg; OX-86, BioXcell, twice a week), anti-GITR (200μg; DTA-1, BioXcell, twice a week) or with control IgG mAbs (HRPN, BioXcell). After 2–3 weeks, lymphoid organs were isolated for CD8+ T cell phenotypic analysis and functional assays.
CD137 prophylactic treatment
Groups of C57BL/6 wild type (WT) were conditioned with anti-CD137 (10 μg, mIgG2a 3H3, BioXcell, twice a week) or IgG mAbs (HRPN, BioXcell) for the indicated period and subsequently injected s.c. with B16K1, B16F10 or VK12653 cells. In some B16K1 experiments mice were treated with anti-PD1 (200 μg i.p., RMP1–14 on days 6, 9, 12 relative to tumor inoculation) or with cIg (200 μg i.p; 2A3, BioXCell).
Immune checkpoint blockade combination
The indicated group of mice bearing palpable B16-ova, B16K1 or MC38 tumors (25–50 mm2 area) were treated with anti-PD1 (200–250 μg i.p., RMP1–14, 3 shots on day 9, 12, 15 relative to tumor inoculation) or with cIg (200 μg i.p; 2A3, BioXCell). Ig or anti-PD1 treated mice were treated with anti-CD137 (10 μg, mIgG2a 3H3, BioXcell, on day 15, 18, 21 relative to tumor inoculation) or IgG (HRPN, BioXcell).
Cell transfer experiments
For Figure 2D, 1.107 OT-1 splenocytes were injected i.v. into Cd45.1 mice that were subsequently injected with B16-ova on day 1. Mice were treated with anti-CD137 (10 μg, mIgG2a 3H3, BioXcell, on day 7, 11, 14, 17) or IgG (HRPN, BioXcell) and sacrificed on D21 for CD45.2+ OT-1 TIL FACS analysis. For Figures S4A and S4B, 3.107 OT-1 splenocytes were injected i.v. into WT mice that were subsequently treated with anti-CD137 (10 μg, mIgG2a 3H3, BioXcell, twice a week) or IgG control. For Figure 7C, OT-1 mice were treated 18 days with anti-CD137 mAbs (100 μg, mIgG2a 3H3, BioXcell twice a week) and 5.105 FACS sorted splenic PD1− Tmem or PD1+ Tex cells were transferred into Rag2−/−Il2rg−/− mice. After 6 days mice were injected with B16-ova cells and monitored for tumor growth and survival. For Figures 4A and 4B, 3.106 CD8+ T cells isolated from WT mice and were injected i.v. into B2m−/− mice that were subsequently treated with anti-CD137 or Ig control. For Figures 3E and 3F, 5.105 Tn (CD44− CD62L+), Tmem (PD1− CD44hi) and Tex cells (CD44hi PD-1+) were FACS sorted from 15 weeks Cd45.1 mice and were injected i.v into into Cd4creCd137fl/fl mice that were treated with anti-CD137 mAbs (3H3, 10 μg) or IgG control. For Figures 3L–3N, S1E, S1F, and S5D–S5F, Rag2−/−Il2rg−/− mice were injected with 5.105 splenocytes, isolated from Cd4creCd137fl/flROSA26tomato (CD137−/−tomato+) and Cd137fl/flROSA26tomato (CD137+/+tomato−) littermates, or with 5.105 PD1− (Tmem), PD1+SLAMF6+Tim3− (Tpex-like) or PD1+SLAMF6−Tim3+ (Tex-like) splenic CD44hiCD8+ T cells isolated from WT mice. For Figures 6J and 6K 106 nucleofected Tox KO CD45.2 and ctrl CD45.1 CD8+ T cells were adoptively transferred into Rag2−/− gC−/− mice by tail vein injection. After one week, mice were treated with anti-CD137 mAbs (clone 3H3, BioXell) on day 7, 11, 15 and 18. At D21, mice were euthanized, spleen collected and transferred cells were analyzed by flow cytometry as mentioned above.
Hematopoietic chimeras
C57BL/6 mice were lethally irradiated (9 Gray) and reconstituted by intravenous injection of 5.106 BM cells from Cd4creCd137fl/fl ROSA26tomato and Cd137fl/flROSA26tomato or Cd4creCd137fl/fl and Cd45.1. The reconstitution of the immune system of the recipient mice was verified 7 weeks after BM transplantation by blood analysis. Mice were subsequently treated with anti-CD137 or IgG control mAbs or injected with B16K1 cells or MC38 as described above.
Calcineurin inhibitor experiments
C57BL/6 WT were treated by i.p. injection with anti-CD137 (10 μg; 3H3, BioXcell, twice a week) or control IgG (HRPN, BioXcell), and were treated daily with FK506 (invivogen, i.p. injection 3 mg/kg) or with cyclosporine A (invivogen, oral gavage, 28 mg/kg). Mice were sacrificed at day 14, and CD8+ T cells from spleen were prepared for phenotypical analyses.
3′ single-cell RNA-sequencing
C57BL/6 mice were injected with Vk12653 MM cells. After 10 days, mice were treated with anti-CD137 (100 μg, 3H3, BioXcell, twice a week) or with control IgG (100 μg, HRPN, BioXcell). At the indicated time points, CD8+ T cells were isolated from the BM using mouse CD8+ T cell isolation kit (Miltenyi Biotec) and FACSaria™ Fusion (BD biosciences). Single-cell libraries (3′ gene expression) were generated using the Chromium Controller Instrument and Chromium Single Cell 3′ Library & Gel Bead Kit v3 according to the manufacturer’s protocol (10× Genomics). Single-cell library size and quality were confirmed on the Fragment Analyzer (Agilent). KAPA Quantification Kit for Illumina platforms (KAPA Biosystems, Roche) was used to quantify libraries. The libraries were sequenced on a NextSeq 550 (Illumina) in pair-end sequencing 28 bp (read1) × 91 bp (read2) and a single index 8 bp in length.
5′ single-cell RNA-sequencing
Tomato+ and tomato− spleen and tumor CD8+ T cells were isolated from (CD137−/− tomato+) and (CD137+/+tomato−) mixed BM chimera bearing B16K1 for 19 days using FACSaria™ Fusion.
Single-cell libraries (5′ gene expression) were generated using the Chromium Controller Instrument and Chromium Next GEM Single Cell 5’ Library & Gel Bead Kit v1.1 according to the manufacturer’s protocol (10X Genomics). Additional Chromium Single Cell V(D)J Enrichment Kit, Mouse T Cell were used to generate TCR Libraries. Single-cell library size and quality were confirmed on the Tapestation 4200 (Agilent) and pooled to reach at least 20,000 read pairs for 5’ Gene Expression Library; 10,000 read pairs of Protein Library and 5,000 read pairs of V(D)J Library. Libraries were sequenced twice on a NextSeq 550 (Illumina) in pair-end sequencing 26 bp (read1) × 91 bp (read2) and a single index 8 bp in length. A similar workflow was performed on spleen memory CD8+ T cells (CD44hi/PD1−), precursor exhausted T cells (CD44hi/PD1+/Slamf6+/Tim3−), and exhausted T cells (CD44hi/PD1+/Slamf6−/Tim3+) sorted using FACSaria™ Fusion from C57BL/6 mice treated with anti-CD137 (10 μg, 3H3, BioXcell, twice a week, 5 mice) or with control IgG (100 μg, HRPN, BioXcell, twice a week, 10 mice) for 14 days.
ATAC-seq sample preparation
C57BL/6 mice were treated with anti-CD137 (10 μg, 3H3, BioXcell, twice a week) or with control IgG (10 μg, HRPN, BioXcell). At the indicated time points, splenic CD44hiCD8+ T cells were isolated using FACSaria™ Fusion (BD biosciences). ATAC-seq was performed as previously described.97 Briefly, 50 000 cells were lysed in ice-cold lysis buffer and the transposition reaction was performed using the Tn5 transposase at 37 °C for 30 min. DNA was purified using the QIAGEN MinElute kit (QIAGEN). The libraries were prepared using the Nextera DNA Library Prep Kit (Illumina) and purified using AMPure XP beads (Beckman) following a double-sided protocol to remove primer dimers and large fragments. Samples were performed in duplicates, multiplexed and sequenced on NextSeq-500 (75 bp paired-end reads).
QUANTIFICATION AND STATISTICAL ANALYSIS
Statistical analyses were performed using GraphPad Prism 9 Software. Mann-Whitney U test or paired and unpaired student t test were used for single comparisons between two groups. For comparison of three or more groups, one-way ANOVA with Tukey’s multiple comparison test, Holm-Sidak multiple test correction, or non-parametric Kruskal-Wallis test with Dunn’s multiple comparison post-test were used. Differences in survival were evaluated with the Mantel-Cox test. P < 0.05 was considered statistically significant (P<0.05 = *; P<0.01 = **; P<0.001 = ***).
Flow cytometry
Data were collected with Aurora (Cytek Biosciences), LSR II or Fortessa X20 flow cytometers (BD Biosciences) and analyzed with FlowJo software (TreeStar). Dead cells and doublets were excluded by LiveDead staining (Thermo Fisher Scientific).
Single-cell RNA-seq analysis
Cell-level quality control, dimensionality reduction, and clustering
Raw data (FastQ files) for expression, antibody detection and V(D)J repertoire quantification were generated with CellRanger mkfastq and aligned and demultiplexed with CellRanger count or CellRanger vdj. For the anti-CD137 sorted subsets dataset, CellRanger count was rerun with the option –force-cells to correct for inconsistencies between the number of cells identified in the first round of alignment/demultiplexing and the number of cells calculated upon inspection of the barcode rank plot. For the anti-CD137 dataset and CD137−/− dataset, data were then loaded in an R session with the Seurat 3.0 toolkit package involving the normalization and variance stabilization package sctransform.98 For the anti-CD137 sorted subsets dataset, data were log-normalized. Samples were individually filtered using the following criteria: for the anti-CD137 and CD137−/− dataset, we kept cells with 30,000UMIs and < 25% mitochondrial genes. For the anti-CD137 sorted subsets dataset, we retained cells with a number of unique RNA features between 500 and 4000 and less than 10% of mitochondrial genes. For the anti-CD137 sorted subsets dataset, cells were scored by for the cell cycle phase using genes from this source (https://github.com/hbc/tinyatlas/blob/master/cell_cycle/Mus_musculus.csv) as input. The cell cycle score was then regressed during data scaling to generate inputs for principal component analysis. Using Seurat, data sets were reduced by PCA, using the first 13 (anti-CD137 dataset) and 10 (CD137−/− dataset, anti-CD137 sorted subsets dataset) principal components to reduce dimensionality by Uniform Manifold Approximation and Projection (UMAP). A resolution parameter set the granularity at 1.2 for the clustering by the K-nearest neighbor graph-based clustering approach of Seurat’s Find Clusters function.
Signature scores
In Figures 1J and S2D, signature scores were computed with Single-Cell Signature Explorer Scorer99 with signatures downloaded from MsigDB100 or using published signatures.19,40,41,49 In all the other figures, signature scores were calculated using the AddModuleScore function of Seurat. The mouse nfkb signature was obtained at this address (https://bioinfo.lifl.fr/NF-ΚB/) and has been curated and maintained by the Gilmore Lab at Boston Univesity. All the other mouse signatures were obtained from lists of genes found differentially expressed between indicated conditions of interest that were provided in supplementary tables in the relative publications. After subsetting these lists to include only genes that were upregulated with an adjusted p value smaller than 0.05, they were provided as input to the AddModuleScore function.
Relative likelihood estimate using MELD
MELD101 was run on the PCA cell embedding matrix, with the genotype of the cell as the raw experimental signal.
Single-cell reference mapping
The anti-CD137 dataset was projected on a reference dataset of exhausted T cells52 using the Seurat functions FindTransferAnchors, TransferData, MapQuery as described at this address (https://satijalab.org/seurat/articles/integration_mapping.html)
TcR clonal expansion analysis
TcR repertoire analyses were performed using the R package scRepertoire.62 To match clonotypes and single cell transcriptomes, and classify cells into clonal expansion bins, we used the function combineExpression() with the argument “proportion” set as TRUE. The clonal expansion score was calculated with the scRepertoire function StartracDiversity(), which incorporates the STARTRAC software.63 In order to take into account the confounding effects of sample size on clonal expansion estimates, for the data presented in Figure 4F we generated a list of 10 randomly sampled subsets of the original data. The size of these replica downsamples was set at 90% of the smallest sample between the Ig and anti-CD137 condition, for each of the three subsets.
TcR clonal overlap analysis
To measure the TcR overlap between Tpex and Tex clusters, we calculated the Morisita index, for either treatment separately, using the scRepertoire function clonalOverlap(method = “morisita”). To visualize the TcR ovelap, we generated circos plots with the scRepertoire function getCirclize() and the circlize function chordDiagram().
TcR sequence-based groups analysis
To group TcRs into sequence-based similarity groups, we used the scRepertoire function clusterTCR() with the value “aa” to the argument “sequence”, as well as the function runTrex() from the Trex package (https://github.com/ncborcherding/Trex) with the value “KF” to the argument “AA.properties”. The outputs of RunTrex was used as input for the Seurat functions RunUMAP(), FindNeighbors() and FindClusters(). TcR group membership was then used to calculate a treatment skew, by computing the percentage of cells in each TcR group that were derived from Ig-treated or aCD137-treated mice. Statistical significance of this skew was determined by cumputing the Pearson’s Chi-squared test with Yates’ continuity correction with the R package stats.
ATAC seq bioinformatic analysis
trimGalore (v0.6.5) (https://github.com/FelixKrueger/TrimGalore) was used to remove adapters and low-quality ends (Phred score<20). Reads smaller than 20 bp were also discarded. After read trimming, FastQC (v0.11.7) (https://github.com/s-andrews/FastQC) were performed to check the successful removal of adapter and low-quality bases. Trimmed reads were then mapped to the new murine reference genome (GRCm39) using STAR (v2.6.0c)91 aligner with “alignIntronMax” parameter set to 1 turning off splicing. Multiple and duplicated reads were removed with samtools (v1.9) (https://github.com/samtools/samtools) and MarkDuplicates of Picard package (v1.88) (https://github.com/broadinstitute/picard) respectively. Enriched peaks were called using MAC2 (v2.1.0.20150731) (https://github.com/macs3-project/MACS ) with default parameters. BigWig files were generated with bamCoverage function of deeptools (v3.3.1) (https://github.com/deeptools/deepTools) package and were normalized with quantile function of ChIPin package (v0.1.0).94
Identification of differentially accessible regions (DAR)
To identify differentially accessible regions, we merged the peaks detected by MAC2 (v2.1.0.20150731) in all conditions with bedtools merge function (v2.27.1) (https://github.com/arq5x/bedtools2). The signal on peaks was quantified with get_coverage function of megadepth package (1.8.0) (https://github.com/LieberInstitute/megadepth). The differenatial analysis was performed in pairwise (CD137 J18 vs Ig / CD137 J5 vs Ig) with DESeq2 (v1.38.3).95 The peaks were defined as differentially accessible if their absolute value of log2 fold change is greater than 2 and p-value adjusted lower than 0.01. ATAC signals around up and down DARs (−1.5Kb +1.5 Kb) for each sample were visualized using computeMatrix and plotHeatmap functions of deeptools tool (v3.5.1) (https://github.com/deeptools). The genomic tracks were generated using pyGenomeTracks (v3.8).102 The peak annotation of DAR was realized using annotatePeaks.pl function of the HOMER package (v4.10.4) (https://github.com/IGBIllinois/HOMER).
Identification of differentially accessible promoters and ingenuity pathways analysis (IPA)
The promoters were defined as the regions surrounding +/−2Kb the TSSs of the genes. The differential analysis was performed as explained above for the identification of differential accessible regions. The fold changes and pvalues calculated by DESeq2 were processed by IPA tool103 to determine likely upstream regulators using machine learning methods. The most significant regulators predicted in the analysis are summarized in a graphical summary network.
Transcription factor inferring
To identify transcription factors potentially responsible for the differential ATAC signal observed downstream of treatment with anti-CD137, we first downloaded motifs from the JASPAR database (v0.99.10)104 using the function getJasparMotifs of chromVar package (v1.20.2 ) (https://github.com/GreenleafLab/chromVAR). Then, we realized the motif enrichment analysis using the function matchMotifs from the motifmatchr package (v1.20.0) (https://github.com/GreenleafLab/motifmatchr) using GRCm39 as a reference genome. To compute accessibility deviations for each motif in each condition, we used computeDeviations function from chromVar package (v1.20.2), that calculates the difference between the total number of reads mapping to peaks containing a given motif relative to an expected number of reads. Finally, we called computeVariability function of chromVar to get: 1/variability, that represents the standard deviation of the scores computed above and thus estimates the degree of involvement of the associated transcription factor in explaining the differences observed, and 2/ pvalue for the variability calculated being statistically significant.
Human scRNA-seq data
For the melanoma dataset,47 gene expression matrices and metadata were obtained from dbGaP (accession number phs002289.v1.p1) and normalization, cell-level QC and dimensionality reduction were performed as described in the original publication. For clarity purposes, the orginal clusters were grouped in six phenotypic metaclusters based on inspection of the cluster markers genes. For the breast cancer dataset, gene expression matrices and metadata were downloaded from http://biokey.lambrechtslab.org. Data were normalized and filtered as done in the original publication,48 and the dataset was subsetted to only include CD8 T cells from baseline (untreated) samples.
We selected consensus markers of exhaustion from a comprehensive review of CD8 states from single-cell studies of human TILs.49 The selected genes consisted of HAVCR2, IFNG, ITGAE, PDCD1, CXCL13, LAYN, LAG3, TIGIT, CTLA4, ENTPD1. This gene set was used to score individual cells with the Seurat function AddModuleScore with default parameters. To assess which genes display the highest positive and negative correlation with TNFRSF9 expression, we used the R function cor.test with the following parameters: method = “spearman” and exact = FALSE. Genes with zero average expression were removed from the analysis. For each gene, we extracted the correlation coefficient (estimate) and the p value corrected for multiple testing.
Graphics
Figures were made in Adobe Illustrator 2022 with images generated with either GraphPad Prism 9 Software or with the following R packages: ggplot2 v3.3.6, ggforce v 0.4.1, ggsignif v0.6.3, viridis v0.6.2, ggsci v2.9. Graphical abstract was made with Biorender.
Supplementary Material
KEY RESOURCES TABLE
| REAGENT or RESOURCE | SOURCE | IDENTIFIER |
|---|---|---|
|
| ||
| LEAF ™ Purified anti-mouse CD3ε Antibody | Biolegend | Cat#: 100331 RRID:AB_11150783 |
| LEAF™ Purified anti-mouse CD28 Antibody | Biolegend | Cat#: 102112 RRID:AB_11150408 |
| Anti-mouse B220/CD45R (RA3–6B2) | Biolegend | Cat:103206 RRID:AB_2174262 |
| Anti-mouse CD3-BV421 (145–2C11) | BioLegend | RRID:AB_960120 |
| Anti-mouse CD107a-PeCy7 (eBio1D4B) | Biolegend | Cat#: 121619 RRID:AB_657556 |
| Anti-mouse CD138-BV421 (281–2) | BD Biosciences | Cat#: 740033 RRID:AB_394999 |
| Anti-mouse CD138-BUV373 (281–2) | BD Biosciences | Cat#: 564430 RRID:AB_394999 |
| Anti-mouse CD8-BUV395 (53–6.7) | BD Biosciences | Cat#: 563786 RRID:AB_962672 |
| Anti-mouse CD8-APC (53–6.7) | BD Biosciences | Cat#:560516 RRID:AB_962672 |
| Anti-mouse CD8-BV421 (53–6.7) | BD Biosciences | Cat#: 563898 RRID:AB_962672 |
| Anti-mouse CD8-PeCy7 (53–6.7) | BD Biosciences | Cat#: 561097 RRID:AB_962672 |
| Anti-mouse CD62L-BV605 (MEL-14) | BioLegend | Cat#: 104437 RRID: AB_11125577 |
| Anti-mouse TCR Vbeta 5.1 5.2 TCR-BUV737 (MR9–4) | BD Biosciences | Cat#: 748931; RRID:AB_2873334 |
| Anti-mouse TCR Valpha2-eFluor 450 (B20.1) | Thermo Fisher Scientific | Cat#: 48–5812-82 RRID: AB_10804752 |
| Anti-mouse CD45.2-BUV395 (104) | BD Biosciences | Cat#: 564616 RRID: AB_2738867 |
| Anti-mouse CD44-FITC (IM7) | BioLegend | Cat#: 103006 RRID: AB_312957 |
| Anti-mouse CTLA-4-BV421 (UC10–4B9) | BioLegend | Cat#: sc-53682 RRID:AB_628930 |
| Anti-mouse LAG3-PercPCy5.5 (eBioC9B7W) | Thermo Fisher Scientific | Cat#: 46–5882-80 RRID:AB_494216 |
| Anti-mouse Tbet-Pecy7 (4B10) | Thermo Fisher Scientific | Cat#: 25–5825-82 RRID:AB_11042699 |
| Anti-mouse Tim3-Pecy7 (RMT3–23) | Thermo Fisher Scientific | Cat#:432910 RRID: AB_2573483 |
| Anti-mouse TNF-PercPCy5.5 5 (MP6-XT22) | BD Biosciences | Cat#: 560659 RRID: AB_1727580 |
| Anti-mouse KI67-PerCPefluor710 (SOLA15) | Thermo Fisher Scientific | Cat#: 56–5698-82 RRID:AB_11040981 |
| Anti-Mouse Ly-108 (SLAMF6) Pacific Blue [clone: 330-AJ] | BioLegend | Cat#: 134608; RRID: AB_2188093 |
| Anti Mouse Ly-108 BUV395 [13G3] | BD Biosciences | Cat#: 745730; RRID:AB_2743205 |
| Anti-Human/anti-Mouse TCF1/TCF7 AF647 [C63D9] | Cell Signaling Technology | Cat#: 14456S |
| Anti-human/mouse Tcf1/tcf7 AF488 [C63D9] | Cell Signaling Technology | Cat#: 6444S |
| Anti-human/Anti-Mouse TCF1/TCF7 PE [C63D9] | Cell Signaling Technology | Cat#: 6709S |
| Anti-mouse CD45.1-FITC (A20) | BD Biosciences | Cat#: 110706 RRID: AB_313495 |
| Anti-mouse TCRb-Perc PCy5.5 (H57–597) | BioLegend | Cat#:109228 RRID: AB_1575173 |
| Anti-mouse CD155 (PVR) PE (TX56) | BioLegend | Cat#:131508 RRID: AB_1279107 |
| Anti-mouse TIGIT-PeCy7 (1G9) | BioLegend | Cat#:142108 RRID: AB_2565649 |
| Anti-mouse TIGIT-APC (1G9) | BioLegend | Cat#: 142105; RRID: AB_10962572 |
| Anti-mouse Eomes-efluor660 (DAN11MAC) | Thermo Fisher Scientific | Cat#:50–4875-80 RRID: AB_2574227 |
| Anti-mouse Ki67-AF700 (SOLA15) | Thermo Fisher Scientific | Cat#:56–5698-92 RRID: AB_2637480 |
| Anti-mouse Eomes-EF450 (DAN11MAC) | Thermo Fisher Scientific | Cat#:48–4875-82 RRID: AB_2574062 |
| Anti-mouse IFNg BV421 (XMG1.2) | BD Biosciences | Cat#: 505830 RRID: AB_2563105 |
| Anti-mouse CD226-BV421 (TX42.1) | BioLegend | Cat#:133615 RRID: AB_2715977 |
| Anti-mouse TCRb-BV510 (H57–597) | Biolegend | Cat#:109233 RRID: AB_2562349 |
| Anti-mouse TCRb-PercPCy5.5 (H57–597) | BioLegend | Cat#:109228 RRID: AB_1575173 |
| Anti-mouse CD62L-APC (MEL-14) | invitrogen | Cat#: 17–0621-81 RRID: AB_469410 |
| Anti-mouse PD1 (CD279)-BV785 (29F.1A12) | BioLegend | Cat#:135225 RRID: AB_2563680 |
| Anti-mouse PD-1 | Bio X Cell | Cat#: BP0146 RRID: AB_10949053 |
| Anti-mouse OX40 | Bio X Cell | Cat#: BE0031 RRID: AB_1107592 |
| Anti-mouse 4–1BB (CD137, 3H3) | Bio X Cell | Cat#: BE0239 RRID: AB_2687721 |
| Anti-mouse 4–1BB (CD137, LOB12.3) | Bio X Cell | Cat#: BE0239 RRID: AB_10949016 |
| Anti-mouse GITR | Bio X Cell | Cat#: BE0063 RRID: AB_1107688 |
| Rat IgG2a | Bio X Cell | Cat#: BP0089 RRID: AB_1107769 |
| Rat IgG1 | Bio X Cell | Cat#: BP0169 RRID: AB_1107775 |
|
| ||
| Chemicals, peptides, and recombinant proteins | ||
|
| ||
| Recombinant murine IL-7 | Peprotech | Cat#: 217–17 |
| Brefeldin A Solution (1000X) | Thermo Fisher Scientific | Cat#: 00–4506-51 |
| Golgi Plug | BD Biosciences | Cat#: 555029 |
| Protein Transport Inhibitor | BD Biosciences | Cat#: 554724 |
| Ionomycin | Sigma-Aldrich | Cat#: I0634 |
| Phorboll 12-myristate 13-acetate (PMA) | Sigma-Aldrich | Cat#: P8139 |
| RPMI Medium 1640 | Thermo Fisher Scientific | Cat#: 61870–010 |
| Fetal Bovine Serum | N/A | N/A |
| Ficoll® Paque Plus | Sigma-Aldrich | Cat#: 17–1440-03 |
| Acridine Orange / Propidium Iodide (AO/PI) | Logos Biosystems | Cat#: F23001 |
| RLT lysis buffer | Qiagen | Cat#: 79216 |
| B-mercaptoethanol | Sigma-Aldrich | Cat#: M6250 |
| FK506 | InvivoGen | Cat#: inh-fk5–5 |
| Cyclosporine A | InvivoGen | Cat#: tlrl-cyca |
| Alt-R® S.p. Cas9 Nuclease V3 | IDT | Cat#: 1081059 |
| Negative control crRNA #1 | IDT | Cat#: 1072544 |
|
| ||
| Critical commercial assays | ||
|
| ||
| Tumor Dissociation Kit | Miltenyi Biotec | Cat#130–096-730 |
| CD45 (TIL) microbeads, mouse | Miltenyi Biotec | Cat#: 130–110-618 |
| RNeasy Plus Micro Kit | Qiagen | Cat#: 74034 |
| Fixable viability dye efluor 780 | Thermo Fisher Scientific | Cat#:65–0865-14 |
| CellTrace™ Violet Cell Proliferation Kit | Thermo Fisher Scientific | Cat#:C34557 |
| CD8+T cell isolation Kit, mouse | Miltenyi Biotec | Cat#:130–104-075 |
| Foxp3 Transcription Factor Staining Buffer Set | Thermo Fisher Scientific | Cat#:00–5523-00 |
| Fixation/Permeabilization Solution Kit | BD Biosciences | Cat#: 554714 |
| TRUSEQ STRANDED MRNA HT (96 SAMPLES) | Illumina | Cat#: RS-122–2103 |
| NEXTSEQ 500 HIGH OUTPUT KIT v2 (150cycles) | Illumina | Cat#: FC-404–2002 |
| Chromium Single Cell 3′ Library & Gel Bead Kit v3 | 10XGENOMICS | Cat#: 1000147 |
| KAPA Quantification Kit | KAPABiosystems | Cat#: KK4824 |
| Chromium Next GEM Single Cell 5’ Library & Gel Bead Kit v1.1 | 10XGENOMICS | Cat#: 1000167 |
| QIAGEN MinElute kit | QIAGEN | Cat#: 28004 |
| Nextera DNA Library Prep Kit | Illumina | Cat#: FC-131–1096 |
| Illumina Novaseq 6000 S1 Reagent Kit v1.5 | Illumina | Cat#: 20028313 |
| CBA Mouse TNF Flex Set - C8 |
BD Biosciences | Cat#: 558299 |
| CBA Mouse IFNγ Flex Set - A4 |
BD Biosciences | Cat#: 558296 |
| Mouse Soluble Protein Master Buffer Kit | BD Biosciences | Cat#: 558266 |
| P3 Primary Cell 4D-Nucleofector™ X Kit S | Lonza | Cat#: V4XP-3032 |
|
| ||
| Deposited data | ||
|
| ||
| Transcriptomic analysis of VK12653 Multiple Myeloma bone marrow microenvironment upon treatment with anti-CD137 agonists | This paper | GEO: GSE206545 |
| Single cell Transcriptomic analysis of CD8+ T cells treated with anti-CD137 agonists with in VK12653 Multiple Myeloma bone marrow microenvironment. | This paper | GEO: GSE205702 |
| Single cell Transcriptomic analysis of CD8+ T cells from bone marrow chimeras reconsituted with CD137 wild-type or knock out bone marrow, and implanted with B16K1 melanoma. | This paper | GEO: GSE205703 |
| ATACseq analysis of sorted CD44hiCD8+ T cells isolated from the spleen of C57BL/6 mice treated with aCD137 or an Ig control. | This paper | GEO: GSE228271 |
| Single-cell transcriptomic analysis of sorted CD8+ T cell subsets isolated from the spleen of C57BL/6 mice treated with aCD137 or an Ig control | This paper | GEO: GSE230626 |
| Longitudinal single cell transcriptional mappin.g of effector, memory, and exhausted CD8 T cells reveals shared biological circuits across distinct cell fates | Giles et al.52 |
GSE199565; PMID: 36271148 |
| CD8 TILs from patients with metastatic melanoma | Lucca et al.47 | dbgap phs002289.v1.p1 PMID:33651881 |
| CD8 TILs from patients breast cancer | Bassez et al.48 |
http://biokey.lambrechtslab.org. PMID:33958794 |
| 10X single-cell RNASeq profiling of tumor-infiltrating CD8+ T-cells from B16-OVA mouse melanoma tumors | Miller et al.41 | GSE122675 PMID: 30778252 |
| 10X single-cell RNASeq profiling of GP33-tetramer+ CD8+ T-cells from mice chronically infected with LCMV Clone 13 | Miller et al.41 |
GSE122712 PMID:30778252 |
| D8 p.i. single cell RNA Sequencing on P14 cells | Chen et al.10 |
GSE131535; PMID:31606264 |
|
| ||
| Experimental models: Cell lines | ||
|
| ||
| Mouse: B16K1 | Gift from Dr Segui B. | Porgador et al.87 |
| Mouse: B16F10 | ATCC | Cat#: CRL-6475 |
| Mouse: MC38 | Gift from C.Devaud | Trimaglio et al.88 |
| Mouse: B16F10 that express constitutively OVA | Gift from B.Segui | Weulersse et al.24 |
| Mouse: Vkmyc12653 | Gift from L.Bergsagel | Chesi et al.89 |
|
| ||
| Experimental models: Organisms/strains | ||
|
| ||
| C57BL/J6 alias WT | Jackson Laboratory | Cat#: SC-C57J-F |
| B6.SJL-Ptprca Pepcb/BoyJ alias CD45.1 | Janvier Laboratory | RRID: IMSR_JAX:002014 |
| B6-Tg(TcraTcrb)1100Mjb/J alias OT-1 | Jackson Laboratory | Cat#: 003831 |
| B6-CD137fl/fl x Cd4CRE | Gift from B.Salomon | First description |
| B6-ROSA26tomatoCd137fl/fl x Cd4CRE | Gift from B.Salomon | First description |
| C57BL/6-Rag2−/− Il2rg−/− | Jackson Laboratory | RRID: IMSR_JAX:014593 |
| B6.IFNGR1−/− | Jackson Laboratory | RRID: IMSR_JAX:003288 |
| B6.Ifnar−/− | Jackson Laboratory | RRID: MMRRC_032045-JAX |
| B6.Il12p40−/− | Jackson Laboratory | RRID: IMSR_JAX:002693 |
| B6.Il18−/− | Gift from K.Nakamura | Nakamura et al.90 |
| B6.IL6−/− | Jackson Laboratory | RRID: IMSR_JAX:002650 |
| B6.Tnf−/− | Jackson Laboratory | RRID: IMSR_JAX:005540 |
| B6.Il10−/− | Jackson Laboratory | RRID: IMSR_JAX:002251 |
| B6.Il1r−/− | Gift from K.Nakamura | Nakamura et al.90 |
| B6.Il27ra−/− | Jackson Laboratory | RRID: IMSR_JAX:018078 |
| B6.Ccl5−/− | Jackson Laboratory | RRID: IMSR_JAX:005090 |
| B6.B2m−/− | Jackson Laboratory | RRID: IMSR_JAX:002087 |
| B6.Relafl/fl x Cd4CRE mice | Gift from Y. Grinberg-bleyer | Grinberg-Bleyer et al.66 |
| B6.Relfl/fl x Cd4CRE mice | Gift from Y. Grinberg-bleyer | Grinberg-Bleyer et al.66 |
| B6.Relbfl/fl x Cd4CRE mice | Gift from Y. Grinberg-bleyer | Lalle et al.68 |
| B6.Nfkb2fl/fl x Cd4CRE mice | Jackson Laboratory | RRID: IMSR_JAX:028720 |
| B6.Traf1−/− | Gift from T. Watts | RRID: IMSR_JAX:008076 |
|
| ||
| Recombinant DNA | ||
|
| ||
| Mm.Cas9.TOX.AA - AACCGGATTCTACCTCATTC | IDT | N/A |
| Mm.Cas9.TOX.AB - GATCACGGTGTCCAACATGC | IDT | N/A |
| Mm.Cas9.TOX.AC - TTTGTTCTTTCGTGATACCC | IDT | N/A |
|
| ||
| Software and algorithms | ||
|
| ||
| Graphpad Prism 9.3.1 software | GraphPad Software, Inc. | http://www.graphpad.com/scientific-software/prism/ |
| FlowJo V10 | FlowJo LLC | www.flowjo.com |
| Alignment | STAR (version 2.3.0) | Dobin et al.91 |
| Gene expression | Subread featurecount OUTPUTalgorithm (version 1.4.6) | Liao et al.92 |
| Gene expression normalization | limma R package | Ritchie et al.93 |
| ScRNAseq alignment | Cellranger v6.1.2 | 10x Genomics |
| ScRNAseq data editing and tidying | Tidyverse v1.3.2 | https://github.com/tidyverse/tidyverse/releases |
| ScRNAseq data visualization | ggsignif v0.6.3 | https://github.com/const-ae/ggsignif/releases |
| ScRNAseq data visualization | ggforce v0.4.1 | https://github.com/thomasp85/ggforce/releases |
| ScRNAseq data visualization | ggraph v2.1.0 | https://github.com/thomasp85/ggraph/releases |
| ScRNAseq data visualization | Viridis v0.6.2 | https://github.com/sjmgarnier/viridis/releases |
| ScRNAseq data visualization | ggsci v2.9 | https://github.com/nanxstats/ggsci/releases |
| ScRNAseq statistical analysis | broom v1.0.0 | https://broom.tidymodels.org/news/index.html |
| ScRNAseq statistical analysis | rstatix v0.7.0 | https://github.com/kassambara/rstatix |
| ScRNAseq statistical analysis | matrixStats v0.62.0 | https://github.com/HenrikBengtsson/matrixStats |
| ScRNAseq gene annotation | biomaRt v2.50.3 | https://cran.r-project.org/web/packages/biomartr/biomartr.pdf |
| ScRNAseq toolkit | Seurat v4.0.0 | https://satijalab.org/seurat/ |
| ScRNAseq batch correction | harmony v0.1.0 | https://cran.r-project.org/web/packages/harmony/index.html |
| ScRNAseq differential gene expression analysis | presto v1.0.0 | https://www.biorxiv.org/content/10.1101/653253v1.full.pdf |
| TcR repertoire analysis | scRepertoire v1.7.2 | Borcherding et al.62 |
| TcR repertoire analysis | Trex v0.99.9 | https://github.com/ncborcherding/Trex |
| ATACseq base trimming | TrimGalore v0.6.5 | N/A |
| ATACseq alignment | STAR v2.6.0c | N/A |
| ATACseq raw data manipulation | samtools v1.9 | https://github.com/samtools/samtools |
| ATACseq raw data manipulation | picard v1.88 | https://github.com/broadinstitute/picard |
| ATACseq peak calling | MACS2 v2.1.0.20150731 | https://pypi.org/project/MACS2/ |
| ATACseq data exploration | deeptools v3.3.1 | https://deeptools.readthedocs.io/en/latest/ |
| ATACseq quantile normalization | ChiPin v0.1.0 | Polit et al.94 |
| ATACseq peak signal quantification | Megadepth v1.8.0 | https://github.com/zhengqili/MegaDepth |
| ATACseq differential peak abundance analysis | DESeq2 v1.38.3 | Love et al.95 |
| ATACseq signal visualization | pyGenomeTracks v3.8 | https://pygenometracks.readthedocs.io/en/3.8/ |
| ATACseq peak structural annotation | HOMER v4.10.4 | http://homer.ucsd.edu/homer/ |
| ATACseq motif analysis | chromVar v1.20.20 | Schep et al.71 |
| ATACseq motif analysis | Motifmatchr v1.20.20 | Schep et al.71 |
Highlights.
T cell-specific deletion of CD137 limits the presence of CD8+ Tex cells in tumors
NF-κB-dependent CD137 signaling stimulates Tex cell proliferation and differentiation
CD137 activation drives the Tox-dependent epigenetic remodeling of Tex cell genes
Anti-PD1 efficacy is improved by subsequent CD137 stimulation
ACKNOWLEDGMENTS
We are grateful to the genotoul bioinformatics platform Toulouse Midi-Pyrenees. This work was granted access to the HPC resources of CALMIP supercomputing center under the allocation P19043. We thank Frédéric Pont, Laure Buisson, Manon Farcé, and the members from the CRCT, Infinity, and CRCL core facilities. This study has been supported by “la Fondation ARC” (PGA1–20160203788, 20180206911, 20190208630, and SIGN’IT2021); the “Institut National du Cancer” (INCA; PLBIO R16100BB, 2017–155, R19–045, R20–229); the “French National Research Agency” (ANR LABEX Toucan, AAPG 2021 R22057BB TRINDI and the EUR CARe N°ANR-18-EURE-0003); by Cancer Research Institute/Bristol-Myers Squibb CLIP grant; the Fondation Toulouse Cancer Santé; the IUCT-O translational research program; and the Intergroupe Francophone du Myélome (IFM). A.C.P. was supported by “la Ligue contre le cancer.” This work was supported in part by funding from the intramural program of NIAID, NIH.
APPENDIX
INCLUSION AND DIVERSITY
We support inclusive, diverse, and equitable conduct of research.
Footnotes
DECLARATION OF INTERESTS
The authors declare no competing interests.
SUPPLEMENTAL INFORMATION
Supplemental information can be found online at https://doi.org/10.1016/j.immuni.2023.06.007.
REFERENCES
- 1.Wherry EJ, and Kurachi M. (2015). Molecular and cellular insights into T cell exhaustion. Nat. Rev. Immunol 15, 486–499. 10.1038/nri3862. [DOI] [PMC free article] [PubMed] [Google Scholar]
- 2.Pauken KE, Sammons MA, Odorizzi PM, Manne S, Godec J, Khan O, Drake AM, Chen Z, Sen DR, Kurachi M, et al. (2016). Epigenetic stability of exhausted T cells limits durability of reinvigoration by PD-1 blockade. Science 354, 1160–1165. 10.1126/science.aaf2807. [DOI] [PMC free article] [PubMed] [Google Scholar]
- 3.Philip M, Fairchild L, Sun L, Horste EL, Camara S, Shakiba M, Scott AC, Viale A, Lauer P, Merghoub T, et al. (2017). Chromatin states define tumour-specific T cell dysfunction and reprogramming. Nature 545, 452–456. 10.1038/nature22367. [DOI] [PMC free article] [PubMed] [Google Scholar]
- 4.Sen DR, Kaminski J, Barnitz RA, Kurachi M, Gerdemann U, Yates KB, Tsao HW, Godec J, LaFleur MW, Brown FD, et al. (2016). The epigenetic landscape of T cell exhaustion. Science 354, 1165–1169. 10.1126/science.aae0491. [DOI] [PMC free article] [PubMed] [Google Scholar]
- 5.Thommen DS, and Schumacher TN (2018). T cell dysfunction in cancer. Cancer Cell 33, 547–562. 10.1016/j.ccell.2018.03.012. [DOI] [PMC free article] [PubMed] [Google Scholar]
- 6.Im SJ, Hashimoto M, Gerner MY, Lee J, Kissick HT, Burger MC, Shan Q, Hale JS, Lee J, Nasti TH, et al. (2016). Defining CD8+ T cells that provide the proliferative burst after PD-1 therapy. Nature 537, 417–421. 10.1038/nature19330. [DOI] [PMC free article] [PubMed] [Google Scholar]
- 7.Paley MA, Kroy DC, Odorizzi PM, Johnnidis JB, Dolfi DV, Barnett BE, Bikoff EK, Robertson EJ, Lauer GM, Reiner SL, and Wherry EJ (2012). Progenitor and terminal subsets of CD8+ T cells cooperate to contain chronic viral infection. Science 338, 1220–1225. 10.1126/science.1229620. [DOI] [PMC free article] [PubMed] [Google Scholar]
- 8.Utzschneider DT, Charmoy M, Chennupati V, Pousse L, Ferreira DP, Calderon-Copete S, Danilo M, Alfei F, Hofmann M, Wieland D, et al. (2016). T cell factor 1-expressing memory-like CD8(+) T cells sustain the immune response to chronic viral infections. Immunity 45, 415–427. 10.1016/j.immuni.2016.07.021. [DOI] [PubMed] [Google Scholar]
- 9.Wu T, Ji Y, Moseman EA, Xu HC, Manglani M, Kirby M, Anderson SM, Handon R, Kenyon E, Elkahloun A, et al. (2016). The TCF1-Bcl6 axis counteracts type I interferon to repress exhaustion and maintain T cell stemness. Sci. Immunol 1, eaai8593. 10.1126/sciimmunol.aai8593. [DOI] [PMC free article] [PubMed] [Google Scholar]
- 10.Chen Z, Ji Z, Ngiow SF, Manne S, Cai Z, Huang AC, Johnson J, Staupe RP, Bengsch B, Xu C, et al. (2019). TCF-1-Centered Transcriptional Network Drives an Effector versus Exhausted CD8 T cell-Fate Decision. Immunity 51, 840–855.e5. 10.1016/j.immuni.2019.09.013. [DOI] [PMC free article] [PubMed] [Google Scholar]
- 11.Khan O, Giles JR, McDonald S, Manne S, Ngiow SF, Patel KP, Werner MT, Huang AC, Alexander KA, Wu JE, et al. (2019). TOX transcriptionally and epigenetically programs CD8(+) T cell exhaustion. Nature 571, 211–218. 10.1038/s41586-019-1325-x. [DOI] [PMC free article] [PubMed] [Google Scholar]
- 12.Scott AC, Dundar €F, Zumbo P, Chandran SS, Klebanoff CA, Shakiba M, Trivedi P, Menocal L, Appleby H, Camara S, et al. (2019). TOX is a critical regulator of tumour-specific T cell differentiation. Nature 571, 270–274. 10.1038/s41586-019-1324-y. [DOI] [PMC free article] [PubMed] [Google Scholar]
- 13.Alfei F, Kanev K, Hofmann M, Wu M, Ghoneim HE, Roelli P, Utzschneider DT, von Hoesslin M, Cullen JG, Fan Y, et al. (2019). TOX reinforces the phenotype and longevity of exhausted T cells in chronic viral infection. Nature 571, 265–269. 10.1038/s41586-019-1326-9. [DOI] [PubMed] [Google Scholar]
- 14.Yates KB, Tonnerre P, Martin GE, Gerdemann U, Al Abosy R, Comstock DE, Weiss SA, Wolski D, Tully DC, Chung RT, et al. (2021). Epigenetic scars of CD8(+) T cell exhaustion persist after cure of chronic infection in humans. Nat. Immunol 22, 1020–1029. 10.1038/s41590-021-00979-1. [DOI] [PMC free article] [PubMed] [Google Scholar]
- 15.Yao C, Sun HW, Lacey NE, Ji Y, Moseman EA, Shih HY, Heuston EF, Kirby M, Anderson S, Cheng J, et al. (2019). Single-cell RNA-seq reveals TOX as a key regulator of CD8(+) T cell persistence in chronic infection. Nat. Immunol 20, 890–901. 10.1038/s41590-019-0403-4. [DOI] [PMC free article] [PubMed] [Google Scholar]
- 16.Blank CU, Haining WN, Held W, Hogan PG, Kallies A, Lugli E, Lynn RC, Philip M, Rao A, Restifo NP, et al. (2019). Defining ‘T cell exhaustion’. Nat. Rev. Immunol 19, 665–674. 10.1038/s41577-019-0221-9. [DOI] [PMC free article] [PubMed] [Google Scholar]
- 17.Brooks DG, Ha SJ, Elsaesser H, Sharpe AH, Freeman GJ, and Oldstone MB (2008). IL-10 and PD-L1 operate through distinct path-ways to suppress T-cell activity during persistent viral infection. Proc. Natl. Acad. Sci. USA 105, 20428–20433. 10.1073/pnas.0811139106. [DOI] [PMC free article] [PubMed] [Google Scholar]
- 18.Tinoco R, Alcalde V, Yang Y, Sauer K, and Zuniga EI (2009). Cell-intrinsic transforming growth factor-beta signaling mediates virus-specific CD8+ T cell deletion and viral persistence in vivo. Immunity 31, 145–157. 10.1016/j.immuni.2009.06.015. [DOI] [PMC free article] [PubMed] [Google Scholar]
- 19.Chihara N, Madi A, Kondo T, Zhang H, Acharya N, Singer M, Nyman J, Marjanovic ND, Kowalczyk MS, Wang C, et al. (2018). Induction and transcriptional regulation of the co-inhibitory gene module in T cells. Nature 558, 454–459. 10.1038/s41586-018-0206-z. [DOI] [PMC free article] [PubMed] [Google Scholar]
- 20.Robert C, Thomas L, Bondarenko I, O’Day S, Weber J, Garbe C, Lebbe C, Baurain JF, Testori A, Grob JJ, et al. (2011). Ipilimumab plus dacarbazine for previously untreated metastatic melanoma. N. Engl. J. Med 364, 2517–2526. 10.1056/NEJMoa1104621. [DOI] [PubMed] [Google Scholar]
- 21.Topalian SL, Hodi FS, Brahmer JR, Gettinger SN, Smith DC, McDermott DF, Powderly JD, Carvajal RD, Sosman JA, Atkins MB, et al. (2012). Safety, activity, and immune correlates of anti-PD-1 antibody in cancer. N. Engl. J. Med 366, 2443–2454. 10.1056/NEJMoa1200690. [DOI] [PMC free article] [PubMed] [Google Scholar]
- 22.Thommen DS, Koelzer VH, Herzig P, Roller A, Trefny M, Dimeloe S, Kiialainen A, Hanhart J, Schill C, Hess C, et al. (2018). A transcriptionally and functionally distinct PD-1(+) CD8(+) T cell pool with predictive potential in non-small-cell lung cancer treated with PD-1 blockade. Nat. Med 24, 994–1004. 10.1038/s41591-018-0057-z. [DOI] [PMC free article] [PubMed] [Google Scholar]
- 23.Kurtulus S, Madi A, Escobar G, Klapholz M, Nyman J, Christian E, Pawlak M, Dionne D, Xia J, Rozenblatt-Rosen O, et al. (2019). Checkpoint blockade immunotherapy induces dynamic changes in PD-1(−)CD8(+) tumor-infiltrating T cells. Immunity 50, 181–194.e6. 10.1016/j.immuni.2018.11.014. [DOI] [PMC free article] [PubMed] [Google Scholar]
- 24.Weulersse M, Asrir A, Pichler AC, Lemaitre L, Braun M, Carrié N, Joubert MV, Le Moine M, Do Souto L, Gaud G, et al. (2020). Eomes-dependent loss of the co-activating receptor CD226 restrains CD8(+) T cell anti-tumor functions and limits the efficacy of cancer immunotherapy. Immunity 53, 824–839.e10. 10.1016/j.immuni.2020.09.006. [DOI] [PubMed] [Google Scholar]
- 25.Braun M, Aguilera AR, Sundarrajan A, Corvino D, Stannard K, Krumeich S, Das I, Lima LG, Meza Guzman LG, Li K, et al. (2020). CD155 on tumor cells drives resistance to immunotherapy by inducing the degradation of the activating receptor CD226 in CD8(+) T cells. Immunity 53, 805–823.e15. 10.1016/j.immuni.2020.09.010. [DOI] [PubMed] [Google Scholar]
- 26.Banta KL, Xu X, Chitre AS, Au-Yeung A, Takahashi C, O’Gorman WE, Wu TD, Mittman S, Cubas R, Comps-Agrar L, et al. (2022). Mechanistic convergence of the TIGIT and PD-1 inhibitory pathways necessitates co-blockade to optimize anti-tumor CD8(+) T cell responses. Immunity 55, 512–526.e9. 10.1016/j.immuni.2022.02.005. [DOI] [PMC free article] [PubMed] [Google Scholar]
- 27.Melero I, Hirschhorn-Cymerman D, Morales-Kastresana A, Sanmamed MF, and Wolchok JD (2013). Agonist antibodies to TNFR molecules that costimulate T and NK cells. Clin. Cancer Res 19, 1044–1053. 10.1158/1078-0432.CCR-12-2065. [DOI] [PMC free article] [PubMed] [Google Scholar]
- 28.Hurtado JC, Kim YJ, and Kwon BS (1997). Signals through 4–1BB are costimulatory to previously activated splenic T cells and inhibit activation-induced cell death. J. Immunol 158, 2600–2609. [PubMed] [Google Scholar]
- 29.Wilcox RA, Flies DB, Zhu G, Johnson AJ, Tamada K, Chapoval AI, Strome SE, Pease LR, and Chen L. (2002). Provision of antigen and CD137 signaling breaks immunological ignorance, promoting regression of poorly immunogenic tumors. J. Clin. Invest 109, 651–659. 10.1172/JCI14184. [DOI] [PMC free article] [PubMed] [Google Scholar]
- 30.Shuford WW, Klussman K, Tritchler DD, Loo DT, Chalupny J, Siadak AW, Brown TJ, Emswiler J, Raecho H, Larsen CP, et al. (1997). 4–1BB costimulatory signals preferentially induce CD8+ T cell proliferation and lead to the amplification in vivo of cytotoxic T cell responses. J. Exp. Med 186, 47–55. 10.1084/jem.186.1.47. [DOI] [PMC free article] [PubMed] [Google Scholar]
- 31.Melero I, Shuford WW, Newby SA, Aruffo A, Ledbetter JA, Hellström KE, Mittler RS, and Chen L. (1997). Monoclonal antibodies against the 4–1BB T-cell activation molecule eradicate established tumors. Nat. Med 3, 682–685. 10.1038/nm0697-682. [DOI] [PubMed] [Google Scholar]
- 32.Zhu Y, Zhu G, Luo L, Flies AS, and Chen L. (2007). CD137 stimulation delivers an antigen-independent growth signal for T lymphocytes with memory phenotype. Blood 109, 4882–4889. 10.1182/blood-2006-10-043463. [DOI] [PMC free article] [PubMed] [Google Scholar]
- 33.Guillerey C, Ferrari de Andrade L, Vuckovic S, Miles K, Ngiow SF, Yong MCR, Teng MWL, Colonna M, Ritchie DS, Chesi M, et al. (2015). Immunosurveillance and therapy of multiple myeloma are CD226 dependent. J. Clin. Invest 125, 2077–2089. 10.1172/JCI77181. [DOI] [PMC free article] [PubMed] [Google Scholar]
- 34.Segal NH, Logan TF, Hodi FS, McDermott D, Melero I, Hamid O, Schmidt H, Robert C, Chiarion-Sileni V, Ascierto PA, et al. (2017). Results from an integrated safety analysis of urelumab, an agonist anti-CD137 monoclonal antibody. Clin. Cancer Res 23, 1929–1936. 10.1158/1078-0432.CCR-16-1272. [DOI] [PubMed] [Google Scholar]
- 35.Chester C, Sanmamed MF, Wang J, and Melero I. (2018). Immunotherapy targeting 4–1BB: mechanistic rationale, clinical results, and future strategies. Blood 131, 49–57. 10.1182/blood-2017-06-741041. [DOI] [PubMed] [Google Scholar]
- 36.Seo SK, Choi JH, Kim YH, Kang WJ, Park HY, Suh JH, Choi BK, Vinay DS, and Kwon BS (2004). 4–1BB-mediated immunotherapy of rheumatoid arthritis. Nat. Med 10, 1088–1094. 10.1038/nm1107. [DOI] [PubMed] [Google Scholar]
- 37.Choi BK, Asai T, Vinay DS, Kim YH, and Kwon BS (2006). 4–1BB-mediated amelioration of experimental autoimmune uveoretinitis is caused by indoleamine 2,3-dioxygenase-dependent mechanisms. Cytokine 34, 233–242. 10.1016/j.cyto.2006.04.008. [DOI] [PubMed] [Google Scholar]
- 38.Sun Y, Lin X, Chen HM, Wu Q, Subudhi SK, Chen L, and Fu YX (2002). Administration of agonistic anti-4–1BB monoclonal antibody leads to the amelioration of experimental autoimmune encephalomyelitis. J. Immunol 168, 1457–1465. 10.4049/jimmunol.168.3.1457. [DOI] [PubMed] [Google Scholar]
- 39.Foell J, Strahotin S, O’Neil SP, McCausland MM, Suwyn C, Haber M, Chander PN, Bapat AS, Yan XJ, Chiorazzi N, et al. (2003). CD137 costimulatory T cell receptor engagement reverses acute disease in lupus-prone NZB x NZW F1 mice. J. Clin. Invest 111, 1505–1518. 10.1172/JCI17662. [DOI] [PMC free article] [PubMed] [Google Scholar]
- 40.Bengsch B, Ohtani T, Khan O, Setty M, Manne S, O’Brien S, Gherardini PF, Herati RS, Huang AC, Chang KM, et al. (2018). Epigenomic-guided mass cytometry profiling reveals disease-specific features of exhausted CD8 T cells. Immunity 48, 1029–1045.e5. 10.1016/j.immuni.2018.04.026. [DOI] [PMC free article] [PubMed] [Google Scholar]
- 41.Miller BC, Sen DR, Al Abosy R, Bi K, Virkud YV, LaFleur MW, Yates KB, Lako A, Felt K, Naik GS, et al. (2019). Subsets of exhausted CD8(+) T cells differentially mediate tumor control and respond to checkpoint blockade. Nat. Immunol 20, 326–336. 10.1038/s41590-019-0312-6. [DOI] [PMC free article] [PubMed] [Google Scholar]
- 42.Aoki T, Chong LC, Takata K, Milne K, Hav M, Colombo A, Chavez EA, Nissen M, Wang X, Miyata-Takata T, et al. (2020). Single-cell transcriptome analysis reveals disease-defining T-cell subsets in the tumor microenvironment of classic Hodgkin lymphoma. Cancer Discov. 10, 406–421. 10.1158/2159-8290.CD-19-0680. [DOI] [PubMed] [Google Scholar]
- 43.Azizi E, Carr AJ, Plitas G, Cornish AE, Konopacki C, Prabhakaran S, Nainys J, Wu K, Kiseliovas V, Setty M, et al. (2018). Single-cell map of diverse immune phenotypes in the breast tumor microenvironment. Cell 174, 1293–1308.e36. 10.1016/j.cell.2018.05.060. [DOI] [PMC free article] [PubMed] [Google Scholar]
- 44.Guo X, Zhang Y, Zheng L, Zheng C, Song J, Zhang Q, Kang B, Liu Z, Jin L, Xing R, et al. (2018). Global characterization of T cells in non-small-cell lung cancer by single-cell sequencing. Nat. Med 24, 978–985. 10.1038/s41591-018-0045-3. [DOI] [PubMed] [Google Scholar]
- 45.Sade-Feldman M, Yizhak K, Bjorgaard SL, Ray JP, de Boer CG, Jenkins RW, Lieb DJ, Chen JH, Frederick DT, Barzily-Rokni M, et al. (2018). Defining T cell states associated with response to check-point immunotherapy in melanoma. Cell 175, 998–1013.e20. 10.1016/j.cell.2018.10.038. [DOI] [PMC free article] [PubMed] [Google Scholar]
- 46.Zheng C, Zheng L, Yoo JK, Guo H, Zhang Y, Guo X, Kang B, Hu R, Huang JY, Zhang Q, et al. (2017). Landscape of infiltrating T cells in liver cancer revealed by single-cell sequencing. Cell 169, 1342–1356.e16. 10.1016/j.cell.2017.05.035. [DOI] [PubMed] [Google Scholar]
- 47.Lucca LE, Axisa PP, Lu B, Harnett B, Jessel S, Zhang L, Raddassi K, Zhang L, Olino K, Clune J, et al. (2021). Circulating clonally expanded T cells reflect functions of tumor-infiltrating T cells. J. Exp. Med 218, e20200921. 10.1084/jem.20200921. [DOI] [PMC free article] [PubMed] [Google Scholar]
- 48.Bassez A, Vos H, Van Dyck L, Floris G, Arijs I, Desmedt C, Boeckx B, Vanden Bempt M, Nevelsteen I, Lambein K, et al. (2021). A single-cell map of intratumoral changes during anti-PD1 treatment of patients with breast cancer. Nat. Med 27, 820–832. 10.1038/s41591-021-01323-8. [DOI] [PubMed] [Google Scholar]
- 49.van der Leun AM, Thommen DS, and Schumacher TN (2020). CD8(+) T cell states in human cancer: insights from single-cell analysis. Nat. Rev. Cancer 20, 218–232. 10.1038/s41568-019-0235-4. [DOI] [PMC free article] [PubMed] [Google Scholar]
- 50.Siddiqui I, Schaeuble K, Chennupati V, Fuertes Marraco SA, Calderon-Copete S, Pais Ferreira D, Carmona SJ, Scarpellino L, Gfeller D, Pradervand S, et al. (2019). Intratumoral Tcf1(+)PD-1(+) CD8(+) T cells with stem-like properties promote tumor control in response to vaccination and checkpoint blockade immunotherapy. Immunity 50. 195–211.e10 e110. 10.1016/j.immuni.2018.12.021. [DOI] [PubMed] [Google Scholar]
- 51.Utzschneider DT, Gabriel SS, Chisanga D, Gloury R, Gubser PM, Vasanthakumar A, Shi W, and Kallies A. (2020). Early precursor T cells establish and propagate T cell exhaustion in chronic infection. Nat. Immunol 21, 1256–1266. 10.1038/s41590-020-0760-z. [DOI] [PubMed] [Google Scholar]
- 52.Giles JR, Ngiow SF, Manne S, Baxter AE, Khan O, Wang P, Staupe R, Abdel-Hakeem MS, Huang H, Mathew D, et al. (2022). Shared and distinct biological circuits in effector, memory and exhausted CD8(+) T cells revealed by temporal single-cell transcriptomics and epigenetics. Nat. Immunol 23, 1600–1613. 10.1038/s41590-022-01338-4. [DOI] [PMC free article] [PubMed] [Google Scholar]
- 53.Guillerey C, Harjunpää H, Carrié N, Kassem S, Teo T, Miles K, Krumeich S, Weulersse M, Cuisinier M, Stannard K, et al. (2018). TIGIT immune checkpoint blockade restores CD8(+) T-cell immunity against multiple myeloma. Blood 132, 1689–1694. 10.1182/blood-2018-01-825265. [DOI] [PubMed] [Google Scholar]
- 54.Qi X, Li F, Wu Y, Cheng C, Han P, Wang J, and Yang X. (2019). Optimization of 4–1BB antibody for cancer immunotherapy by balancing agonistic strength with FcgammaR affinity. Nat. Commun 10, 2141. 10.1038/s41467-019-10088-1. [DOI] [PMC free article] [PubMed] [Google Scholar]
- 55.Lee HW, Park SJ, Choi BK, Kim HH, Nam KO, and Kwon BS (2002). 4–1BB promotes the survival of CD8+ T lymphocytes by increasing expression of Bcl-xL and Bfl-1. J. Immunol 169, 4882–4888. [DOI] [PubMed] [Google Scholar]
- 56.Sabbagh L, Andreeva D, Laramée GD, Oussa NA, Lew D, Bisson N, Soumounou Y, Pawson T, and Watts TH (2013). Leukocyte-specific protein 1 links TNF receptor-associated factor 1 to survival signaling downstream of 4–1BB in T cells. J. Leukoc. Biol 93, 713–721. 10.1189/jlb.1112579. [DOI] [PubMed] [Google Scholar]
- 57.Lages CS, Lewkowich I, Sproles A, Wills-Karp M, and Chougnet C. (2010). Partial restoration of T-cell function in aged mice by in vitro blockade of the PD-1/PD-L1 pathway. Aging Cell 9, 785–798. 10.1111/j.1474-9726.2010.00611.x. [DOI] [PMC free article] [PubMed] [Google Scholar]
- 58.Lee KA, Shin KS, Kim GY, Song YC, Bae EA, Kim IK, Koh CH, and Kang CY (2016). Characterization of age-associated exhausted CD8(+) T cells defined by increased expression of Tim-3 and PD-1. Aging Cell 15, 291–300. 10.1111/acel.12435. [DOI] [PMC free article] [PubMed] [Google Scholar]
- 59.Garcia MG, Deng Y, Murray C, Reyes RM, Padron A, Bai H, Kancharla A, Gupta H, Shen-Orr S, and Curiel TJ (2022). Immune checkpoint expression and relationships to anti-PD-L1 immune check-point blockade cancer immunotherapy efficacy in aged versus young mice. Aging Cancer 3, 68–83. 10.1002/aac2.12045. [DOI] [PMC free article] [PubMed] [Google Scholar]
- 60.Martinez GJ, Pereira RM, Aijö T, Kim EY, Marangoni F, Pipkin ME, Togher S, Heissmeyer V, Zhang YC, Crotty S, et al. (2015). The transcription factor NFAT promotes exhaustion of activated CD8(+) T cells. Immunity 42, 265–278. 10.1016/j.immuni.2015.01.006. [DOI] [PMC free article] [PubMed] [Google Scholar]
- 61.Moran AE, Holzapfel KL, Xing Y, Cunningham NR, Maltzman JS, Punt J, and Hogquist KA (2011). T cell receptor signal strength in Treg and iNKT cell development demonstrated by a novel fluorescent reporter mouse. J. Exp. Med 208, 1279–1289. 10.1084/jem.20110308. [DOI] [PMC free article] [PubMed] [Google Scholar]
- 62.Borcherding N, Bormann NL, and Kraus G. (2020). scRepertoire: an R-based toolkit for single-cell immune receptor analysis. F1000Res 9, 47. 10.12688/f1000research.22139.2. [DOI] [PMC free article] [PubMed] [Google Scholar]
- 63.Zhang L, Yu X, Zheng L, Zhang Y, Li Y, Fang Q, Gao R, Kang B, Zhang Q, Huang JY, et al. (2018). Lineage tracking reveals dynamic relationships of T cells in colorectal cancer. Nature 564, 268–272. 10.1038/s41586-018-0694-x. [DOI] [PubMed] [Google Scholar]
- 64.Maurice NJ, Berner J, Taber AK, Zehn D, and Prlic M. (2021). Inflammatory signals are sufficient to elicit TOX expression in mouse and human CD8+ T cells. JCI Insight 6, e150744. 10.1172/jci.insight.150744. [DOI] [PMC free article] [PubMed] [Google Scholar]
- 65.Zapata JM, Perez-Chacon G, Carr-Baena P, Martinez-Forero I, Azpilikueta A, Otano I, and Melero I. (2018). CD137 (4–1BB) signalosome: complexity is a matter of TRAFs. Front. Immunol 9, 2618. 10.3389/fimmu.2018.02618. [DOI] [PMC free article] [PubMed] [Google Scholar]
- 66.Grinberg-Bleyer Y, Oh H, Desrichard A, Bhatt DM, Caron R, Chan TA, Schmid RM, Klein U, Hayden MS, and Ghosh S. (2017). NF-kappaB c-Rel is crucial for the regulatory T cell immune checkpoint in cancer. Cell 170, 1096–1108.e13. 10.1016/j.cell.2017.08.004. [DOI] [PMC free article] [PubMed] [Google Scholar]
- 67.Oh H, Grinberg-Bleyer Y, Liao W, Maloney D, Wang P, Wu Z, Wang J, Bhatt DM, Heise N, Schmid RM, et al. (2017). An NF-kappaB transcription-factor-dependent lineage-specific transcriptional program promotes regulatory T cell identity and function. Immunity 47, 450–465.e5. 10.1016/j.immuni.2017.08.010. [DOI] [PMC free article] [PubMed] [Google Scholar]
- 68.Lalle G, Lautraite R, Voisin A, Twardowski J, Stéphan P, Perrin-Niquet M, Igalouzene R, Soudja SM, Marie JC, Vocanson M, et al. (2021). A T cell-intrinsic function for NF-kappaB RelB in experimental autoimmune encephalomyelitis. Sci. Rep 11, 19674. 10.1038/s41598-021-99134-x. [DOI] [PMC free article] [PubMed] [Google Scholar]
- 69.Mognol GP, Spreafico R, Wong V, Scott-Browne JP, Togher S, Hoffmann A, Hogan PG, Rao A, and Trifari S. (2017). Exhaustion-associated regulatory regions in CD8(+) tumor-infiltrating T cells. Proc. Natl. Acad. Sci. USA 114, E2776–E2785. 10.1073/pnas.1620498114. [DOI] [PMC free article] [PubMed] [Google Scholar]
- 70.Scott-Browne JP, López-Moyado IF, Trifari S, Wong V, Chavez L, Rao A, and Pereira RM (2016). Dynamic changes in chromatin accessibility occur in CD8(+) T cells responding to viral. Immunity 45, 1327–1340. 10.1016/j.immuni.2016.10.028. [DOI] [PMC free article] [PubMed] [Google Scholar]
- 71.Schep AN, Wu B, Buenrostro JD, and Greenleaf WJ (2017). chromVAR: inferring transcription-factor-associated accessibility from single-cell epigenomic data. Nat. Methods 14, 975–978. 10.1038/nmeth.4401. [DOI] [PMC free article] [PubMed] [Google Scholar]
- 72.Asrir A, Tardiveau C, Coudert J, Laffont R, Blanchard L, Bellard E, Veerman K, Bettini S, Lafouresse F, Vina E, et al. (2022). Tumor-associated high endothelial venules mediate lymphocyte entry into tumors and predict response to PD-1 plus CTLA-4 combination immuno-therapy. Cancer Cell 40, 318–334.e9. 10.1016/j.ccell.2022.01.002. [DOI] [PubMed] [Google Scholar]
- 73.Guillerey C, Nakamura K, Pichler AC, Barkauskas D, Krumeich S, Stannard K, Miles K, Harjunpää H, Yu Y, Casey M, et al. (2019). Chemotherapy followed by anti-CD137 mAb immunotherapy improves disease control in a mouse myeloma model. JCI Insight 5, e125932. 10.1172/jci.insight.125932. [DOI] [PMC free article] [PubMed] [Google Scholar]
- 74.Bucks CM, Norton JA, Boesteanu AC, Mueller YM, and Katsikis PD (2009). Chronic antigen stimulation alone is sufficient to drive CD8+ T cell exhaustion. J. Immunol 182, 6697–6708. 10.4049/jimmunol.0800997. [DOI] [PMC free article] [PubMed] [Google Scholar]
- 75.Ward-Kavanagh LK, Lin WW, Šedý JR, and Ware CF (2016). The TNF receptor superfamily in co-stimulating and co-inhibitory responses. Immunity 44, 1005–1019. 10.1016/j.immuni.2016.04.019. [DOI] [PMC free article] [PubMed] [Google Scholar]
- 76.Pulle G, Vidric M, and Watts TH (2006). IL-15-dependent induction of 4–1BB promotes antigen-independent CD8 memory T cell survival. J. Immunol 176, 2739–2748. 10.4049/jimmunol.176.5.2739. [DOI] [PubMed] [Google Scholar]
- 77.Lin GH, Snell LM, Wortzman ME, Clouthier DL, and Watts TH (2013). GITR-dependent regulation of 4–1BB expression: implications for T cell memory and anti-4–1BB-induced pathology. J. Immunol 190, 4627–4639. 10.4049/jimmunol.1201854. [DOI] [PubMed] [Google Scholar]
- 78.Palazón A, Martínez-Forero I, Teijeira A, Morales-Kastresana A, Alfaro C, Sanmamed MF, Perez-Gracia JL, Peñuelas I, Hervás-Stubbs S, Rouzaut A, et al. (2012). The HIF-1alpha hypoxia response in tumor-infiltrating T lymphocytes induces functional CD137 (4–1BB) for immunotherapy. Cancer Discov. 2, 608–623. 10.1158/2159-8290.CD-11-0314. [DOI] [PubMed] [Google Scholar]
- 79.Cai C, Samir J, Pirozyan MR, Adikari TN, Gupta M, Leung P, Hughes B, Van der Byl W, Rizzetto S, Elthala A, et al. (2022). Identification of human progenitors of exhausted CD8(+) T cells associ-ated with elevated IFN-gamma response in early phase of viral infection. Nat. Commun 13, 7543. 10.1038/s41467-022-35281-7. [DOI] [PMC free article] [PubMed] [Google Scholar]
- 80.Galletti G, De Simone G, Mazza EMC, Puccio S, Mezzanotte C, Bi TM, Davydov AN, Metsger M, Scamardella E, Alvisi G, et al. (2020). Two subsets of stem-like CD8(+) memory T cell progenitors with distinct fate commitments in humans. Nat. Immunol 21, 1552–1562. 10.1038/s41590-020-0791-5. [DOI] [PMC free article] [PubMed] [Google Scholar]
- 81.Hensel N, Gu Z, Sagar X, Wieland D, Jechow K, Kemming J, Llewellyn-Lacey S, Gostick E, Sogukpinar O, Emmerich F, et al. (2021). Memory-like HCV-specific CD8(+) T cells retain a molecular scar after cure of chronic HCV infection. Nat. Immunol 22, 229–239. 10.1038/s41590-020-00817-w. [DOI] [PubMed] [Google Scholar]
- 82.Etxeberria I, Bolaños E, Teijeira A, Garasa S, Yanguas A, Azpilikueta A, Kavanaugh WM, Vasiljeva O, Belvin M, Howng B, et al. (2021). Antitumor efficacy and reduced toxicity using an anti-CD137 Probody therapeutic. Proc. Natl. Acad. Sci. USA 118, e2025930118. 10.1073/pnas.2025930118. [DOI] [PMC free article] [PubMed] [Google Scholar]
- 83.Geuijen C, Tacken P, Wang LC, Klooster R, van Loo PF, Zhou J, Mondal A, Liu YB, Kramer A, Condamine T, et al. (2021). A human CD137xPD-L1 bispecific antibody promotes anti-tumor immunity via context-dependent T cell costimulation and checkpoint blockade. Nat. Commun 12, 4445. 10.1038/s41467-021-24767-5. [DOI] [PMC free article] [PubMed] [Google Scholar]
- 84.Schmitz JE, Kuroda MJ, Santra S, Sasseville VG, Simon MA, Lifton MA, Racz P, Tenner-Racz K, Dalesandro M, Scallon BJ, et al. (1999). Control of viremia in simian immunodeficiency virus infection by CD8+ lymphocytes. Science 283, 857–860. 10.1126/science.283.5403.857. [DOI] [PubMed] [Google Scholar]
- 85.Yost KE, Satpathy AT, Wells DK, Qi Y, Wang C, Kageyama R, McNamara KL, Granja JM, Sarin KY, Brown RA, et al. (2019). Clonal replacement of tumor-specific T cells following PD-1 blockade. Nat. Med 25, 1251–1259. 10.1038/s41591-019-0522-3. [DOI] [PMC free article] [PubMed] [Google Scholar]
- 86.Salih HR, Kosowski SG, Haluska VF, Starling GC, Loo DT, Lee F, Aruffo AA, Trail PA, and Kiener PA (2000). Constitutive expression of functional 4–1BB (CD137) ligand on carcinoma cells. J. Immunol 165, 2903–2910. 10.4049/jimmunol.165.5.2903. [DOI] [PubMed] [Google Scholar]
- 87.Porgador A, Feldman M, and Eisenbach L. (1989). H-2Kb transfection of B16 melanoma cells results in reduced tumourigenicity and metastatic competence. J. Immunogenet 16, 291–303. 10.1111/j.1744-313x.1989.tb00475.x. [DOI] [PubMed] [Google Scholar]
- 88.Trimaglio G, Tilkin-Mariamé A-F, Feliu V, Lauzéral-Vizcaino F, Tosolini M, Valle C, Ayyoub M, Neyrolles O, Vergnolle N, Rombouts Y, et al. (2020). Colon-specific immune microenvironment regulates cancer progression versus rejection. OncoImmunology 9. 10.1080/2162402X.2020.1790125. [DOI] [PMC free article] [PubMed] [Google Scholar]
- 89.Chesi M, Matthews GM, Garbitt VM, Palmer SE, Shortt J, Lefebure M, Stewart AK, Johnstone RW, and Bergsagel PL (2012). Drug response in a genetically engineered mouse model of multiple myeloma is predictive of clinical efficacy. Blood 120, 376–385. 10.1182/blood-2012-02-412783. [DOI] [PMC free article] [PubMed] [Google Scholar]
- 90.Nakamura K, Kassem S, Cleynen A, Chrétien M-L, Guillerey C, Putz EM, Bald T, Förster I, Vuckovic S, Hill GR, et al. (2018). Dysregulated IL-18 Is a Key Driver of Immunosuppression and a Possible Therapeutic Target in the Multiple Myeloma Microenvironment. Cancer Cell 33, 634–648.e5. 10.1016/j.ccell.2018.02.007. [DOI] [PubMed] [Google Scholar]
- 91.Dobin A, Davis CA, Schlesinger F, Drenkow J, Zaleski C, Jha S, Batut P, Chaisson M, and Gingeras TR (2013). STAR: ultrafast universal RNA-seq aligner. Bioinformatics 29, 15–21. 10.1093/bioinformatics/bts635. [DOI] [PMC free article] [PubMed] [Google Scholar]
- 92.Liao Y, Smyth GK, and Shi W. (2014). featureCounts: an efficient general purpose program for assigning sequence reads to genomic features. Bioinformatics 30, 923–930. 10.1093/bioinformatics/btt656. [DOI] [PubMed] [Google Scholar]
- 93.Ritchie ME, Phipson B, Wu D, Hu Y, Law CW, Shi W, and Smyth GK (2015). limma powers differential expression analyses for RNA-sequencing and microarray studies. Nucleic Acids Research 43, e47. 10.1093/nar/gkv007. [DOI] [PMC free article] [PubMed] [Google Scholar]
- 94.Polit L, Kerdivel G, Gregoricchio S, Esposito M, Guillouf C, and Boeva V. (2021). CHIPIN: ChIP-seq inter-sample normalization based on signal invariance across transcriptionally constant genes. BMC Bioinformatics 22, 407. 10.1186/s12859-021-04320-3. [DOI] [PMC free article] [PubMed] [Google Scholar]
- 95.Love MI, Huber W, and Anders S. (2014). Moderated estimation of fold change and dispersion for RNA-seq data with DESeq2. Genome Biol. 15, 550. 10.1186/s13059-014-0550-8. [DOI] [PMC free article] [PubMed] [Google Scholar]
- 96.Chesi M, Robbiani DF, Sebag M, Chng WJ, Affer M, Tiedemann R, Valdez R, Palmer SE, Haas SS, Stewart AK, et al. (2008). AID-dependent activation of a MYC transgene induces multiple myeloma in a conditional mouse model of post-germinal center malignancies. Cancer Cell 13, 167–180. 10.1016/j.ccr.2008.01.007. [DOI] [PMC free article] [PubMed] [Google Scholar]
- 97.Adoue V, Binet B, Malbec A, Fourquet J, Romagnoli P, van Meerwijk JPM, Amigorena S, and Joffre OP (2019). The histone methyltransferase SETDB1 controls T helper cell lineage integrity by repressing endogenous retroviruses. Immunity 50, 629–644.e8. 10.1016/j.immuni.2019.01.003. [DOI] [PubMed] [Google Scholar]
- 98.Stoeckius M, Hafemeister C, Stephenson W, Houck-Loomis B, Chattopadhyay PK, Swerdlow H, Satija R, and Smibert P. (2017). Simultaneous epitope and transcriptome measurement in single cells. Nat. Methods 14, 865–868. 10.1038/nmeth.4380. [DOI] [PMC free article] [PubMed] [Google Scholar]
- 99.Pont F, Tosolini M, and Fournié JJ (2019). Single-Cell Signature Explorer for comprehensive visualization of single cell signatures across scRNA-seq datasets. Nucleic Acids Res. 47, e133. 10.1093/nar/gkz601. [DOI] [PMC free article] [PubMed] [Google Scholar]
- 100.Liberzon A, Birger C, Thorvaldsdóttir H, Ghandi M, Mesirov JP, and Tamayo P. (2015). The Molecular Signatures Database (MSigDB) hallmark gene set collection. Cell Syst. 1, 417–425. 10.1016/j.cels.2015.12.004. [DOI] [PMC free article] [PubMed] [Google Scholar]
- 101.Burkhardt DB, Stanley JS 3rd, Tong A, Perdigoto AL, Gigante SA, Herold KC, Wolf G, Giraldez AJ, van Dijk D, and Krishnaswamy S. (2021). Quantifying the effect of experimental perturbations at single-cell resolution. Nat. Biotechnol 39, 619–629. 10.1038/s41587-020-00803-5. [DOI] [PMC free article] [PubMed] [Google Scholar]
- 102.Lopez-Delisle L, Rabbani L, Wolff J, Bhardwaj V, Backofen R, Grüning B, Ramírez F, and Manke T. (2021). pyGenomeTracks: reproducible plots for multivariate genomic datasets. Bioinformatics 37, 422–423. 10.1093/bioinformatics/btaa692. [DOI] [PMC free article] [PubMed] [Google Scholar]
- 103.Krämer A, Green J, Pollard J Jr., and Tugendreich S. (2014). Causal analysis approaches in Ingenuity Pathway Analysis. Bioinformatics 30, 523–530. 10.1093/bioinformatics/btt703. [DOI] [PMC free article] [PubMed] [Google Scholar]
- 104.Fornes O, Castro-Mondragon JA, Khan A, van der Lee R, Zhang X, Richmond PA, Modi BP, Correard S, Gheorghe M, Baranašić D, et al. (2020). JASPAR 2020: update of the open-access database of transcription factor binding profiles. Nucleic Acids Res. 48, D87–D92. 10.1093/nar/gkz1001. [DOI] [PMC free article] [PubMed] [Google Scholar]
Associated Data
This section collects any data citations, data availability statements, or supplementary materials included in this article.
Supplementary Materials
Data Availability Statement
The datasets in this publication have been deposited in NCBI’s Gene Expression Omnibus and are accessible through GEO Series accession numbers GSE205702, GSE205703, GSE230626, and GSE228271. All analyses were done with custom R scripts and are available upon request using standard R packages. No new algorithms were developed during this study.