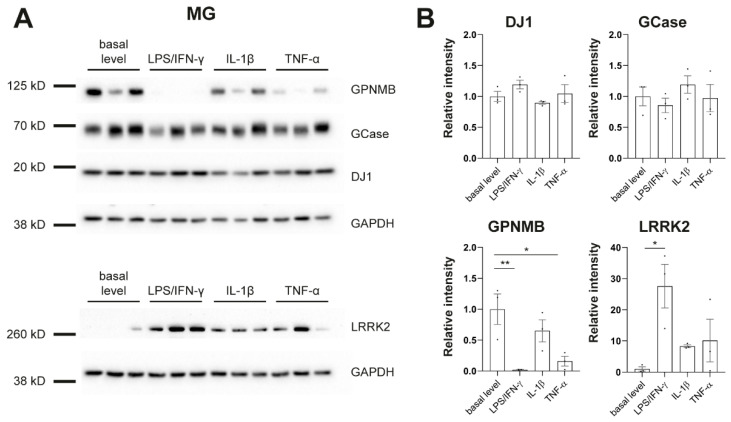
Figure 4.
Protein levels of PD-linked genes in response to inflammatory stimulation. (A) Western blot analysis shows protein levels of β-glucocerebrosidase (GCase), DJ-1, glycoprotein nonmetastatic melanoma protein b (GPNMB), Leucine-rich repeat kinase 2 (LRRK2), and GAPDH in microglia (MG). (B) Signal intensities were normalized to GAPDH. Protein pellets were taken from differentiation experiments of three healthy controls: SFC086-03-03, SFC089-03-07, and SCF156-03-01. Mean ± SEM. Asterisks indicate significant difference between basal level and stimulated cultures by one-way ANOVA followed by Dunnett’s multiple comparisons test (* p < 0.05, ** p < 0.01). Whole Western blots are shown in Figure S4.

