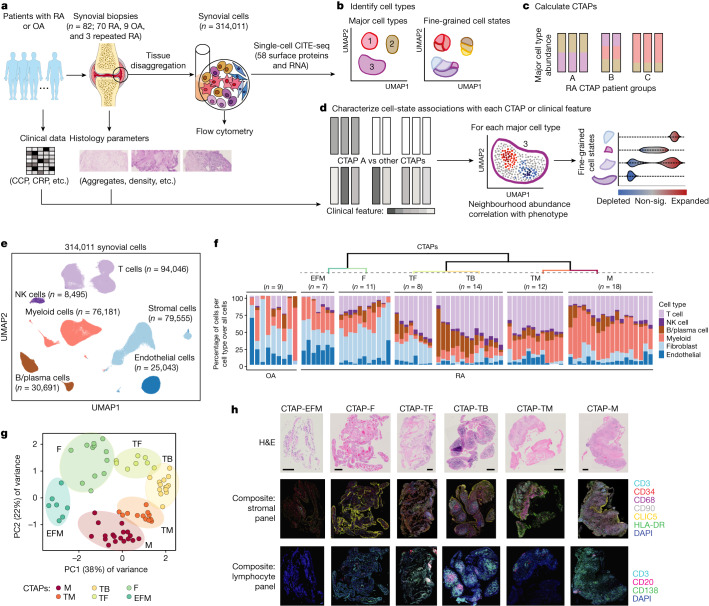
Fig. 1. Overview of the multi-modal single-cell synovial tissue pipeline and cell-type abundance analysis that reveals distinct rheumatoid arthritis CTAPs.
a–d, Description (a) of the patient recruitment, clinical and histologic metrics, synovial sample processing pipeline and computational analysis strategy, including identification of major cell types and fine-grained cell states (b), definition of distinct rheumatoid arthritis CTAPs (c), and cell neighbourhood associations with each CTAP or with clinical or histologic parameters for each major cell type (d). OA, osteoarthritis; RA, rheumatoid arthritis; sig., significant. e, Integrative uniform manifold approximation and projection (UMAP) based on mRNA and protein discriminated major cell types, f, Hierarchical clustering of cell-type abundances captures six rheumatoid arthritis subgroups, referred to as CTAPs. The nine osteoarthritis samples are shown as a comparison. Each bar represents one synovial sample, coloured by the proportion of each major cell type. g, PCA of major cell-type abundances. Each dot represents a sample, plotted based on its PC1 and PC2 projections and coloured by CTAPs. h, Representative synovial tissue fragments from each of the CTAPs. Top row, haematoxylin and eosin (H&E) staining. Middle row, immunofluorescence microscopy for CD3, CD34, CD68, CD90, CLIC5 and HLA-DR. Bottom row, immunofluorescence microscopy for CD3, CD20 and CD138. Scale bars: 100 μm (CTAP-EFM) and 250 μm (all other images). Single-colour images are presented in Supplementary Fig. 4. A total of 150 fragments from 36 donors were stained in batches and analysed as a single cohort. Parts of Fig. 1a were generated using Servier Medical Art, provided by Servier, licensed under a Creative Commons Attribution 3.0 unported license.

