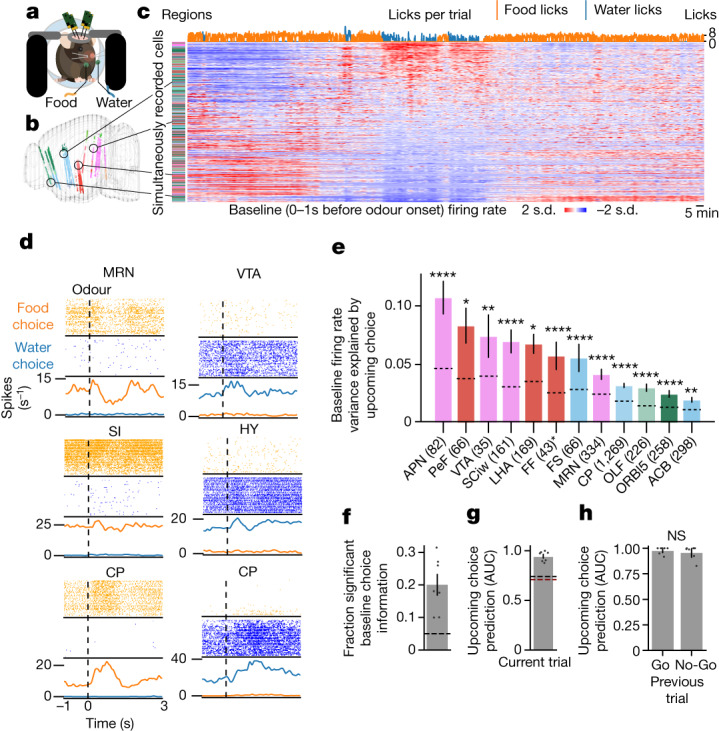
Fig. 2. Single-unit and population neural correlates of upcoming behavioural choice.

a, Schematic of simultaneous recording from 1,536 channels across four acute Neuropixels 1.0 probes during Buridan’s assay. b, Locations of neurons in the Allen Brain Atlas space. Units are colour-coded by brain region (Extended Data Table 1). c, An example recording session showing per-trial baseline activity for each of 996 simultaneously recorded units, z-scored with brain regions colour-coded as in b. Neurons are sorted by their correlation coefficient to the upcoming behavioural choice (top row, cumulative food or water licks per trial). d, Per-trial spike rasters from six example neurons (brain regions indicated on top), with spiking (ticks) shown for the first 50 food and water choices within a single session. Dashed lines indicate odour onset. Bottom, firing rate per trial. CP, caudoputamen; HY, hypothalamus; MRN, midbrain reticular nucleus; SI, substantia innominata; VTA, ventral tegmental area. e, Firing rate variance explained by upcoming choice, averaged within brain region. Dashed lines, null distribution per region. Exact P values in Methods. Bars indicate 95% confidence interval across cells. Data are pooled across recording sessions. Numbers in parentheses are counts of recorded cells in given regions; asterisks indicate regions present in only a single session. See Extended Data Table 1 for numbers of cells, mice and sessions per region. ACB, nucleus accumbens; APN, anterior pretectal nucleus; FF, fields of Forel; FS, fundus of striatum; LHA, lateral hypothalamic area; OLF, olfactory areas; ORBl5, orbital area, lateral part, layer 5; PeF, perifornical nucleus; SCiw, superior colliculus, motor related, intermediate white layer. f, Fraction of simultaneously recorded neurons per session whose baseline firing rates are significantly associated with upcoming reward choice, compared to a circularly permuted null (dashed line). g, Predictiveness of upcoming choice for held-out trials flanking switches, using population activity of simultaneously recorded neurons in the 1 s before odour onset. Dashed lines, null (circular permutation, black; session permutation, red). h, Population predictiveness of upcoming choice as in g, following either rewarded Go or unrewarded No-Go trials. Two-sided paired t-test, t = −1.072, P = 0.325. Mean across sessions, error bars indicate 95% confidence interval; n = 7 mice, 7 sessions (f–h). NS, not significant.
