Abstract
Communities across the globe are faced with a rapidly aging society, where age is the main risk factor for cognitive decline and development of Alzheimer’s and related diseases. Despite extensive research, there have been no successful treatments yet. A rare group of individuals called “super-agers” have been noted to thrive with their exceptional ability to maintain a healthy brain and normal cognitive function even in old age. Studying their traits, lifestyles, and environments may provide valuable insight. This study used a data-driven approach to identify potential super-agers among 7121 UK Biobank participants and found that these individuals have the highest total brain volume, best cognitive performance, and lowest functional connectivity. The researchers suggest a novel hypothesis that these super-agers possess enhanced neural processing efficiency that increases with age and introduce a definition of the “neural efficiency index.” Furthermore, several other types of aging were identified and significant structural–functional differences were observed between them, highlighting the benefit of research efforts in personalized medicine and precision nutrition.
Supplementary Information
The online version contains supplementary material available at 10.1007/s11357-023-00765-x.
Keywords: Neuroimaging, Longitudinal study, Healthy brain aging, Neural efficiency, Cognitive reserve, Neurodegeneration
Introduction
The average age across the global population is increasing. Typically, individuals will experience mild cognitive decline as they enter into their 40 s [1], while others are open to the prospect of developing Alzheimer’s disease or another similar dementia [2]. The future societal burden of cognitive aging and dementia will be staggering if research does not produce reliable and personalized protocols for prevention, and pharmaceutical treatments when they become necessary. Most research to-date has focused on cognitive and neural aging processes when they go awry, such as when amyloid plaques and tau tangles form, or when brain tissues shrink and degenerate. Our research sought to characterize and produce understanding of the aging process when it goes as well as naturally possible. We term these people who seem to exhibit the most optimal aging results as possible “super-agers.”
Super-agers show exceptional mental sharpness even at later points in their lifespan. They have remarkable qualities worth characterizing, including but not limited to youth-like cognitive function at advanced ages [3] and the relative absence of neurodegeneration [4]. Super-agers have also been observed with greater neuroimmunity [5], more von economo “self-control” neurons [6], and fewer neurofibrillary plaques [7]. These are many of the same signature biomarkers which characterize neurodegenerative diseases like AD [8]. The success of super-agers may be indicative of individual traits and other factors that are tapping into having a long and productive life; hence, studying them could reveal hidden insights about graceful aging and the prevention of AD. Initial research is showing that super-aging is intimately connected to certain genetic and lifestyle traits, and environmental factors.
Although super-aging has been set to begin at age 80 [9], no one knows when the developmental processes which lead to being a super-ager start or end. To some extent, the definition of a super-ager is typically theoretically grounded in thought experiments, unstandardized, with arbitrary boundaries set, and subject to debate. Important biological details could be missed if we only study individual’s destined to be super-agers after they turn 80. Because some of the developmental tracks that lead into dementia start earlier in life [10], it is possible that some of the super-aging developmental processes also start in midlife or sooner — or at least some time prior to age 80.
There is a lack of information and theory about the neural and cognitive developmental mechanisms involved in super-aging and their time of staging. In this paper, we seek to offer a more rational, empirically grounded set of super-aging qualities. We utilize a longitudinal data-driven process with the UK Biobank cohort data to (1) separate and group individuals in order to develop profiles of neurocognitive aging and classify the individuals accordingly and (2) identify and characterize the best-performing individuals in mid- to late-life (potential “super-agers”).
Methods
Cohort
Participants were a part of the UK Biobank study [11]. This prospective cohort study collected baseline data in a half million individuals from 22 assessment centers located in the UK, starting in 2006. A total sample of 7125 participants were available. For baseline data, cognition was tested between 2006 and 2010, while neuroimaging data collection began in 2014 and continued until 2018. A visit to the assessment center involved six consecutive steps: (1) consent, (2) touchscreen questionnaire, (3) verbal interview, (4) eye measures, (5) physical measures, and (6) blood/urine sample collection. The touchscreen questionnaire collected sociodemographic, lifestyle, cognitive function, and family history of illness data. Informed consent to participate was given at baseline. The UK Biobank protocol was approved by the North West MultiCentre Research Ethics Committee. Participants were aged 46 to 81 years old at the completion of this study.
Measurement of fluid intelligence trajectory
Participants completed the fluid intelligence test (FIT) as part of a touchscreen questionnaire at baseline (2006–2010) and two follow-up assessments (2012–2013, 2014–2018). The FIT score is quantified by how many numeric, logic, and syntactic questions (out of 13 total questions) that participants were able to answer correctly within two minutes [12]. We represent the temporally extended fluid intelligence process with an algebraic trajectory computed from difference equations to model each participant’s initial score (intercept) and linear change over time (velocity).
Measurements of brain volume and neural activity
A full protocol for how the neural images were acquired at one of three sites in Reading, Newcastle, or Manchester and processed is available online (http://biobank.ctsu.ox.ac.uk/crystal/refer.cgi?id=2367). In short, brain MRI data was acquired on a Siemens Skyra 3 T scanner with a standard Siemens 32-channel RF receiver head coil, with the imaging matrix angled down by 16° from the AC-PC line. Baseline MRI visits began in 2014 and continued until 2018. The baseline brain measures and third wave of cognitive measures occurred at the same visit. T1-weighted volumetrics were acquired in the sagittal plane using a three-dimensional magnetization-prepared rapid gradient-echo sequence at 1 mm cubic resolution, and field of view at 208 × 256 × 256. Participants were instructed to simply focus on a crosshair with eyes open and not think about anything specifically. Scan duration was 6 min and 10 s, to acquire 490 images with the following acquisition parameters: TR = 735 ms; TE = 39 ms; 2.4 × 2.4 × 2.4 mm voxel resolution; 88 × 88 × 64 matrix, multiband factor = 8, in-plane acceleration factor = 1, flip angle 52°. Pre-processing and quality control measures are described in UK Biobank white papers (https://biobank.ctsu.ox.ac.uk/crystal/crystal/docs/brain_mri.pdf). Briefly, using FSL tools, the 4D dataset was motion-corrected, grand-mean intensity normalized, high-pass temporal filtered (with sigma = 50.0 s), and EPI and GDC unwarped and denoised (using ICA + FIX processing). Group Principal Component Analysis and Independent Component 6 Analysis through FMRIB’s MELODIC were then used to derive 21 spatially orthogonal, non- noise, distinctive independent components (ICs) that represent resting neural networks. Each participant has a Z-score for a given IC, representing the degree of activation relative to the group mean. An expert (AAW) then viewed the activation maps and described the neural networks (see Supplementary Table 1).
Definition of the neural efficiency index
In order to analyze differences in the brain’s resource use efficiency at producing cognitive output, the participant’s baseline fluid intelligence score was divided by their neuroactivity level of the central executive network during resting state.
Software
Analyses were conducted using R 3.6.3 (R Foundation for Statistical Programming, Vienna, Austria) [13].
Missingness
Only individuals who had at least two time-point observations for fluid intelligence, and full data on the other analyzed variables, were considered for analysis. To maintain an empirical and data-driven analysis, no missingness imputation was utilized.
Outlier analysis
To ensure that these models were generalizable to at least 99% of the sample population, 1% quantiles were computed for each variable, and 604 participants beyond 99% of the sample distribution of the mean among any variable were removed from further analysis.
Cluster analysis
To discover latent categories that represent different states and stages of neurocognitive aging, we formed a divisive hierarchical clustering decision tree using Euclidean distance and complete linkage [14]. Despite the availability of new approaches, traditional hierarchical clustering remains an easy and effective way to establish group substructure [15]. The input variables included age, fluid intelligence initial values and 10-year velocity (collectively, “fluid intelligence trajectory”), whole brain grey matter volume, and resting state neural activity of the central executive network. This network was chosen a priori because it is strongly related to executive function performance, including fluid intelligence [16]. Preliminary analyses also suggested it was a better predictor than mean resting state activity across all neural networks (data not shown). Variables were standardized to ensure that clusters were not influenced by differing scales among the inputs. We computed solutions for nested sequences of 2 through 12 clusters and selected the 12-cluster solution for further characterization.
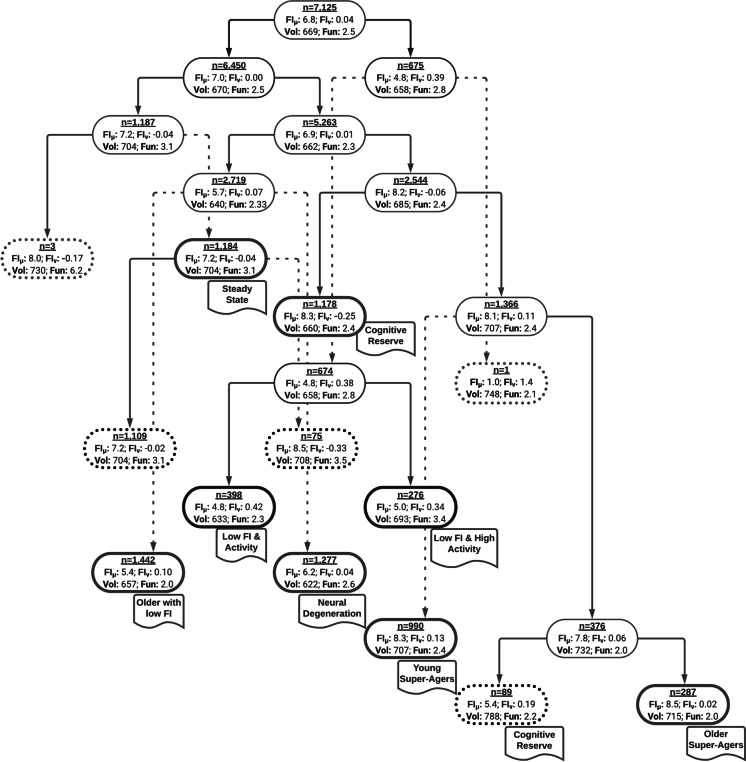
A solution that characterized 12 latent groups was selected. The primary parameter for selecting this solution, beyond the statistical parameters, was that it identified potential super-ager groups, consistent with our second goal. Twelve neurocognitive clusters were initially identified, and 8 were carried forward for further analysis. Two clusters were dismissed for having only 1 and 3 participants, thus possibly representing outliers or extremely rare groups that are too underpowered to be characterized here. Three clusters were recombined to a former cluster (producing the “steady state” and “cognitive reserve” clusters) due to a lack of meaningful differences and the desire to keep analyses as simple as possible. See Fig. 1 for a schematic of the hierarchical tree and 8 derived clusters.
Fig. 1.
This is a schematic of the hierarchical clustering tree with solutions for nested sequences from 1 through 12 clusters. The sample size and mean-structure are shown within each cluster bubble, where FIµ is the initial fluid intelligence score observed, FIv is the linear change over time in the fluid intelligence score, Vol is the total brain volume, and Fun is the neural activity of the central executive function network at rest. Cluster bubbles that are red with a dotted bubble were not analyzed due to low sample size. Cluster bubbles that are black with a dotted bubble were recombined into a previous cluster (please see RESULTS for more details). Cluster bubbles that are bolded and have a name tag under them represent one of the eight clusters that we characterize
Characterization of the neurocognitive profile of each cluster
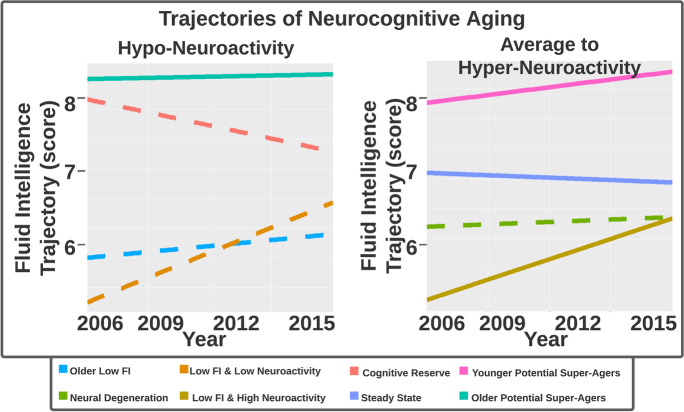
Once the cluster designations were known, the mean-structure (average value and standard deviation) for each cluster’s age, total grey matter volume, resting state executive function network, and fluid intelligence trajectory was computed. Comparison and contrasts of this neurocognitive profile between each cluster were the basis for the ad hoc naming conventions (Figs. 2 and 3).
Fig. 2.
This trajectory plot shows changes in fluid intelligence over 10 years for each of the eight neurocognitive profiles identified, facetted by low versus average to high neuroactivity. Solid line trajectories have above average brain volume, and dotted trajectories have below average brain volume
Fig. 3.
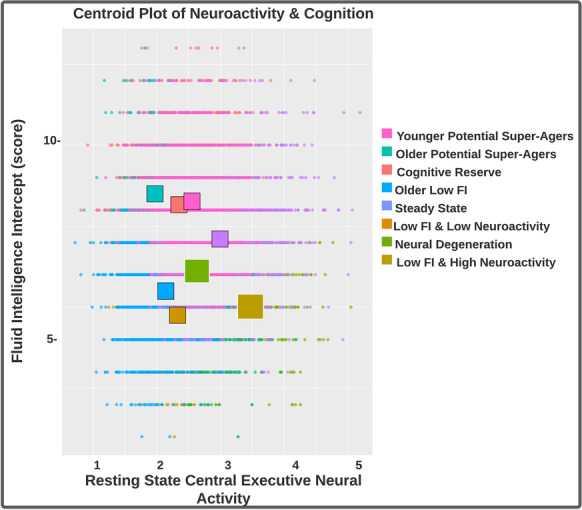
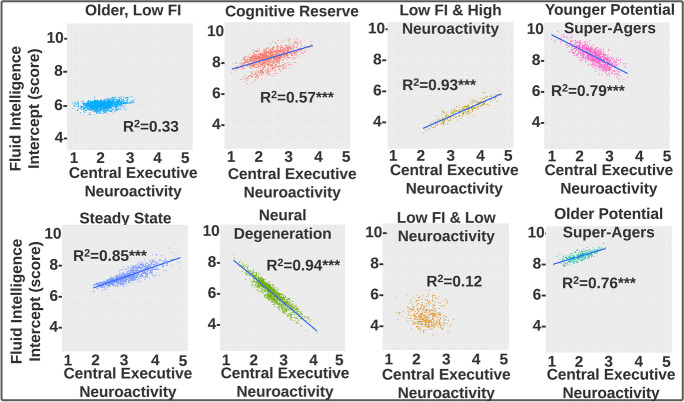
This is a scatterplot overlaid with centroids to demonstrate differences in cluster mean-structure for the central executive network at rest and the intercepts of the fluid intelligence trajectory
Regression analysis
Fluid intelligence was regressed against age, sex, total grey matter volume, and resting state executive function network in a cluster-wise manner (i.e., this model was built separately for each cluster). We also controlled for tobacco and cannabis smoking status, level of education, and social class. Estimates were calculated using maximum likelihood. Uncertainty analysis relied upon standard errors and p-value estimates, where results were considered statistically significant at p < 0.05.
Sensitivity analysis
Given the sample size of the smallest cluster (n = 276) and number of predictors (3), and no a priori hypotheses (“two-tails”), GPower 3.1 estimated the smallest effect which could be reliably detected was f2 = 0.047 (small), while minimizing type I error to α = 0.05, and type II error to β = 0.05.
Results
In summary, cluster analysis showed latent groupings of individuals that manifested (1) forms of neurocognitive decline over 6–10 years, with or without cognitive reserve; (2) forms of neurocognitive stability; or (3) super-ager-like neurocognitive improvement. In a regression analysis, this 8-cluster solution explained 77% of total grey matter volume, 37% of neural activity, and 43% of the 10-year cognitive trajectory. There were prominent group differences between brain volume, resting state neural function, cognitive performance, and age. The clustering solution had a very reasonable cluster structure based on an agglomerative coefficient of 0.957, indicating well-separated clusters [17]. After participants were categorized, Table 1 shows each latent group’s mean age, fluid intelligence trajectory, total brain grey matter volume, and resting state functional neuroactivity of the central executive network. Clusters are characterized by sample size representation, from largest (20.3%) to smallest (0.9%).
Table 1.
Latent group’s mean age, fluid intelligence trajectory, total brain grey matter volume, and resting state functional neuroactivity of the central executive network
| Identification | Age | FI intercept | FI velocity | Total grey volume | Central executive neural activity | Neural efficiency |
|---|---|---|---|---|---|---|
|
Older, low FI: n = 1442 (20.2%) |
66 (46–78) | 5.5 | 0.10 | 660 | 2.1 | 2.6 |
|
Older potential super-agers: n = 287 (4%) |
67 (58–76) | 8.5*** | 0.02*** | 716*** | 2.0*** | 4.5*** |
|
Low FI and neural activity: n = 398 (5.6%) |
61 (47–74) | 4.8*** | 0.42*** | 633*** | 2.3*** | 2.1*** |
|
Cognitive reserve: n = 1267 (17.8%) |
64 (46–81) | 8.2*** | -0.22*** | 668 | 2.4*** | 3.6*** |
|
Neural degeneration: n = 1277 (17.9%) |
63 (46–78) | 6.2*** | 0.04*** | 622*** | 2.6*** | 2.5*** |
|
Younger potential super-agers: n = 990 (13.9%) |
57 (45–71) | 8.3*** | 0.13 | 698*** | 2.6*** | 3.4*** |
|
Steady state: n = 1184 (16.6%) |
61 (45–78) | 7.1*** | -0.04*** | 703*** | 3.0*** | 2.4*** |
|
Low FI, high neural activity: n = 276 (3.9%) |
62 (47–77) | 5.0*** | 0.34*** | 694*** | 3.5*** | 1.5*** |
|
Overall population n = 7121 (100%) |
62 (45–81) | 6.8 | 0.04 | 669 | 2.5 |
***p-value < 0.001 and power > 0.999, where the older-leaning low FI group is the reference
Characterization of older individuals with low cognition
As shown in Table 1, the first cluster represented 20.3% of the population sample and had an average age of 66, making it the largest and second oldest sub-cohort. This group had low fluid intelligence score with small increases over time. Total brain volume, however, was mid-level, while neural activity was low. This trajectory represents the most typical variation of neurocognitive aging among this sample, and we characterize it as older individuals with low fluid intelligence.
Characterization of individuals with neural degeneration
The second cluster represented 18% of the population sample and were 63 years old on average. Most noteworthy among this sub-cohort was that they had the least brain volume. Their fluid intelligence was lower, while fluid intelligence velocity was steady, and neural activity was approximate to the total sample average.
Characterization of individuals with cognitive reserve
The third cluster represented 16.6% of the population sample with an average age of 65. The most defining characteristic of this group was that they had almost the highest levels of fluid intelligence, despite their older age. Although they had cognitive reserves, their fluid intelligence levels were declining steadily each year. Brain volume and neural activity levels were close to the total sample averages.
Characterization of steady state individuals
The fourth cluster represented 15.6% of the population sample who had an average age of 61 years old. This group was noted as having midrange levels of fluid intelligence and a steady fluid intelligence velocity. They have above average levels of brain volume and neural activity.
Characterization of younger potential super-agers
The fifth cluster represented 13.9% of the population sample, and their average age was 57 years old. This group demonstrated high levels of fluid intelligence and brain volume. They also had a slightly positive velocity in fluid intelligence. Levels of neural activity were midrange.
Characterization of individuals with low fluid intelligence/low neuroactivity
The sixth cluster represented 5.6% of the population sample with an average age of 61 years old. This group had low performing fluid intelligence levels, low brain volume with significantly less neural activity. Oddly, the group did have the greatest average fluid intelligence velocity.
Characterization of older potential super-agers
The seventh cluster represented 4% of the population sample who were 67 years old on average. This group was noted for its high levels of fluid intelligence and brain volume, while also maintaining that level of fluid intelligence with an absence of cognitive decline. In contrast to the younger potential super-ager group, they had lower levels of neural activity.
Characterization of individuals with low fluid intelligence/high neuroactivity
The eighth cluster represented 3.9% of the population sample and were 62 years old on average. This cluster was defined by its high levels of neural activity combined with poor fluid intelligence performance. Nonetheless, they had slightly above average brain volume and fluid intelligence was observed to increase over time.
Differences in neuroactivity, cognition, and neural efficiency between clusters
We examined the relationship between central executive neuroactivity and fluid intelligence scores (Fig. 4). Importantly, and as related to our development of personalized medicine, we observed that the relationship could differ markedly depending on cluster assignment. A hallmark feature we noted for the two potential super-ager groups and the cognitive reserve group was greater neural efficiency indices, in contrast to the other 5 neurocognitive profiles. The older super-ager group demonstrated the best neural efficiency, despite being the oldest group on average (Fig. 5).
Fig. 4.
These cluster-wise scatterplots show how the linear relationship between central executive function and fluid intelligence score differ dramatically depending on which cluster the individual was assigned to
Fig. 5.
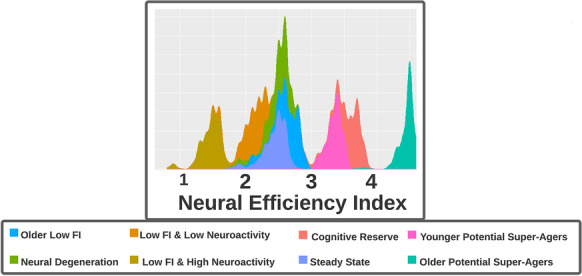
This histogram shows the distribution of the neural efficiency index by cluster. Note that older potential super-agers, younger potential super-agers, and cognitive reserve clusters demonstrate superior efficiency
Discussion
In this paper, we demonstrated that neurocognitive aging between age 45 and 80 is diverse and heterogeneous. We identified and characterized eight neurocognitive profiles based on 10-year cognition trajectories, total brain grey matter volume, and neural activation of the executive network at rest. These profiles exhibited pronounced between-group differences in both their mean-structure and correlation-structure. Two potential “super-ager” profiles consistently outperformed other profiles on 5 neurocognitive parameters, especially on their neural efficiency index. The remaining profiles represented variations of normal and pathological aging. One profile represented individuals who were characterized by having cognitive reserve [18]. About one-fifth of the population presented with brain hyper-neuroactivity, half of the population showed midrange levels of neuroactivity, and almost a third had hypo-neuroactivity.
Hypometabolism in the brain has traditionally been discussed as a marker of AD coinciding with cognitive decline and neurodegeneration [19–21]. Hypometabolism represents reduced glucose uptake and is observed prior to the initiation of brain atrophy [22]. There are some reports of a “transient hypermetabolism phenotype” which seems to precede and predict transition to Alzheimer’s disease [23, 24]. Brain metabolism and resting state fMRI values are almost multicollinear (ρ = 0.80) in the absence of neurodegeneration, although their synchronicity becomes distorted (ρ = 0.67) as the rate of brain deterioration accelerates [25].
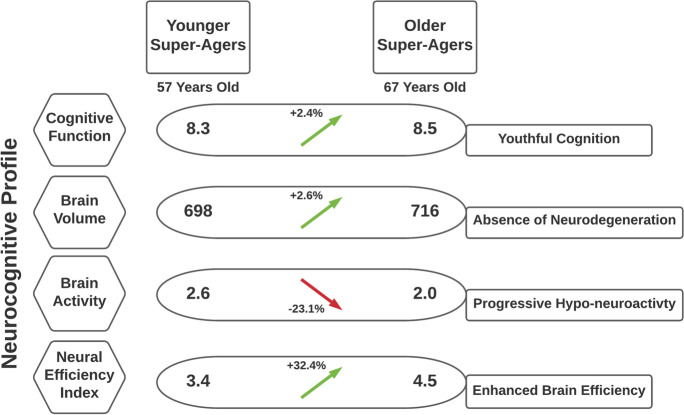
We noted a discordant observation: the neuroactivity levels of both super-ager groups were below average, especially for the older super-agers. While our results did replicate prior research that super-agers maintain youthful cognitive function [3] with a relative absence of neurodegeneration [4], the older potential super-ager cluster had the lowest neuroactivity of the entire cohort. Considering that there was a decade age gap between the younger and older super-ager clusters, it is plausible to infer that the younger group is on the same “aging track” (the trajectory to super-agerhood) as the older group (see Fig. 6). A progressive hypometabolism representing a 23% reduction was noted in this 10-year gap between the two clusters. Given that their cognitive performance remained high-powered and youth-like, while the metabolic resources necessary to achieve that performance level decreased, we interpret this as potentially representing a novel super-aging phenotype described as an aging-related metabolic shift into greater neural efficiency. If this phenotype description is accurate and is also observed among the potential super-agers of other cohorts, that biological shift could be occurring anytime between age 50 and 80, just based on the reference range for age between the younger and older potential super-agers in this cohort.
Fig. 6.
This schematic illustrates inferred (not empirically observed) 10-year changes in neurocognition between super-agers
We additionally examined the relationship neural activity had with both brain volume and cognitive function, stratified by the eight groups. Interestingly, we noted that the relationship between central executive neuroactivity and fluid intelligence scores differed drastically between groups. Neuroactivity and cognitive function typically presented with a positive correlation, but the relationship was inverse for younger super-agers and the cluster who had the least brain volume (“neural degeneration”). Lower neuroactivity among the older potential super-agers was not suggestive of any neurocognitive deficits. Despite strong statistical power, no association was observed for “older, low FI” and “low FI and low neuroactivity” clusters, which, if replicated in other cohorts, could be suggestive of a biological uncoupling between the brain and higher-order functions of the mind that occurs in these individuals. These group-specific differences in the mean-structure and correlation-structure may even represent useful targets for personalized medicine and precision nutrition.
Because of these pronounced group differences in the mean- and correlation-structure of cognition and brain function, and the usefulness of employing both cognitive and neuroimaging data for distinguishing between the clusters, we made a ratio dividing the individual’s cognitive score by their fMRI levels, such that the fMRI ROI is thought to be concordant with the cognitive subdomain in question. We are naming that resulting ratio the “neural efficiency index.” Although this variable was not employed in the cluster analysis, we found that it was a potent differentiator for several of the clusters, especially the potential super-agers and cognitive reserve. It was less useful in differentiating “main sequence” clusters by itself.
This paper had several advantages including the use of a data-driven methodology that was able to replicate established theory and generate new post-priori hypotheses. The method capitalizes on information from both cognitive and brain imaging data, including the use of 10-year longitudinal cognitive data among a very large sample. A few limitations are also noted. Longer longitudinal data is required on this cohort before we can more accurately map out how the types of neurocognitive aging unfold. We also acknowledge that future research would be beneficial to examine among two or three other cohorts how well and how frequently these results replicate before strongly considering these post-priori hypotheses further. Nonetheless, we also consider that we were able to vindicate the results from other aspects of internal, external, and face validity [26]. The lack of longitudinal neuroimaging data was also a limitation; for instance, neuroimaging occurred simultaneous to the third wave of cognitive testing, but not the first or second waves.
While aging and dementia are often typified by decreasing neuroactivity, reducing brain volume, and deteriorating cognitive performance, we demonstrate that neurocognitive aging is diverse because people develop and age rather differently from each other. We utilized a clustering methodology that was able to capture that diversity, and which identified the rare trait of super-aging in the UK Biobank cohort. Potential super-agers sustain youthful minds and brains into late life, possibly while continually improving their brains’ efficiency as they age. We also observed and discussed that the nature of mean-structure and correlation-structure varied drastically between subgroups and that reduced neural activity with age does not always coincide with reduced cognition. Future directions in determining the causative factors of super-aging include exploring and testing genes, life choices, environments, and other biomarkers that best predict or associate with the super-ager phenotype.
Supplementary Information
Below is the link to the electronic supplementary material.
Acknowledgements
This research has been conducted using the UK Biobank Resource under Application Number 25057.
Funding
This work was supported by the Iowa State University, National Institutes of Health (NIH) R00 AG047282 and National Institute of Aging (NIA) P30AG10161.
Data Availability
The UK Biobank data used for this article requires a data user agreement approval. Please see www.ukbiobank.ac.uk for access.
Declarations
Conflict of interest
The authors declare no competing interests.
Footnotes
Publisher's note
Springer Nature remains neutral with regard to jurisdictional claims in published maps and institutional affiliations.
References
- 1.Harada CN, Love MCN, Triebel KL. Normal cognitive aging. Clin Geriatr Med. 2013;29(4):737–752. doi: 10.1016/j.cger.2013.07.002. [DOI] [PMC free article] [PubMed] [Google Scholar]
- 2.Goedert M, Spillantini MG. A century of Alzheimer's disease. Science. 2006;314(5800):777–781. doi: 10.1126/science.1132814. [DOI] [PubMed] [Google Scholar]
- 3.Harrison TM, Weintraub S, Mesulam MM, Rogalski E. Superior memory and higher cortical volumes in unusually successful cognitive aging. J Int Neuropsychol Soc. 2012;18(6):1081–1085. doi: 10.1017/S1355617712000847. [DOI] [PMC free article] [PubMed] [Google Scholar]
- 4.Gefen T, Kawles A, Makowski-Woidan B, Engelmeyer J, Ayala I, Abbassian P, ... & Geula C. Paucity of entorhinal cortex pathology of the Alzheimer’s type in SuperAgers with superior memory performance. Cereb Cortex.2021:31(7):3177–83. [DOI] [PMC free article] [PubMed]
- 5.Hashimoto K, Kouno T, Ikawa T, Hayatsu N, Miyajima Y, Yabukami H, ... Carninci P. Single-cell transcriptomics reveals expansion of cytotoxic CD4 T cells in supercentenarians. Proc Natl Acad Sci. 2019;116(48):24242–51. [DOI] [PMC free article] [PubMed]
- 6.Allman JM, Tetreault NA, Hakeem AY, Manaye KF, Semendeferi K, Erwin JM, ... Hof PR. The von Economo neurons in frontoinsular and anterior cingulate cortex in great apes and humans. Brain Struct Funct. 2010;214:495–517. [DOI] [PubMed]
- 7.Gefen T, Peterson M, Papastefan ST, Martersteck A, Whitney K, Rademaker A, ... Geula C. Morphometric and histologic substrates of cingulate integrity in elders with exceptional memory capacity. J Neurosci. 2015;35(4):1781–91. [DOI] [PMC free article] [PubMed]
- 8.Hampel H, Blennow K, Shaw LM, Hoessler YC, Zetterberg H, Trojanowski JQ. Total and phosphorylated tau protein as biological markers of Alzheimer’s disease. Exp Gerontol. 2010;45(1):30–40. doi: 10.1016/j.exger.2009.10.010. [DOI] [PMC free article] [PubMed] [Google Scholar]
- 9.Rogalski EJ. Don't forget—Age is a relevant variable in defining SuperAgers. Alzheimer's & Dementia: Diagnosis, Assessment & Disease Monitoring. 2019;11:560. doi: 10.1016/j.dadm.2019.05.008. [DOI] [PMC free article] [PubMed] [Google Scholar]
- 10.Amariglio RE, Donohue MC, Marshall GA, Rentz DM, Salmon DP, Ferris SH, Sperling RA. Tracking early decline in cognitive function in older individuals at risk for Alzheimer disease dementia: The Alzheimer’s disease cooperative study cognitive function instrument. JAMA Neurology. 2015;72(4):446–454. doi: 10.1001/jamaneurol.2014.3375. [DOI] [PMC free article] [PubMed] [Google Scholar]
- 11.Sudlow C, Gallacher J, Allen N, Beral V, Burton P, Danesh J, ... Collins R. UK biobank: an open access resource for identifying the causes of a wide range of complex diseases of middle and old age. PLoS Med. 2015;12(3):e1001779. [DOI] [PMC free article] [PubMed]
- 12.Lyall DM, Cullen B, Allerhand M, Smith DJ, Mackay D, Evans J, ... Pell JP. Cognitive test scores in UK Biobank: data reduction in 480,416 participants and longitudinal stability in 20,346 participants. PloS One. 2016;11(4):e0154222. [DOI] [PMC free article] [PubMed]
- 13.Rosseel Y. lavaan: An R package for structural equation modeling. J Stat Softw. 2012;48:1–36. doi: 10.18637/jss.v048.i02. [DOI] [Google Scholar]
- 14.Rajalingam N, Ranjini K. Hierarchical clustering algorithm-a comparative study. Int J Comput Appl. 2011;19(3):42–6.
- 15.Odong TL, Van Heerwaarden J, Jansen J, van Hintum TJ, Van Eeuwijk FA. Determination of genetic structure of germplasm collections: are traditional hierarchical clustering methods appropriate for molecular marker data? Theor Appl Genet. 2011;123:195–205. doi: 10.1007/s00122-011-1576-x. [DOI] [PMC free article] [PubMed] [Google Scholar]
- 16.Kane MJ, Engle RW. The role of prefrontal cortex in working-memory capacity, executive attention, and general fluid intelligence: An individual-differences perspective. Psychon Bull Rev. 2002;9(4):637–671. doi: 10.3758/BF03196323. [DOI] [PubMed] [Google Scholar]
- 17.Ketchen DJ, Shook CL. The application of cluster analysis in strategic management research: an analysis and critique. Strateg Manag J. 1996;17(6):441–458. doi: 10.1002/(SICI)1097-0266(199606)17:6<441::AID-SMJ819>3.0.CO;2-G. [DOI] [Google Scholar]
- 18.Tucker MA, Stern Y. Cognitive reserve in aging. Curr Alzheimer Res. 2011;8(4):354–60. [DOI] [PMC free article] [PubMed]
- 19.Mosconi L, Brys M, Glodzik-Sobanska L, De Santi S, Rusinek H, De Leon MJ. Early detection of Alzheimer’s disease using neuroimaging. Exp Gerontol. 2007;42(1-2):129–38. [DOI] [PubMed]
- 20.Daulatzai MA. Cerebral hypoperfusion and glucose hypometabolism: Key pathophysiological modulators promote neurodegeneration, cognitive impairment, and Alzheimer's disease. J Neurosci Res. 2017;95(4):943–972. doi: 10.1002/jnr.23777. [DOI] [PubMed] [Google Scholar]
- 21.McDonough IM, Madan CR. Structural complexity is negatively associated with brain activity: a novel multimodal test of compensation theories of aging. Neurobiol Aging. 2021;98:185. doi: 10.1016/j.neurobiolaging.2020.10.023. [DOI] [PubMed] [Google Scholar]
- 22.Mosconi L, Sorbi S, de Leon MJ, Li Y, Nacmias B, Myoung PS, ... Pupi A. Hypometabolism exceeds atrophy in presymptomatic early-onset familial Alzheimer's disease. J Nucl Med. 2006;47(11):1778–86. [PubMed]
- 23.Busche MA, Konnerth A. Neuronal hyperactivity–A key defect in Alzheimer's disease? Bioessays. 2015;37(6):624–32. [DOI] [PubMed]
- 24.Willette AA, Modanlo N, Kapogiannis D. Insulin resistance predicts medial temporal hypermetabolism in mild cognitive impairment conversion to Alzheimer disease. Diabetes. 2015;64:1933. doi: 10.2337/db14-1507. [DOI] [PMC free article] [PubMed] [Google Scholar]
- 25.Marchitelli R, et al. Simultaneous resting-state FDG-PET/FMRI in Alzheimer disease: relationship between glucose metabolism and intrinsic activity. Neuroimage. 2018;176:246. doi: 10.1016/j.neuroimage.2018.04.048. [DOI] [PubMed] [Google Scholar]
- 26.Ullmann T, Hennig C, Boulesteix AL. Validation of cluster analysis results on validation data: A systematic framework. Wiley Interdisciplinary Reviews: Data Mining and Knowledge Discovery. 2022;12(3):e1444. [Google Scholar]
Associated Data
This section collects any data citations, data availability statements, or supplementary materials included in this article.
Supplementary Materials
Data Availability Statement
The UK Biobank data used for this article requires a data user agreement approval. Please see www.ukbiobank.ac.uk for access.


