

Abstract
Human lifespan has increased from a median of 46.5 years in 1950 to 71.7 years in 2022. As people age, one of the inevitable consequences is a decline in kidney function and glomerular filtration rate (GFR) which can have direct or indirect effects on the pharmacokinetic and pharmacodynamic profiles of many drugs. Numerous equations have been developed to generate estimated GFR (eGFR) using the two principal biomarkers: serum creatinine and serum cystatin C. However, the trajectory of changes with aging is dissimilar in these equations. In addition, there is recognition that chronological age (lifespan) often does not reflect biological age (healthspan) as an essential parameter in kidney function equations. In the past decade, there has been an increasing interest in quantifying biological age and new commercially available assays have entered the marketplace. In this narrative review, we illustrate how dominant equations of eGFR model the fractional change in this parameter very differently across chronological age. In addition, we review various biological age indicators (aging clocks) and challenges to their application in clinical practice. Importantly, by comparing vancomycin's mean clearance as a drug with limited metabolism and unchanged elimination between two age milestones in some recent population pharmacokinetic models, we show how efforts to quantify kidney function in older adults optimally remain under‐explored, particularly those at the upper end of their lifespan. We also propose considering new models that integrate biological age as a new pathway to improve precision drug dosing in older adults.
INTRODUCTION
Aging is a complex and dynamic process associated with various biological, physiological, environmental, psychological, behavioral, and social changes in individuals. 1 These processes manifest through visible physical traits like graying hair to molecular‐level changes like telomere length reduction. 2 The World Health Organization (WHO) expects the global population of older adults (over 65 years) to increase by 400 million individuals by 2030. 3 Likewise, about 25% of the US population will consist of older adults by 2060. 4 This significant increase in older adults is attributed to public health initiatives, medical innovations, and improvements in healthy lifestyles in the modern era. 5
Like all biological processes, aging has remarkable interindividual variability that needs better characterization. Dose labeling specific to older adults is required by law. 6 As a consequence, regulatory agencies recognize older adults as a specific population. However, attention to drug dose considerations in individuals above 80 years – is often limited, which leads to drug dosing uncertainty in this emergent population. In this regard, it is important to involve older adults during drug development and clinical trials to evaluate the age‐related effects on a drug's risk–benefit ratio. 7 This is especially true because older adults are often on multiple medications (polypharmacy) and at risk for drug–drug interactions and adverse drug events even with dose adjustments. 8 According to current estimates, older adults commonly use five or more medications, several of which often require adjustment for kidney function. 9 , 10 Attention to this specific population has increased in the past few years with a focus on approaches to slowing the aging process. Postponing these age‐related physiologic changes at the upper end of the lifespan can have pharmacokinetic (PK) consequences that also need further studies.
Aging affects nearly every physiologic process, and countless biomarkers have been proposed to measure it. 2 Further investigation of these biomarkers may help us find a better understanding of the relationships between an individual's health status and life expectancy. In that context, it may be advantageous to have criteria that can capture the quality of general and organ health on an individual level. This better representation of chronological age is referred to as biological age. By definition, chronological age is the actual time in years from the date of birth to a given date in time. Biological age is a much more complex time variable that incorporates multiple factors that account for cellular and biochemical processes. Quantitative relationships between biological age and drug disposition have not been well‐defined. In recent years, multiple diagnostic tools to quantify biological age have emerged in the United States. 11 This remarkable investment in biological age‐related research implies that new opportunities exist to improve quantitative systems pharmacology across the lifespan and healthspan. This narrative review aims to address current methods for quantifying biological age (aging clocks) and discuss the kidney function changes with aging because it is a key quantitative measure used for drug dose adjustment in labels. We review current models for estimating kidney function across age and provide an illustrative drug case example to show gaps in our knowledge and areas for future study to better capture interindividual variability in aging.
QUANTIFYING BIOLOGICAL AGE
Current biological age diagnostic tools include aging clocks, blood biomarker tests, physical/physicochemical function tests, microbiome tests, bio‐imaging tests, and genetic tests. Countless factors are involved to evaluate the efficacy and market feasibility of biological age diagnostics, including cost, accuracy, accessibility, reproducibility, technical simplicity and user interface, number of different biomarkers measured, etc. 11 Biological aging can be estimated based on five fundamental categories that include the evaluation of epigenetics, genetics, proteomics, metabolomics, and composite biomarkers (Figure 1). Although epigenetics are considered essential, other downstream measurements may offer organ‐level specificity. One of the most studied epigenetic biomarkers of aging is DNA methylation (DNAm), which precisely quantifies DNAm at 5′—Cytosine—phosphate—Guanine—3′ (CpG) sites. The CpG sites are DNAm regions located at the promoters of genes, enriched by cytosine and guanine base pairs separated by phosphate groups. Gene expression and tissue‐specific purposes depend highly on DNAm at CpG sites. 12 Contemporary aging clocks, such as the Horvath, Hannum, GrimAge, PhenoAge, Zhang's epigenetic age, and DunedinPACE clocks, have been designed to estimate biological age using data from different CpG sites (Table 1). 13 , 14 , 15 , 16 , 17
FIGURE 1.
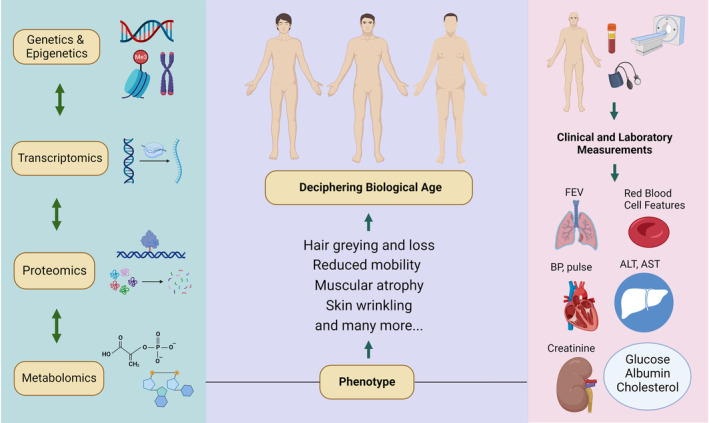
Illustration of the hierarchy of deciphering biological age based on molecular approaches, human phenotype, and clinical and laboratory measurements; ALT, alkaline phosphatase; AST, aspartate aminotransferase; BP, blood pressure; CRP, C‐reactive protein; FEV, forced expiratory volume; LDL, low‐density lipoprotein (created with BioRender.com).
TABLE 1.
Summarized list of the developed epigenetic clocks to date.
| Epigenetic clock | Development | Predictive power |
|---|---|---|
| Horvath (2013) | Analysis of 8000 multiple tissue samples; developed to predict chronological age | Compromised cognitive function, grip strength, lung function, Alzheimer's and Parkinson's, osteoarthritis, obesity, metabolic syndrome, and all‐cause mortality |
| Hannum (2013) | Analysis of methylome of over 450,000 CpGs in a diverse group of 656 people; relies exclusively on blood samples to predict chronological age |
Motor coordination, cognitive health, immunosenescence, and all‐cause mortality |
| PhenoAge (2018) | Utilizing clinical data from a diverse and nationally representative group comprising 10,000 adults with complete biomarker data; relies on morbidity and mortality data rather than chronological age alone. |
One of the stronger predictors of age‐related morbidity (Alzheimer's, immunosenescence, frailty, etc.). |
| GrimAge (2019) | Analysis of over 7000 samples from various data cohorts (including Framingham Heart Study); developed as a composite of seven surrogate DNA methylation‐based markers for plasma proteins, self‐reported smoking pack years, gender, and chronological age. |
Cardiovascular disease, time to cancer, hypertension, and type 2 diabetes |
| Zhang (2019) | Analysis of DNA methylation in more than 13,000 blood samples from 14 data cohorts with a diverse group of individuals | Cardiovascular disease, cancer, and all‐cause mortality |
| DunedinPACE (2022) | Using data from the Dunedin Study 1972–1973 birth cohort tracking a within‐individual decline in 19 indicators of organ‐system integrity across four‐time points spanning two decades to model the Pace of Aging | Faster aging in young adults with childhood adversity, a blood biomarker of the pace of aging for gerontology and geroscience |
The Horvath clock is a composite score developed based on the methylation levels of 353 CpG sites on the Illumina 27k array. 13 This multi‐tissue predictor can estimate the DNAmAge (age of DNA methylation) in numerous cells and tissues. This model reports the DNAmAge or the predicted age and includes a statistic to inform the user of a potential outlier. 13 In contrast to the Horvath clock, the Hannum clock uses only 71 CpG sites from the Illumina 450k array, and it is another DNAmAge estimator that measures the rate at which an individual's methylome ages. 14 This model uses a penalized multivariate regression method, Elastic Net, combined with a bootstrap approach. This model includes clinical parameters, such as gender and body mass index (BMI) and methylome data – patterns of DNA methylation within the genome – from whole blood samples. 14 The GrimAge is a more recent composite biomarker developed based on seven DNAm surrogates of plasma protein estimators and a DNAm surrogate of smoking pack‐years estimator. 15 A 1030 unique CpGs are integrated into the GrimAge model and fewer than 200 CpGs are involved in each of the smoking pack‐years biomarkers with seven plasma protein biomarkers. A key feature of the GrimAge model is its predictive ability for time‐to‐death, age at menopause, and time‐to‐coronary heart disease. 15
PhenoAge is a novel composite biomarker of aging that was introduced in 2018. 16 PhenoAge can predict the risks of aging outcomes, such as all‐cause mortality, cancers, healthspan, diabetes, and Alzheimer's disease, across diverse cells and tissues by using the collected data from whole blood samples and examining the biology of 513 CpGs involved in the PhenoAge model. 16 PhenoAge provides a more straightforward, closer, and more accurate estimate of the actual health status of individuals compared to the other composite biomarkers. 16 A 1‐year increase in DNAm PhenoAge is associated with a 4.5% increase in the risk of all‐cause mortality. 11
A more recent DNAm‐based biomarker of aging is the DunedinPACE clock, which measures the rate of aging from epigenetic information from 173 CpG sites. 17 This clock helps to understand better how interventions may alter the pace of aging due to its high test–retest reliability. The DunedinPACE is similar to GrimAge but is associated with better prediction of morbidity, disability, mortality, and faster aging in young adults with childhood hardship. 17 Zhang's epigenetic age is another common epigenetic clock that is also known as the “cancer clock.” There is strong evidence that an aging‐response relationship exists between DNAm age and cancer prediction exists. A 1‐year increase in Zhang's epigenetic age results in a 6% increased risk of developing cancer within 3 years timeframe. 11
It is reasonable to assume that a comprehensive biomarker for aging requires a combination of laboratory, epigenetic, non‐epigenetic, physical features, organ function biomarkers, and senescence markers. This complexity makes it unlikely to achieve consensus on a single standardized composite aging biomarker in the short term. 18 Determined by numerous sets of variables that change with aging, the composite aging score provides a quantitative approximation of the overall physiological status of individuals. 19 Increasing the number of variables will improve the aging score, but this over‐parameterization and complexity may only result in a minor change to the composite aging score. Furthermore, the development of overly complex models of biological age is likely to reduce the probability of clinical implementation. 19 , 20 With the advancement of biological age diagnostic tools and particularly the epigenetic clocks, an important research question to address is whether replacing chronological age with biological age will better predict kidney function and drug dosing. If it is shown to be “better,” an initial obstacle to implementation will be the cost, which is currently $300–$500 per test. If this tool definitively predicts certain health outcomes and better measures of healthspan, then a scale‐up of these assays will lower prices over time. At present, these aging clocks are potentially helpful for the evaluation of senolytics or anti‐aging drugs. Increased attention to these concepts is necessary for clinical pharmacology as they offer tools that could be exploited to inform sources of interindividual variability in exposure and response to drugs.
FUNCTIONAL CHANGES IN KIDNEY DRUG ELIMINATION PROCESSES DURING AGING
Elimination is a critical PK process that is impacted by aging. 9 This decline in function occurs approximately after the chronological age of 40–50 years. On average, kidney function based on the glomerular filtration rate (GFR) declines by 0.75–1 mL/min/year. 21 Whereas the liver and kidneys are significant routes of drug clearance, kidney function is the quantitative tool used to modify drug dosing in older adults. Therefore, measuring kidney function and following up on these changes as patients age is essential. 22 In addition to age‐related changes to kidney function, poorly managed hypertension, diabetes, and chronic heart diseases can accelerate kidney function decline in older adults. 9
Kidney function is an important surrogate for drug clearance via three independent processes. The three processes of drug elimination via the kidneys include glomerular filtration, proximal tubular secretion, and distal tubular re‐absorption. 23 As people age, kidney blood flow (about 10% after age 40) and GFR (0.75–1.0 mL/min/1.73 m2 per year after age 40) decrease along with increased renal vascular resistance and enhanced filtration fraction. 24 This increase in the vascular resistance in the efferent arterioles and consequent glomerular pressure enhancement can cause hyper‐filtration, which can damage glomerular capillaries and enhance albumin excretion. The amount of albumin excreted in the urine increases with a decline in the quality of the glomerular barrier and might exceed 6.8 μg/min in middle‐aged and older adults often due to comorbid conditions, such as diabetes or cardiovascular diseases. 25 , 26 As a person ages, they may experience a decrease in the number of superficial nephrons (glomeruli near the kidney surface), which can result in reduced kidney perfusion. As a result, the capacity for renal autoregulation and the ability to concentrate solutes is impaired following a decrease in medullary osmolality caused by the increased workload on juxtamedullary nephrons (glomeruli near the border of the cortex and the medulla). The glomerular function is generally preserved in older adults without comorbidities, yet the functional reserve declines and limits older adults' adaptation to acute kidney injury or greater demands. 27
Measurement of GFR is not routine in the clinic and rests principally on measuring serum creatinine (SCr) as a biomarker to estimate GFR. However, despite a decrease in GFR with aging, SCr concentrations often remain within the normal range. This is because older adults generally have less muscle mass, less physical activity than younger adults do, and thus less creatinine production. Maintenance of normal SCr concentrations in older adults does not always equate to normal kidney function in this population. 28 Davies and Shock were the first to demonstrate the age‐dependent decline in kidney function through cross‐sectional analyses that now is corroborated through longitudinal studies. 29 Although it is generally accepted that there is a decrease in GFR of ~1 mL/min/year after age 40, Bolignano et al. 30 have found that the yearly decline rate in GFR varies greatly among adults, ranging from 0.4 to 2.6 mL/min/year. In other words, it could take 100 years to reach mild kidney insufficiency, whereas others suggest it would take half this time if this decline is linear. 30 On average, a drop of 8 mL/min/1.73 m2/decade in GFR is expected after age 40; however, this decrease in GFR will differ from person to person. Given that the individual trajectory is hard to predict, repeated measures of GFR may be necessary to better understand an individual's trajectory in order to define drug dosage adjustments. 31 Unfortunately, few studies have focused on longitudinal GFR measurement as a tool for more optimal drug dosing in older adults.
In addition to filtration, many transporters are involved in re‐absorption and secretion, contributing to net drug clearance and dosing adjustments. Kidney tubular transporters may also be a source of potential drug–drug interactions between their substrates or/and inhibitors, some of which are summarized by Yin et al. 23 Age is a likely factor contributing to differences in the expression of these transporters in the human kidneys. 32 Understanding ontogeny and aging‐associated alterations in renal transporter expression are necessary to evaluate the effects of drugs or toxicants in specific populations like older adults. 33 A summary of crucial age‐related changes to kidney tubule transporters is detailed below. Readers are encouraged to refer to other reliable tertiary sources for a more comprehensive understanding. 34 , 35 , 36
Numerous transporters are involved in the proximal tubular secretion of drugs. These transporters are mainly distributed on the basolateral and apical membranes of renal proximal tubular cells. In recent years, a significant focus has been directed toward transporters in drug development. 37 Xu et al. 33 were among the first groups profiling the age‐associated variations in transporter expression for 12 major proximal tubular transporters. They found a remarkable increase in the mRNA expression levels of these transporters through maturation and adulthood. The levels of mRNA expression continue to remain high during the aging process. Nonetheless, a decrease in mRNA expression levels of specific transporters, such as organic anion transporter 2 (OCT2), organic anion transporter polypeptide 4C1 (OATP4C1), multidrug resistance protein 1b – MDR1, namely p‐glycoproteins (P‐gp) – (Mdr1b), and human multidrug and toxin extrusion 1 (MATE1), was observed with aging. 33 These findings may provide new insights into the renal disposition of drugs.
Like secretion, various transporters are involved in renal re‐absorption. Two necessary transporters in this process are the Na+/K+‐ATPase transporter and K+/Cl− symporter, both of which are located on the basolateral membrane of cells and play a pivotal role in the movement of ions like sodium, potassium, chloride, and calcium. Few studies have discussed the association between aging and re‐absorption transporters, unlike secretion transporters. Frame et al. 38 summarized the age‐related alterations in the kidneys’ sodium transport system that may contribute to impaired sodium handling and age‐related hypertension in different species in their mini‐review. They found that the activity of the Na+/K+‐ATPase transporter decreased in the distal convoluted tubule and increased in the collecting tubule of Sabra rats with aging. 38
As noted, GFR is estimated, but secretion and re‐absorption are not in clinical practice. So, an important consideration is whether direct translation of these processes from GFR is possible. 39 Again, because these processes are not measured, the general assumption has been that GFR, secretion, and re‐absorption decline at similar rates with age. However, the impact of these changes is likely to be dependent on a drug's physicochemical and PK properties, so this remains an open question for future research.
ESTIMATED KIDNEY FUNCTION EQUATIONS IN OLDER ADULTS
Conventional methods for estimating kidney function are imprecise and biased by their reliance on endogenous biomarkers. Measurement of creatinine clearance (Clcr) is challenging to carry out due to difficulties with 24‐h urine collections. 40 Some studies have suggested that shorter collecting times, like 12‐ and 2‐h urine collections, may be comparable to 24‐h Clcr measurements. 41 , 42 Other variables, such as diet, exercise, and disease conditions, can affect creatinine production, which confounds our interpretation of Clcr. Thus, there is an increasing interest in cystatin C as a potential alternative biomarker of kidney function. Cystatin C has advantages over SCr because it is less affected by age, gender, weight, and muscle mass. 43 Although cystatin C outperforms serum creatinine, its adoption as a replacement for creatinine as a GFR marker is constrained by factors such as wide‐availability of standardized assays, comorbidities like thyroid dysfunction, and interpretation in individuals receiving high doses of glucocorticoids. 44 Numerous formulas exist to estimate kidney function based on SCr, cystatin C, or a combination of both. Given the plethora of equations used to estimate kidney function, we review the dominant ones in Table 2 to explain their similarities and differences when modeling chronological age effects.
TABLE 2.
Summary of the major equations to estimate kidney function around the globe.
| Equation | Kidney function | Full equation |
|---|---|---|
| Cockroft‐Gault (1976) | eClcr | eClcr = [(140 − age) × body weight/ SCr × 72] × 0.85 [if female] |
| MDRD (2005) | eGFRcr | eGFRcr = 175 × (SCr)−1.154 × (age)−0.203 × 0.742 [if female] × 1.212 [if Black] |
| BIS1 (2012) | eGFRcr | eGFR = 3736 × (SCr)−0.87 × (age)−0.95 × 0.82 [if female] |
| BIS2 (2012) | eGFRcr‐cys | eGFR = 767 × cystatin C−0.61 × SCr −0.40 × age −0.57 × 0.87 [if female] |
| FAS (2016) | eGFRcr |
eGFRcr = for 2 ≤ age ≤ 40 years eGFRcr = for age > 40 years |
| CKD‐EPI creatinine (2021) | eGFRcr | eGFRcr = 142 × min (SCr/κ, 1)α × max (SCr/κ, 1)−1.200 × 0.9938age × 1.012 [if female] |
| CKD‐EPI cystatin (2021) | eGFRcys | eGFRcys = 133 × min (SCys/0.8, 1)−0.499 × max(SCys/0.8, 1)−1.328 × 0.996age × 0.932 [if female] |
| CKD‐EPI creatinine‐cystatin (2021) | eGFRcr‐cys | eGFRcr‐cys = 135 × min (SCr/κ, 1)α × max (SCr/κ, 1)−0.544 × min (SCys/0.8, 1)−0.323 × max (SCys/0.8, 1)−0.778 × 0.9961age × 0.963 [if female] |
Abbreviations: BIS, berlin initiative study; CKD‐EPI, chronic kidney disease epidemiology collaboration; eClcr, estimated creatinine clearance (mL/min); eGFRcr, estimated glomerular filtration rate using creatinine (mL/min/1.73 m2); eGFRcr‐cys, estimated glomerular filtration rate using creatinine and cystatin C (mL/min/1.73 m2); eGFRcys, estimated glomerular filtration rate using cystatin C (mL/min/1.73 m2); FAS, full age spectrum; MDRD, modification of diet in renal disease; SCr, serum creatinine (mg/dL); Scys, serum cystatin C (mg/L).
The most widely used kidney function equation for drug dosing is the Cockcroft‐Gault (CG) equation. The CG equation estimates Clcr, whereas the other equations estimate GFR. Regulatory agencies initially recommended the consideration of eGFR for drug dosing based on the modification of diet in renal disease (MDRD) equation. Because the utility of the MDRD equation is limited to individuals with a GFR less than 60 mL/min/1.73 m2, a revision of this formula through the Chronic Kidney Disease Epidemiology Collaboration (CKD‐EPI) was completed. 45 The MDRD study was also predominantly based on individuals between 18 and 70 years old. The CKD‐EPI equation was introduced in 2009 and, like the MDRD equation, included race as a factor. Three years later, two new CKD‐EPI equations were presented; one exchanged creatinine with cystatin C (CKD‐EPIcys), and the other integrated both cystatin C and creatinine (CKD‐EPIcr‐cys) to estimate the GFR. In the 2021 revision of the CKD‐EPI equation, the effect of race was removed from both versions because race is considered a social rather than a biological concept, and thus, its inclusion was debated. 46 Generally, the CKD‐EPI equation produces higher GFR estimates and lower CKD prevalence estimates than the MDRD. However, there is a small difference between these two equations in individuals above 70, where CKD‐EPI may increase CKD prevalence estimates. 31 The CKD‐EPI equation provides a less biased estimate of GFR than MDRD. A large cohort study compared MDRD with CKD‐EPI in adults aged 18–107 years. 31 Although CKD‐EPI had a significantly higher estimation for GFR than MDRD in this study, the differences between the two equations dropped off with age. Moreover, subjects who were 80 years old and above showed significantly lower CKD‐EPI eGFR. Another study compared the GFR calculated by CG and MDRD equations in individuals aged 65–111 years by normalizing CG Clcr to compare to MDRD to help readers recognize this difference better. 47 In this study, the mean GFR calculated by MDRD was much higher than the mean GFR calculated by CG (76.0 ± 24.0 mL/min/1.73 m2 vs. 67.9 ± 18.6 mL/min/1.73 m2). There was a strong positive correlation between this variation and age which raises the speculation that CG might be a better choice, especially in the oldest old patients. This variation also showed a negative correlation with BMI and SCr. 31 Accordingly, the precision and accuracy of MDRD and CG equations should be considered before using them in older adults because the difference between these two equations increases with age.
Two newer equations developed in Europe include the Berlin Initiative Study 1 and 2 (BIS1 and BIS2) in 2012. 48 The BIS equations aimed to improve eGFR accuracy in individuals over 70 years old using SCr (BIS1) or the combination of SCr and serum cystatin C (SCys; BIS2). This aim has clinical relevance because it reduces the likelihood of misclassifying individuals with a GFR above or below 60 mL/min/1.73 m2. Schaeffner et al. 48 found that the new BIS2 equation had the lowest bias, followed by the creatinine‐based BIS1 and CG equations. However, all other equations significantly overestimated GFR. The lowest misclassification rate among all equations was observed with the BIS2 equation, but among the creatinine‐based equations, the lowest misclassification rate was reported for BIS1.
Among 610 patients aged 70 years or above, the measured GFR was less than 60 mL/min/1.73 m2 in 47.9% of patients. The BIS equations estimated similar proportions of patients with a GFR less than 60 mL/min/1.73 m2 (BIS1, 50.4% and BIS2, 47.4%;). Although not substantially different, the authors recommended the BIS2 equation to be the preferred method to estimate GFR in older adults over 70 years old with normal or mild to moderately reduced kidney function. However, in cases where cystatin C is not available, the BIS1 equation can be considered a reliable alternative to BIS2. In another study in patients greater than or equal to 70 years with cardiovascular disease, the BIS1 equation demonstrated a significantly better accuracy in risk stratification of CKD in older adult patients with cardiovascular disease, compared to the CKD‐EPI (2012) equation. 49
As noted, an age‐dependent decline in kidney function typically occurs after age 40 years. The Full Age Spectrum (FAS) equation was designed to encompass this principle. Introduced by Pottel et al. 50 in 2016, the FAS equation is a piece‐wise equation with a breakpoint at age 40 years. In addition, SCr is dependent on age and gender, and, as such, the FAS equation normalizes the SCr with Q (SCr/Q), where Q is the mean or median SCr value that accounts for age and sex and its quantities are reported based on a previous SCr reference interval study. The FAS equation has been formulated to encompass the entire age spectrum and can be a powerful alternative to measuring the eGFR in all age groups, even older adults. For example, in a cohort of adult patients with obstructive nephropathy, the FAS equation showed the highest diagnostic accuracy than the MDRD and CKD‐EPI (2012) equations and it seemed closer to ideal for estimating GFR in this population. 51
Figure 2 illustrates the fractional change in kidney function with age based on the structural model of the equations in Table 2. The purpose of this illustration is to show the reader the differences between these equations rather than suggesting that one is better than the other. Figure 2 shows wide variability in how kidney function decline is expected as a function of age. The CG equation assumes a linear decrease with age, whereas the other equations are modeled as exponential decline functions. The BIS1 and BIS2 equations have faster decline trajectories than the other equations. The CKD‐EPI and MDRD predict lower age‐related declines (30%–40% loss) than the CG equation (70% loss).
FIGURE 2.

Fractional change in kidney function over chronological age with key contemporary kidney function equations. CKD‐EPI, Chronic Kidney Disease Epidemiology Collaboration; FAS, Full Age Spectrum; eClcr, estimated creatinine clearance; MDRD, modification of diet in renal disease.
In contrast, the FAS equation does not include an age‐related decline until age 40 years, followed by an age‐related decline that predicts a 50% loss of function between age 40 and 100 years. Although this illustration may suggest that one equation better captures kidney function age‐decline trajectories, an important consideration is whether drug clearance reductions follow a similar path. Few population PK studies have compared these eGFR and Clcr equations to determine the optimal equation for predicting drug clearance for drugs primarily eliminated by the kidneys with aging. More work is needed to build consensus around a singular eGFR or eClcr model that accurately estimates drug clearance and kidney function declines with aging.
VANCOMYCIN CLEARANCE CHANGES ACROSS THE LIFESPAN THROUGH POPULATION‐PK MODELS
Multiple studies have shown that kidney function does not decline until after age 40 years unless there are non‐age‐related disease factors. 52 This point is evident in the FAS model for kidney function. Based on Figure 2, the CG model projects a 50% decline in kidney function by the time an individual reaches the age of 80 years. With that in mind, we are curious to find out the expected change in drug clearance by these models based on two assumptions; first, a Clcr 120 mL/min or a GFR 120 mL/min/1.73 m2 in a 40‐year‐old patient, and second, a Clcr 60 mL/min or a GFR 60 mL/min/1.73 m2 in an 80‐year‐old patient. To answer this question, we rely on a model substrate vancomycin because it has limited metabolism and is excreted unchanged in the urine. 53 , 54 Vancomycin is a glycopeptide antibiotic widely used to treat gram‐positive infections, particularly methicillin‐resistant Staphylococcus aureus infections in older adults. 55 , 56
Table 3 summarizes some of the previous population‐PK studies of vancomycin in adults. As mentioned in the Table 3 footnotes, the most common model of kidney function used to estimate vancomycin clearance is CG (7 studies). The Clcr guides the dosing adjustment of vancomycin in older adults. 55 Table 3 proves this parameter has been consistently repeated in the vancomycin population‐PK models for clearance. In all of the summarized population PK models, Clcr was reported as the significant covariate for vancomycin clearance, except for one study in which the cystatin C concentration was the significant covariate. 57 Along with the Clcr, age was also reported as a significant covariate in three models. The mean vancomycin clearance estimate for each summarized model was calculated based on the two assumptions above. Results of this investigation revealed that the median (min, max) vancomycin mean clearance estimate for the assumed 40‐year‐old man with a normal kidney function was 4.60 (3.30, 6.30), and for the 80‐year‐old man with a 50% reduction in the kidney function was 2.63 (1.89, 3.56). Additionally, the median percentage reduction in vancomycin clearance was 41.20 (29.94, 51.25).
TABLE 3.
Summary of the PopPK models of vancomycin clearance in the (older) adult population.
| Author (year) | Study sample | Sample size | Age (years) | Vancomycin clearance model | Vancomycin mean CL estimate (L/h) | ||
|---|---|---|---|---|---|---|---|
| 40 years a | 80 years b | % Reduction | |||||
| Sanchez et al. (2010) | Younger adult and older adult patient | 141 | 55 ± 14.58 | Cl (L/h) = 0.157 + 0.563 × Clcr | 4.21 | 2.18 | 48.22 |
| Tanaka et al. (2010) | Japanese patients with MRSA infection | 164 | 74 (17–95) | Cl (L/h) = 0.875 × eGFRcys | 6.3 | 3.15 | 50.00 |
| Purwonugroho et al. (2012) | Thai adult patients | 212 | 66.6 ± 18.4 | Cl (L/h) = 0.044 × Clcr (mL/min) | 5.28 | 2.64 | 50.00 |
| He et al. (2014) | Chinese patients | 260 | 76.8 ± 11.2 | Cl (L/h) = (1.71 + 8.31 × (1− e −0.0113(L/h)×Clcr)) × 0.475(Age/72) | 5.21 | 2.54 | 51.25 |
|
Dedkaew et al. (2015) |
Critically ill patients in Thailand | 138 | 65.7 ± 17.6 | tv Cl (L/h) = 0.27 × Clcr 0.63 | 5.51 | 3.56 | 35.39 |
| Ji et al. (2018) | Chinese adult patients | 160 | 78 (42–95) | Cl (L/h) = 2.829 × (1 + 0.00842 × (Clcr−80))] × ()0.08143 × e η1 | 3.98 | 2.34 | 41.2 |
| Shen et al. (2018) | Chinese adult in‐house patients | 380 | 61 (49–74) | Cl (L/h) = 3.87 × (Clcr /86)0.519 × e ηCL | 4.60 | 3.21 | 30.22 |
| Zhou et al. (2019) | Chinese older adult patients with pulmonary infections | 70 | 78.3 ± 6.96 | Cl (L/h) = 2.45 × (Clcr/56.28)0.542 | 3.69 | 2.54 | 31.16 |
| Kovacevic et al. (2020) |
Critically ill septic patients in Bosnia |
73 | 56.9 ± 17.0 | Cl (L/h) = 0.024 × Clcr + 1.93 | 4.81 | 3.37 | 29.94 |
| Zhao et al. (2021) | Chinese patients with augmented renal clearance | 209 | 66.0 ± 16.4 |
Cl (L/h) = × e η1 |
3.30 | 1.89 | 42.73 |
| Garreau et al. (2021) | Critically ill patients in France | 78 | 68.9 ± 12.3 | CLi = 0.79 × × with ηCli ~ N (0, ωCL) | 4.34 | 2.63 | 39.40 |
Note: Cockcroft‐Gault (CG) equation was predominantly used to model vancomycin clearance (seven studies). Equation used to model vancomycin clearance in one study (Tanaka et al.) was Hoek's formula and in three studies was not given (Sanchez et al., He et al., and Shen et al.).
Abbreviations: CL, clearance; Clcr, creatinine clearance; eη, interindividual variations of CL. MRSA, methicillin‐resistant Staphylococcus aureus; PopPK, population pharmacokinetic.
Mean estimates of vancomycin clearance based on a typical patient that is 40 years old with an estimated creatinine clearance or glomerular filtration rate of 120 mL/min or 120 mL/min/1.73 m2.
Mean estimates of vancomycin clearance based on a typical patient that is 80 years old with an estimated creatinine clearance or glomerular filtration rate of 60 mL/min or 60 mL/min/1.73 m2.
These findings align with our observations in Figure 2. As noted in Figure 2, a 50% reduction in kidney function at the age of 80 years is predicted by CG, which is close to the median percentage reduction in vancomycin clearance (41.2%). The FAS equation, which considers the age‐dependent decline in kidney function after age 40 years, predicts a slower kidney function loss than CG, as the kidney function reaches a 50% reduction around the age of 100 years (Figure 2). This prediction becomes even more gradual with the CKD‐EPIcr and CKD‐EPIcr‐cys equations and may require further improvements for the CKD‐EPI equations to adjust them for dosing in older adults. Although the CG may be better capable of predicting changes in kidney function with aging, this assessment is confounded by the fact that it was the most dominant equation used in these studies. Population PK models that directly compare these alternate equations are necessary to verify these projections.
SUMMARY AND FUTURE DIRECTIONS
Human life expectancy continues to increase, and the number of individuals over the chronological age of 80 years or older will double in the United States by 2050. Whereas it is evident that aging leads to declines in organ function and drug clearance, the rate at which these occur is not. Current models of kidney function, which is the principal dose adjustment variable, assume linear and nonlinear declines with very different trajectories. We evaluated some of the clearance models of vancomycin as a drug with limited metabolism and primary kidney elimination to estimate changes in clearance with age relative to the expected changes in kidney function with age. A median of 41.2% reduction in vancomycin clearance is predicted between the ages of 40 and 80 years that aligns well with some kidney function estimation equations. Although this is helpful from a population level, they may not be precise at the individual case level. Recent work with aging clocks and drugs to alter the pace of aging highlight this disconnect between what is observable and easily quantified (chronological age) to what is not (biological age). This narrative review seeks to inform clinical translational scientists about these developments from a dosing perspective. Replacing chronological age with biological age may improve the health outcomes of older adult patients by reducing the risk of adverse drug events through optimal dose selection and ultimately, the development of new models for age‐dependent changes in drug clearance to better define doses in older adults. It is also critical to independently develop GFR estimation equations that incorporate biological age. Further investigations that focus on understanding the usefulness of biological aging as a tool for pharmacotherapy decisions are necessary. Ancillary studies from existing geriatric pharmacology studies that can quantify biological age should be encouraged to improve our scientific understanding of its pharmacologic usefulness and ultimately improve the precision of pharmacotherapy in this specific population.
FUNDING INFORMATION
No funding was received for this work.
CONFLICT OF INTEREST STATEMENT
The authors declared no competing interests for this work.
Alikhani R, Pai MP. Reconsideration of the current models of estimated kidney function‐based drug dose adjustment in older adults: The role of biological age. Clin Transl Sci. 2023;16:2095‐2105. doi: 10.1111/cts.13643
REFERENCES
- 1. Dziechciaz M, Filip R. Biological psychological and social determinants of old age: bio‐psycho‐social aspects of human aging. Ann Agric Environ Med. 2014;21:835‐838. [DOI] [PubMed] [Google Scholar]
- 2. Rutledge J, Oh H, Wyss‐Coray T. Measuring biological age using omics data. Nat Rev Genet. 2022;23:715‐727. [DOI] [PMC free article] [PubMed] [Google Scholar]
- 3. World Health Organization . Aging and health. 2022; 1 October.
- 4. Donohoe KL, Price ET, Gendron TL, Slattum PW. Geriatrics: the aging process in humans and its effects on physiology. DiPiro JT, Yee GC, Posey LM, Haines ST, Nolin TD, Ellingrod V, eds. Pharmacotherapy: A Pathophysiologic Approach, 11e. McGraw‐Hill; 2020. [Google Scholar]
- 5. Lee SB, Oh JH, Park JH, Choi SP, Wee JH. Differences in youngest‐old, middle‐old, and oldest‐old patients who visit the emergency department. Clin Exp Emerg Med. 2018;5:249‐255. [DOI] [PMC free article] [PubMed] [Google Scholar]
- 6. Grimsrud KN, Sherwin CMT, Constance JE, et al. Special population considerations and regulatory affairs for clinical research. Clin Res Regul Aff. 2015;32:47‐56. [DOI] [PMC free article] [PubMed] [Google Scholar]
- 7. Liu Q, Schwartz JB, Slattum PW, et al. Roadmap to 2030 for drug evaluation in older adults. Clin Pharmacol Ther. 2022;112:210‐223. [DOI] [PubMed] [Google Scholar]
- 8. Dagli RJ, Sharma A. Polypharmacy: a global risk factor for elderly people. J Int Oral Health. 2014;6:i‐ii. [PMC free article] [PubMed] [Google Scholar]
- 9. Klotz U. Pharmacokinetics and drug metabolism in the elderly. Drug Metab Rev. 2009;41:67‐76. [DOI] [PubMed] [Google Scholar]
- 10. Veronin MA. An atypical case of extreme polypharmacy. Drug Healthc Patient Saf. 2022;14:19‐26. [DOI] [PMC free article] [PubMed] [Google Scholar]
- 11. Campbell D, Harinath G. Transforming how we see aging: Biological age diagnostics. Longevity. https://technology.longevity.technology/research/report/biological‐age‐diagnostics‐report/
- 12. Lim WJ, Kim KH, Kim JY, Jeong S, Kim N. Identification of DNA‐methylated CpG Islands associated with gene silencing in the adult body tissues of the Ogye chicken using RNA‐seq and reduced representation bisulfite sequencing. Front Genet. 2019;10:346. [DOI] [PMC free article] [PubMed] [Google Scholar]
- 13. Horvath S. DNA methylation age of human tissues and cell types. Genome Biol. 2013;14:R115. [DOI] [PMC free article] [PubMed] [Google Scholar]
- 14. Hannum G, Guinney J, Zhao L, et al. Genome‐wide methylation profiles reveal quantitative views of human aging rates. Mol Cell. 2013;49:359‐367. [DOI] [PMC free article] [PubMed] [Google Scholar]
- 15. Lu AT, Quach A, Wilson JG, et al. DNA methylation GrimAge strongly predicts lifespan and healthspan. Aging (Albany NY). 2019;11:303‐327. [DOI] [PMC free article] [PubMed] [Google Scholar]
- 16. Levine ME, Lu AT, Quach A, et al. An epigenetic biomarker of aging for lifespan and healthspan. Aging (Albany NY). 2018;10:573‐591. [DOI] [PMC free article] [PubMed] [Google Scholar]
- 17. Belsky DW, Caspi A, Corcoran DL, et al. DunedinPACE, a DNA methylation biomarker of the pace of aging. Elife. 2022;11:e73420. [DOI] [PMC free article] [PubMed] [Google Scholar]
- 18. Carnes BA. Can any biomarker predict the temporal behavior of aging? Gerontology. 2015;62:63‐65. [DOI] [PubMed] [Google Scholar]
- 19. Shamir L. Composite aging markers can Be used for quantitative profiling of aging. Gerontology. 2015;62:66‐68. [DOI] [PubMed] [Google Scholar]
- 20. Diebel LWM, Rockwood K. Determination of biological age: geriatric assessment vs biological biomarkers. Curr Oncol Rep. 2021;23:104. [DOI] [PMC free article] [PubMed] [Google Scholar]
- 21. Muntner P. Longitudinal measurements of renal function. Semin Nephrol. 2009;29:650‐657. [DOI] [PubMed] [Google Scholar]
- 22. Kyriakopoulos C, Gupta V. Renal Failure Drug Dose Adjustments. StatPearls; 2022. [PubMed] [Google Scholar]
- 23. Yin J, Wang J. Renal drug transporters and their significance in drug‐drug interactions. Acta Pharm Sin B. 2016;6:363‐373. [DOI] [PMC free article] [PubMed] [Google Scholar]
- 24. Weinstein JR, Anderson S. The aging kidney: physiological changes. Adv Chronic Kidney Dis. 2010;17:302‐307. [DOI] [PMC free article] [PubMed] [Google Scholar]
- 25. Gekle M. Kidney and aging ‐ a narrative review. Exp Gerontol. 2017;87:153‐155. [DOI] [PubMed] [Google Scholar]
- 26. Swärd P, Tofik R, Bakoush O, Torffvit O, Nilsson PM, Christensson A. Patterns of urinary albumin and IgM associate with markers of vascular ageing in young to middle‐aged individuals in the Malmö offspring study. BMC Cardiovasc Disord. 2020;20:358. [DOI] [PMC free article] [PubMed] [Google Scholar]
- 27. Hill GS, Heudes D, Jacquot C, Gauthier E, Bariéty J. Morphometric evidence for impairment of renal autoregulation in advanced essential hypertension. Kidney Int. 2006;69:823‐831. [DOI] [PubMed] [Google Scholar]
- 28. Mark Ruscin J, Linnebur SA. Pharmacokinetics in Older Adults. Merck Manual Professional Version. Modified Sep 2022. merckmanuals.com/professional/geriatrics/drug‐therapy‐in‐older‐adults/pharmacokinetics‐in‐older‐adults/ [Google Scholar]
- 29. Glassock RJ, Winearls C. Ageing and the glomerular filtration rate: truths and consequences. Trans Am Clin Climatol Assoc. 2009;120:419‐428. [PMC free article] [PubMed] [Google Scholar]
- 30. Bolignano D, Mattace‐Raso F, Sijbrands EJ, Zoccali C. The aging kidney revisited: a systematic review. Ageing Res Rev. 2014;14:65‐80. [DOI] [PubMed] [Google Scholar]
- 31. Basile G, Crucitti A, Fusco S, et al. Estimating glomerular filtration rate in centenarians: comparison of the chronic kidney disease epidemiology collaboration (CKD‐EPI) and modification of diet in renal disease (MDRD) study equations. Int Urol Nephrol. 2014;46:481‐482. [DOI] [PubMed] [Google Scholar]
- 32. Joseph S, Nicolson TJ, Hammons G, Word B, Green‐Knox B, Lyn‐Cook B. Expression of drug transporters in human kidney: impact of sex, age, and ethnicity. Biol Sex Differ. 2015;6:4. [DOI] [PMC free article] [PubMed] [Google Scholar]
- 33. Xu YJ, Wang Y, Lu YF, Xu SF, Wu Q, Liu J. Age‐associated differences in transporter gene expression in kidneys of male rats. Mol Med Rep. 2017;15:474‐482. [DOI] [PubMed] [Google Scholar]
- 34. Graham LA, Dominiczak AF, Ferreri NR. Role of renal transporters and novel regulatory interactions in the TAL that control blood pressure. Physiol Genomics. 2017;49:261‐276. [DOI] [PMC free article] [PubMed] [Google Scholar]
- 35. Drozdzik M, Drozdzik M, Oswald S. Membrane carriers and transporters in kidney physiology and disease. Biomedicine. 2021;9(4):426. [DOI] [PMC free article] [PubMed] [Google Scholar]
- 36. Gattineni J, Baum M. Developmental changes in renal tubular transport‐an overview. Pediatr Nephrol. 2015;30:2085‐2098. [DOI] [PMC free article] [PubMed] [Google Scholar]
- 37. Zou W, Shi B, Zeng T, et al. Drug transporters in the kidney: perspectives on species differences, disease status, and molecular docking. Front Pharmacol. 2021;12:746208. [DOI] [PMC free article] [PubMed] [Google Scholar]
- 38. Frame AA, Wainford RD. Mechanisms of altered renal sodium handling in age‐related hypertension. Am J Physiol Renal Physiol. 2018;315:F1‐F6. [DOI] [PMC free article] [PubMed] [Google Scholar]
- 39. Langlois V. Laboratory evaluation at different ages. In: Geary DF, Schaefer F, eds. Comprehensive Pediatric Nephrology. Mosby; 2008:39‐54. [Google Scholar]
- 40. Wieczorowska‐Tobis K, Niemir ZI, Guzik P, Mossakowska M. Kidney function estimated with different formulas in centenarians. Rocz Akad Med Bialymst. 2004;49:219‐221. [PubMed] [Google Scholar]
- 41. Devanand V, Chithrapavai SU. Correlation of 2 hours and 24 hours creatinine clearance in renal donors after unilateral nephrectomy. J Clin Diagn Res. 2013;7:2119‐2121. [DOI] [PMC free article] [PubMed] [Google Scholar]
- 42. da Silva AB, Molina Mdel C, Rodrigues SL, Pimentel EB, Baldo MP, Mill JG. Correlation between the creatinine clearance in the urine collected during 24 hours and 12 hours. J Bras Nefrol. 2010;32:165‐172. [PubMed] [Google Scholar]
- 43. Woo KS, Choi JL, Kim BR, Kim JE, Han JY. Clinical usefulness of serum cystatin C as a marker of renal function. Diabetes Metab J. 2014;38:278‐284. [DOI] [PMC free article] [PubMed] [Google Scholar]
- 44. Çuhadar S, Cystatin C as a biomarker. In: Patel VB, ed. Biomarkers in Kidney Disease. Springer Netherlands, Dordrecht. 2015:1‐17. [Google Scholar]
- 45. Munikrishnappa D. Chapter 6: Limitations of various formulae and other ways of assessing GFR in the elderly: is there a role for Cystatin C? American Society of Nephrology. 2009.
- 46. Fu EL, Coresh J, Grams ME, et al. Removing race from the CKD‐EPI equation and its impact on prognosis in a predominantly white European population. Nephrol Dial Transplant. 2022;38:119‐128. [DOI] [PMC free article] [PubMed] [Google Scholar]
- 47. Wieczorowska‐Tobis K, Niemir ZI, Guzik P, Breborowicz A, Oreopoulos DG. Difference in estimated GFR with two different formulas in elderly individuals. Int Urol Nephrol. 2006;38:381‐385. [DOI] [PubMed] [Google Scholar]
- 48. Schaeffner ES, Ebert N, Delanaye P, et al. Two novel equations to estimate kidney function in persons aged 70 years or older. Ann Intern Med. 2012;157:471‐481. [DOI] [PubMed] [Google Scholar]
- 49. Tarantini L, McAlister FA, Barbati G, et al. Chronic kidney disease and prognosis in elderly patients with cardiovascular disease: comparison between CKD‐EPI and Berlin initiative Study‐1 formulas. Eur J Prev Cardiol. 2020;23:1504‐1513. [DOI] [PubMed] [Google Scholar]
- 50. Pottel H, Hoste L, Dubourg L, et al. An estimated glomerular filtration rate equation for the full age spectrum. Nephrol Dial Transplant. 2016;31:798‐806. [DOI] [PMC free article] [PubMed] [Google Scholar]
- 51. Cai K, Chai L, Luo Q, Dai Z, Wu L, Hong Y. Full age spectrum equation versus CKD‐EPI and MDRD equations to estimate glomerular filtration rate in adults with obstructive nephropathy. J Int Med Res. 2019;47:2394‐2403. [DOI] [PMC free article] [PubMed] [Google Scholar]
- 52. Chou YH, Chen YM. Aging and renal disease: old questions for new challenges. Aging Dis. 2021;12:515‐528. [DOI] [PMC free article] [PubMed] [Google Scholar]
- 53. Cao M, Feng Y, Zhang Y, Kang W, Lian K, Ai L. Studies on the metabolism and degradation of vancomycin in simulated in vitro and aquatic environment by UHPLC‐triple‐TOF‐MS/MS. Sci Rep. 2018;8:15471. [DOI] [PMC free article] [PubMed] [Google Scholar]
- 54. Zaric RZ, Milovanovic J, Rosic N, et al. Pharmacokinetics of vancomycin in patients with different renal function levels. Open Med (Wars). 2018;13:512‐519. [DOI] [PMC free article] [PubMed] [Google Scholar]
- 55. Barber KE, Bell AM, Stover KR, Wagner JL. Intravenous vancomycin dosing in the elderly: a focus on clinical issues and practical application. Drugs Aging. 2016;33:845‐854. [DOI] [PMC free article] [PubMed] [Google Scholar]
- 56. Ji XW, Ji SM, He XR, Zhu X, Chen R, Lu W. Influences of renal function descriptors on population pharmacokinetic modeling of vancomycin in Chinese adult patients. Acta Pharmacol Sin. 2018;39:286‐293. [DOI] [PMC free article] [PubMed] [Google Scholar]
- 57. Tanaka A, Aiba T, Otsuka T, et al. Population pharmacokinetic analysis of vancomycin using serum cystatin C as a marker of renal function. Antimicrob Agents Chemother. 2010;54:778‐782. [DOI] [PMC free article] [PubMed] [Google Scholar]