

Abstract
Increasing demand for glutaminase (GLS) due to high rates of glutamine metabolism is considered one of the hallmarks of malignancy. In parallel, cancer antigen 125 (CA‐125) is a commonly used ovarian tumor marker. This study aimed to compare the roles of GLS and CA‐125 in distinguishing between benign and malignant ovarian tumors. The research was conducted as a comparative study, enrolling 156 patients with ovarian tumors. Preoperative serum CA‐125 and GLS levels were analyzed to evaluate their effectiveness in distinguishing between benign and malignant ovarian tumors. The results revealed that the mean levels of CA‐125 and GLS were significantly higher in malignant ovarian tumors compared with benign ones (389.54 ± 494.320 vs. 193.15 ± 529.932 (U/mL) and 17.37 ± 12.156 vs. 7.48 ± 4.095 (μg/mL), respectively). The CA‐125 and GLS cutoff points of 108.2 U/mL and 18.32 μg/mL, respectively, were associated with malignant ovarian tumors. Multivariate analyses showed that GLS had higher predictive capabilities compared with CA‐125 (odds ratio 9.4 vs. 2.1). The accuracy of using GLS combined with CA‐125 was higher than using CA‐125 alone (73.1% vs. 68.8%). In conclusion, higher levels of CA‐125 and GLS are associated with malignant ovarian tumors. GLS outperforms CA‐125 in distinguishing between benign and malignant ovarian tumors. The combination of GLS and CA‐125 demonstrated improved accuracy for distinguishing benign and malignant ovarian tumors when compared with using CA‐125 alone.
Study Highlights.
WHAT IS THE CURRENT KNOWLEDGE ON THE TOPIC?
Cancer antigen 125 (CA‐125) is a commonly used ovarian tumor marker; however, unfortunately its sensitivity and specificity are limited.
WHAT QUESTION DID THIS STUDY ADDRESS?
Can glutaminase (GLS) be used as an ovarian tumor marker?
WHAT DOES THIS STUDY ADD TO OUR KNOWLEDGE?
GLS can be used as an ovarian tumor biomarker. When combined with CA‐125, the combination has a higher accuracy for predicting benign and malignant ovarian tumors than using CA‐125 alone.
HOW MIGHT THIS CHANGE CLINICAL PHARMACOLOGY OR TRANSLATIONAL SCIENCE?
These findings highlight the potential value of combining GLS with CA‐125 as a biomarker for enhanced diagnostic accuracy in ovarian tumor detection.
INTRODUCTION
According to the Global Cancer Observatory (GLOBOCAN), ovarian cancer is the nineth most common malignant tumor in worldwide. In 2020, there were 313,959 women diagnosed with ovarian cancer, and the mortality was as high as 207,252. 1 Ovarian cancer is often called a “silent killer” because most patients are diagnosed at an advanced stage due to ineffective screening.
Early detection of ovarian cancer is crucial as it improves treatment outcomes and overall survival rates. Several methods are usually used for ovarian cancer screening, and these include pelvic examination, abdominal and transvaginal ultrasound, magnetic resonance imaging (MRI), computed tomography (CT) scan, positron emission tomography (PET) scan, and the use of serum biomarkers. Unfortunately, not every hospital has comprehensive supportive equipment. Also, pelvic examination alone is not recommended for screening ovarian tumors due to its limited effectiveness in reducing the morbidity and mortality associated with ovarian cancer. 2 Conversely, transvaginal ultrasound is a valuable tool for detecting abnormalities in ovarian volume and morphology. 3 While it can assist in identifying potential ovarian tumors, it is less reliable in accurately differentiating between benign and malignant tumors. 3 Therefore, the combination of pelvic examination, ultrasound, and serum biomarkers with high sensitivity and specificity might improve the accuracy of ovarian cancer screening.
Cancer antigen 125 (CA‐125) is a serological marker used for detecting and evaluating treatment response in patients diagnosed with ovarian cancer, specifically epithelial type. 4 Unfortunately, due to its limited sensitivity and specificity, using CA‐125 alone for ovarian cancer screening may not be sufficient, especially in detecting non‐epithelial types of malignant or benign ovarian tumors such as endometriosis, clear cell, mucinous ovarian cancer, and solid ovarian tumors. 4 , 5 , 6
Glutaminase (GLS) plays a critical role in both normal cell metabolism and tumor metabolism, influencing various aspects of tumor growth and cell fate. In normal cell metabolism, GLS participates in the breakdown of glutamine, an amino acid essential for energy production and the synthesis of macromolecules. However, in tumor metabolism, GLS is often upregulated, promoting increased glutamine consumption by cancer cells. 7 Glutaminolysis was also found to increase in metastasized compared with the non‐metastasized ovarian tumor. 8 , 9 An essential step in utilizing glutamine is converting glutamine to glutamate (glutaminolysis) via the mitochondrial enzyme GLS. 10 , 11 GLS expression increases in some malignancies, such as colorectal carcinoma, breast cancer, and ovarian cancer. In ovarian cancer, GLS expression has been found to increase four‐fold in metastasized compared with the non‐metastasized ovarian cancer. 12 , 13
Therefore, we proposed GLS 1 or kidney‐type GLS as a novel biomarker to distinguish benign and malignant tumors. This study aimed to determine the role of serum GLS‐1 in differentiating benign and malignant ovarian tumors and compare its effectiveness with the commonly used biomarker, serum CA‐125. Additionally, the study also aimed to analyze the combination of serum GLS and CA‐125 in order to assess its potential for improved differentiation between benign and malignant ovarian tumors.
METHODS
Study design and patients
This comparative study enrolled all ovarian tumor patients who underwent surgery from 2019 to 2022 at Dr. Hasan Sadikin General Hospital, Bandung, Indonesia. The exclusion criteria were as follows: (1) had another primary tumor; (2) had a metabolic disease; (3) infected ovarian tumor; (4) non‐neoplastic ovarian tumor; and (5) incomplete data. The Institutional Review Board of Dr. Hasan Sadikin Central Hospital approved this study (LB.02.01/X.6.5/219/2021). All participants provided written informed consent, and all methods were carried out in accordance with relevant guidelines and regulations.
Data collection
We obtained the patient's age and cancer stage from their medical record. A blood sample was collected during a routine pre‐surgery examination to obtain serum GLS and CA‐125. The blood sample was then centrifuged at 1000 rpm for 20 min. The sample was stored in an aliquot at either −20°C or −80°C for later use. For GLS, the serum was diluted with 0.01 mol/L phosphate‐buffered saline (pH = 7.0–7.2) before being analyzed with an ELISA kit for GLS 1 (SEJ026Hu, Cloud‐Clone Corp.). Meanwhile, CA‐125 was measured by chemiluminescent microparticle immunoassay (CMIA) (Abbott Diagnostics). Both measurements followed relevant guidelines from the manufacturer and were done by an experienced pathologist. We determined the histopathology diagnosis (benign and malignant ovarian tumors) and cells of origin (epithelium, sex cord, and germ cell) according to histopathology results from the tissue biopsy taken during surgery and examined by an experienced pathologist, and classified according to the World Health Organization (WHO) classification of ovarian tumors.
Statistical analysis
We used SPSS version 24 for Windows for statistical analysis. The patient's age, GLS, and CA‐125 were continuous variables presented as mean ± standard deviation (SD). Meanwhile, histopathology diagnosis and cancer stage were categorical variables presented as frequency. Bivariate analysis was performed to compare age, serum GLS, and CA‐125 values with the histopathology diagnosis using a t‐test or Mann–Whitney. To compare the cancer stage and cells of origin with the histopathology diagnosis, we used Chi‐square or Kolmogorov–Smirnov. Multivariate analyses were performed to find the correlation between related variables (GLS and CA‐125) and the histopathology diagnosis using binary logistic regression. Meanwhile, the correlation between GLS and CA‐125 was analyzed using Spearman's test. To determine the optimal cutoff points for GLS, CA‐125, and the combination of GLS and CA‐125 values and assess their performance in distinguishing between benign and malignant tumors, we conducted receiver operating characteristic (ROC) curve analysis. Additionally, we calculated the area under the ROC curve (AUC) values, which provided a quantitative measure of the marker's overall diagnostic performance. A difference was considered statistically significant at a p‐value of <0.05.
Determining the cutoff point for the combination of GLS and CA‐125 serum
The statistical analysis to determine the cutoff point for the combination of GLS and CA‐125 involved several steps. First, the CA‐125 value was categorized based on predetermined cutoff points obtained from bivariate analyses. A value of 1 was assigned to CA‐125 measurements below the cutoff point, while a value of 2 was assigned to CA‐125 measurements above the cutoff point. Conversely, the GLS value was treated as a continuous variable since it was already in that form and did not require any transformation. This maintained the original representation of GLS in the analysis. To assess the combined effect of CA‐125 and GLS, the categorized CA‐125 values were multiplied by the corresponding GLS values. This multiplication resulted in combination values, which integrated the information from both markers.
RESULTS
Demographic and clinical features
We successfully recruited 158 ovarian tumor patients from 2019 to 2021. Unfortunately, two patients (1.2%) were excluded due to incomplete data, and so 156 patients were included in the study, as presented in Table 1. According to their histopathology results, 80 patients (51.3%) were diagnosed with malignant ovarian tumors, and the remaining 72 patients (48.7%) were diagnosed with benign ovarian tumors. The average age of patients with malignant tumors was significantly higher than that of patients with benign tumors (45.68 ± 9.679 vs. 38.70 ± 13.712 years). In patients with malignant tumors, the majority were diagnosed with stage III disease (51.3%). We found that the tumors mainly originated from epithelium for both the malignant and benign groups (90.0% and 88.2%, respectively), but this finding was not statistically significant. Additionally, we assessed the time from initial sample collection to diagnosis, for which there was no difference between the two groups (p > 0.05).
TABLE 1.
Comparison of characteristics of study patients with histopathology results in ovarian tumor patients.
| Characteristic | Malignant tumor (n = 80) | Benign tumor (n = 76) | P value |
|---|---|---|---|
| Age (years) | |||
| Mean ± SD | 45.68 ± 9.679 | 38.70 ± 13.712 | 0.0001 a |
| Median | 47.00 | 39.00 | |
| Range (min–max) | 16.00–62.00 | 7.00–70.00 | |
| Stage | |||
| I | 19 (23.8%) | – | – |
| II | 14 (17.5%) | – | |
| III | 41 (51.3%) | – | |
| IV | 6 (7.5%) | – | |
| Time to diagnosis b (h) | |||
| Mean ± SD | 38.40 ± 11.832 | 37.26 ± 12.013 | 0.551 c |
| Median | 48.00 | 48.00 | |
| Range (min–max) | 24.00–48.00 | 24.00–48.00 | |
| Origin of the tumor | |||
| Epithelium | 72 (90.0%) | 67 (88.2%) | 1.000 a |
| Sex cord | 3 (3.8%) | 2 (2.6%) | |
| Germ cell | 5 (6.3%) | 7 (9.2%) | |
Abbreviation: SD, standard deviation
T‐test.
Time from sample collection to diagnosis.
Mann–Whitney test.
GLS serum compared with CA‐125 serum
We found that patients diagnosed with malignant ovarian tumors tended to have higher GLS values than patients diagnosed with benign ovarian tumors (17.37 ± 12.156 μg/mL vs. 7.48 ± 4.095 μg/mL) (p = 0.0001) (Table 2). Figure 1 illustrates the distribution of GLS values in both groups. Meanwhile, CA‐125 serum in patients with malignant ovarian tumors was statistically higher than in patients with benign ovarian tumors (389.54 ± 494.320 U/mL vs. 193.15 ± 529.932 U/mL) (p = 0.0001) (Table 2). A visual representation of the distribution pattern of CA‐125 in both groups is illustrated in Figure 2.
TABLE 2.
Comparison of pre‐surgical glutaminase and cancer antigen 125 levels with histopathology results in ovarian tumor patients.
| Parameter | Malignant tumor | Benign tumor | P value |
|---|---|---|---|
| (N = 80) | (N = 76) | ||
| GLS (μg/mL) | |||
| Mean ± SD | 17.37 ± 12.156 | 7.48 ± 4.095 | 0.0001 a |
| Median | 16.29 | 6.73 | |
| Range (min–max) | 1.82–38.01 | 1.18–27.54 | |
| CA‐125 (U/mL) | |||
| Mean ± SD | 389.54 ± 494.320 | 193.15 ± 529.932 | 0.0001 a |
| Median | 156.6 | 62.60 | |
| Range (min–max) | 4.29–2003.50 | 5.60–3916.00 | |
| GLS + CA‐125 | |||
| Mean ± SD | 27.98 ± 21.519 | 9.25 ± 6.204 | 0.0001 b |
| Median | 23.03 | 7.43 | |
| Range (min–max) | 1.82–76.02 | 1.54–36.64 | |
Abbreviations: CA‐125, cancer antigen 125; GLS, glutaminase; SD, standard deviation.
T‐test.
Mann–Whitney, p < 0.05.
FIGURE 1.
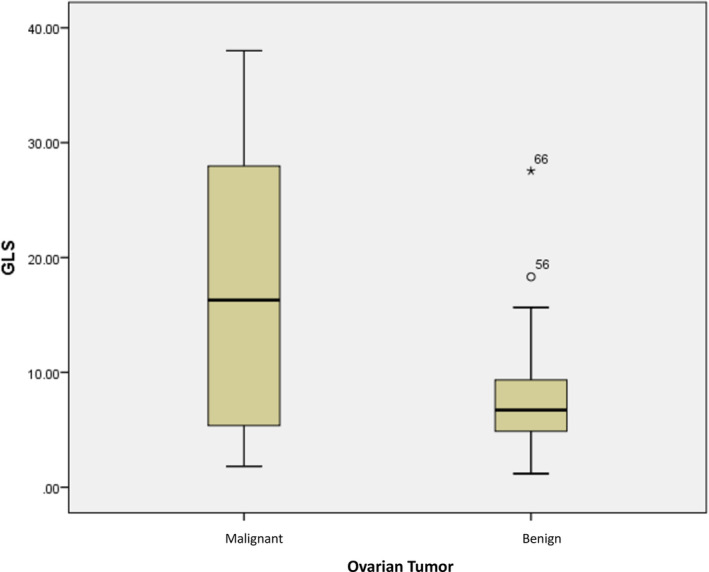
Distribution of glutaminase (GLS) values in ovarian tumor patients.
FIGURE 2.
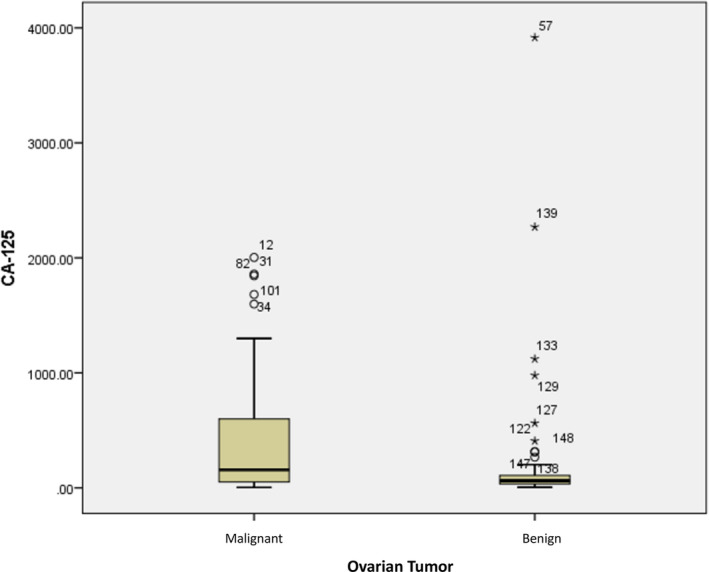
Distribution of cancer antigen 125 (CA‐125) values in ovarian tumor patients.
The ROC curve was analyzed and revealed that the optimal cutoff point for GLS was 18.32, with excellent specificity but low sensitivity (98.7% and 50.0%, respectively) (Table 3). The positive predictive value (PPV) was 97.6%, and the negative predictive value (NPV) was 65.2%. The accuracy of GLS in predicting ovarian malignancy was 73.7%.
TABLE 3.
Relationship between pre‐surgical GLS and CA‐125 levels with histopathology results in ovarian tumor patients.
| Cutoff point | Ovarian tumors | P value | Sensitivity (%) | Specificity (%) | PPV (%) | NPV (%) | Accuracy (%) | |
|---|---|---|---|---|---|---|---|---|
| Malignant | Benign | |||||||
|
(N = 80) n (%) |
(N = 76) n (%) |
|||||||
| GLS (μg/mL) | ||||||||
| >18.32 | 40 (50.0) | 1 (1.3) | 0.0001 a | 50.0 | 98.7 | 97.6 | 65.2 | 73.7 |
| ≤18.32 | 40 (50.0) | 75 (98.7) | ||||||
| CA‐125 (U/mL) | ||||||||
| >108.2 | 59 (61.3) | 18 (23.7) | 0.0001 a | 61.3 | 76.3 | 73.1 | 65.2 | 68.6 |
| ≤108.2 | 31 (38.8) | 58 (76.3) | ||||||
| GLS + CA‐125 | ||||||||
| >20.18 | 41 (51.3) | 3 (3.9) | 0.0001 a | 51.3 | 96.1 | 93.2 | 65.2 | 73.1 |
| ≤20.18 | 39 (48.8) | 73 (96.1) | ||||||
Abbreviations: CA‐125, cancer antigen 125; GLS, glutaminase; NPV, negative predictive value; PPV, positive predictive value.
Chi‐square, p < 0.05.
Meanwhile, for CA‐125, when using the optimal cutoff point of 108.2, it exhibited lower specificity, PPV, and accuracy compared to GLS (76.3% vs. 98.7%, 73.1% vs. 97.6%, and 68.6% vs. 73.7%, respectively) but higher sensitivity in predicting ovarian malignancy (Table 3). In addition, logistic regression analysis was performed to evaluate the predictive capabilities of GLS and CA‐125 for distinguishing between benign and malignant ovarian tumors. The results showed that GLS had higher predictive capabilities for distinguishing between benign and malignant ovarian tumors compared with CA‐125 (odds ratio [OR] 9.4 vs. 2.1, p = 0.0001).
Correlation between GLS and CA‐125 serum
Spearman analysis was performed to analyze the correlation between GLS and CA‐125 serum levels in ovarian tumor patients, as well as in the benign group alone and the malignant group alone. The analysis revealed a weak correlation between GLS and CA‐125 serum levels in the overall group of ovarian tumor patients (p < 0.05). However, there was no correlation observed between GLS and CA‐125 in the benign group alone nor in the malignant group alone (p > 0.05). Additionally, we present a correlation plot between GLS and CA‐125 in Figure 3.
FIGURE 3.
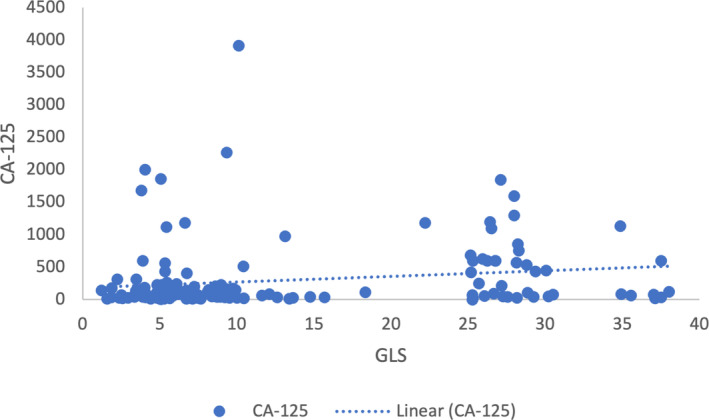
Correlation of glutaminase (GLS) and cancer antigen 125 (CA‐125) serum in ovarian tumor patients.
Combination of GLS and CA‐125 serum
Logistic regression analyses were performed to analyze the combination of GLS and CA‐125 in differentiating benign and malignant ovarian tumors. The results revealed that the combination value was statistically higher in patients with malignant ovarian tumors compared with those with benign tumors. The optimal cutoff point of the combination was 20.18, and it had better sensitivity than GLS alone, better specificity than CA‐125 alone, better PPV than CA‐125 alone, equal NPV compared to GLS alone and CA‐125 alone, and better accuracy than CA‐125 alone (p < 0.05) (Table 3).
DISCUSSION
To the best of our knowledge, this is the first study to evaluate and compare GLS and CA‐125 as tumor markers for distinguishing benign and malignant ovarian tumors. In our study population, we observed a trend of higher age among patients diagnosed with malignant ovarian tumors. Since 87% of the study population exhibited epithelial‐type tumors, our study aligns with a previous epidemiology study which indicated that 80% of epithelial ovarian cancer (EOC) patients are aged 40 years or older. 14
Our study found that tumor patients with elevated GLS levels were associated with ovarian malignancy. This finding aligns with the results of another study that observed the role of glutamine in promoting tumor growth. The study highlighted how glutamine contributes to the proliferation of ovarian cancer cells through various pathways, including the mTOR/S6 pathway. 9 These similar findings emphasize the significance of GLS and glutamine metabolism in the development and progression of ovarian cancer.
Our study revealed a specific cutoff point value for GLS, which proved effective in distinguishing between benign and malignant ovarian tumors. This cutoff point was determined to be 18.32. Furthermore, another study that specifically investigated the role of GLS in predicting optimal cytoreductive surgery in patients with EOC identified a cutoff point of 22.895. 15
Tumor growth is accompanied by distinct metabolic changes. The increased proliferation of tumor cells requires an alteration in metabolic functions to support their division. In addition to an elevated demand for glucose, tumors also rely on glutamine, a crucial nutrient. Glutamine dependence is observed in various malignancies, including ovarian cancer. Glutaminolysis, the metabolic process responsible for converting glutamine into glutamate, plays an important role in the availability of glutamine and has emerged as a promising target for treating malignant tumors. 8 , 9 In addition, a study conducted by Venneti et al. observed that the use of a glutamine analog for PET imaging in vivo can give clear tumor delineation in glioma patients. 16
We also found that the cutoff point of 108.2 for CA‐125 was associated with patients diagnosed with malignant ovarian tumors. In contrast, the cutoff point of 35 for CA‐125 was commonly used to determine normal levels in healthy women. 17 The cutoff point for CA‐125 in our study, which included all types of ovarian tumors, differed from previous studies that focused specifically on EOC, where CA‐125 is commonly used as a tumor marker. However, it is important to consider that several factors can affect CA‐125 levels in serum, including age, menstrual cycle, pregnancy status, and race. Additionally, elevated CA‐125 levels can also be observed in patients with both gynecological and non‐gynecological benign tumors. 18
We evaluated the correlation between GLS and CA‐125 values in ovarian tumor patients. Although a weak correlation was observed in the overall ovarian tumor patients, it should be noted that this correlation can be flawed. Consequently, our study concludes that there is no significant correlation between GLS and CA‐125 serum levels in ovarian tumor patients. This lack of correlation may be attributed to histopathological variety within our study population.
We compared the use of GLS and CA‐125 to distinguish benign and malignant ovarian tumors. Our study has shown that GLS improved effectiveness in detecting ovarian malignancy than CA‐125. This finding is interesting since no other study compares GLS and CA‐125 in ovarian tumor patients. The implication of this finding is significant, as it provides primary data for future research in developing screening and targeting therapy in ovarian cancer.
Moreover, our study also aimed to evaluate the role of combining GLS with CA‐125 in distinguishing benign and malignant ovarian tumors. Our study revealed that using GLS as a serum marker outperforms the combination of GLS and CA‐125 in distinguishing between benign and malignant ovarian tumors in terms of specificity and PPV. However, when GLS is combined with CA‐125, the combination demonstrates better sensitivity in distinguishing between benign and malignant ovarian tumors compared to GLS alone. Therefore, the combination of GLS and CA125 is more effective in accurately detecting malignant ovarian tumors, resulting in fewer false‐negative results. We also found that the accuracy of this combination was superior to using CA‐125 alone but slightly inferior to using GLS alone. Overall, the study findings highlight the importance of using multiple markers in the diagnosing and differentiating of ovarian tumors.
Unfortunately, we were unable to compare our results with previous studies as there is a lack of existing research that combines GLS and CA‐125 for differentiating ovarian tumors. The closest available study focused on using the combination of GLS and CA‐125 to predict suboptimal cytoreduction in patients with EOC. The study revealed that the cutoff point for this combination was 29.16, with a sensitivity of 82.1% and specificity of 73.6% in predicting suboptimal cytoreduction in EOC patients.
Our study does, however, have several limitations, including the variability in the time of sample collection to diagnosis and the lack of evaluation of tumor size, which could potentially impact the levels of serum GLS and CA‐125. Moreover, further research to explore the potential relationship between the combined serum markers and some commonly used algorithms in the diagnosis and assessment of ovarian malignancy, such as ROMA (Risk of Ovarian Malignancy Algorithm), RMI (Risk of Malignancy Index), and IOTA (International Ovarian Tumor Analysis) is warranted to improve diagnostic accuracy and risk assessment in ovarian malignancy. Despite these limitations, our findings provide primary data for future research that aims to develop screening methods and targeted therapies for ovarian cancer.
CONCLUSIONS
In conclusion, our findings demonstrate that higher levels of CA‐125 and GLS are associated with malignant ovarian tumors. Furthermore, when it comes to distinguishing between benign and malignant ovarian tumors, GLS outperforms CA‐125. Additionally, the combination of GLS and CA‐125 demonstrated improved accuracy for distinguishing benign and malignant ovarian tumors when compared with using CA‐125 alone. These findings highlight the potential value of combining GLS with CA‐125 as a biomarker for ovarian tumor detection.
AUTHOR CONTRIBUTIONS
G.N.A.W. designed the research. G.N.A.W., A.I.M., and T.N. wrote the manuscript. B.D.D. performed the research. G.N.A.W., A.I.M., A.B.H., J.S.E., B.H., S.S., R.M.S.S., A.R., and T.N. analyzed the data.
FUNDING INFORMATION
No funding was received for this work.
CONFLICT OF INTEREST STATEMENT
The authors have declared no competing interests in this work.
DECLARATION OF FIGURES AUTHENTICITY
All figures in this article have been created by the authors who confirm that the images are original with no duplication and have not been previously published in whole or in part.
ACKNOWLEDGMENTS
We thank all the staff in the Department of Obstetrics and Gynecology, Faculty of Medicine, Universitas Padjadjaran, for supporting this study.
Winarno GNA, Effendi JS, Harsono A, et al. Comparison of glutaminase and cancer antigen 125 for distinguishing benign and malignant ovarian tumors. Clin Transl Sci. 2023;16:2144‐2152. doi: 10.1111/cts.13603
DATA AVAILABILITY STATEMENT
The datasets used and analyzed during the current study are available from the corresponding author upon reasonable request.
REFERENCES
- 1. Cancer Today ‐ Global Cancer Observatory . Estimated number of incident cases and deaths world, females, all ages. 2023. Accessed January 10, 2023. https://gco.iarc.fr/today/data/factsheets/populations/900‐world‐fact‐sheets.pdf
- 2. ACOG Committee Opinion No. 754 . The utility of and indications for routine pelvic examination. Obstet Gynecol. 2018;132(4):e174‐e180. [DOI] [PubMed] [Google Scholar]
- 3. Van Nagell J, Hoff J. Transvaginal ultrasonography in ovarian cancer screening: current perspectives. Int J Womens Health. 2013;6:25‐33. [DOI] [PMC free article] [PubMed] [Google Scholar]
- 4. Scholler N, Urban N. CA‐125 in ovarian cancer. Biomark Med. 2007;1(4):513‐523. [DOI] [PMC free article] [PubMed] [Google Scholar]
- 5. Donach M, Yu Y, Artioli G, et al. Combined use of biomarkers for detection of ovarian cancer in high‐risk women. Tumor Biol. 2010;31(3):209‐215. [DOI] [PubMed] [Google Scholar]
- 6. Sölétormos G, Duffy MJ, Othman Abu Hassan S, et al. Clinical use of cancer biomarkers in epithelial ovarian cancer: updated guidelines from the European Group on Tumor Markers. Int J Gynecol Cancer. 2016;26(1):43‐51. [DOI] [PMC free article] [PubMed] [Google Scholar]
- 7. Hensley CT, Wasti AT, DeBerardinis RJ. Glutamine and cancer: cell biology, physiology, and clinical opportunities. J Clin Invest. 2013;123(9):3678‐3684. [DOI] [PMC free article] [PubMed] [Google Scholar]
- 8. Erickson JW, Cerione RA. Glutaminase: a hot spot for regulation of cancer cell metabolism? Oncotarget. 2010;1(8):734‐740. [DOI] [PMC free article] [PubMed] [Google Scholar]
- 9. Yuan L, Sheng X, Willson AK, et al. Glutamine promotes ovarian cancer cell proliferation through the mTOR/S6 pathway. Endocr Relat Cancer. 2015;22(4):577‐591. [DOI] [PMC free article] [PubMed] [Google Scholar]
- 10. Hudson CD, Savadelis A, Nagaraj AB, et al. Altered glutamine metabolism in platinum resistant ovarian cancer. Oncotarget. 2016;7(27):41637‐41649. [DOI] [PMC free article] [PubMed] [Google Scholar]
- 11. Masisi BK, El Ansari R, Alfarsi L, Rakha EA, Green AR, Craze ML. The role of glutaminase in cancer. Histopathology. 2020;76(4):498‐508. [DOI] [PubMed] [Google Scholar]
- 12. Yang L, Moss T, Mangala LS, et al. Metabolic shifts toward glutamine regulate tumor growth, invasion and bioenergetics in ovarian cancer. Mol Syst Biol. 2014;10(5):728. [DOI] [PMC free article] [PubMed] [Google Scholar]
- 13. Huang F, Zhang Q, Ma H, Lv Q, Zhang T. Expression of glutaminase is upregulated in colorectal cancer and of clinical significance. Int J Clin Exp Pathol. 2014;7(3):1093‐1100. [PMC free article] [PubMed] [Google Scholar]
- 14. Holschneider CH, Berek JS. Ovarian cancer: epidemiology, biology, and prognostic factors. Semin Surg Oncol. 2000;19(1):3‐10. [DOI] [PubMed] [Google Scholar]
- 15. Winarno GNA, Hidayat YM, Soetopo S, Krisnadi SR, Tobing MDL, Rauf S. The role of CA‐125, GLS and FASN in predicting cytoreduction for epithelial ovarian cancers. BMC Res Notes. 2020;13(1):346. [DOI] [PMC free article] [PubMed] [Google Scholar]
- 16. Venneti S, Dunphy MP, Zhang H, et al. Glutamine‐based PET imaging facilitates enhanced metabolic evaluation of gliomas in vivo. Sci Transl Med. 2015;7(274):274ra17. doi: 10.1126/scitranslmed.aaa1009 [DOI] [PMC free article] [PubMed] [Google Scholar]
- 17. Bast RCJ, Klug TL, E SJ, et al. A radioimmunoassay using a monoclonal antibody to monitor the course of epithelial ovarian cancer. N Engl J Med. 1983;309(15):883‐887. [DOI] [PubMed] [Google Scholar]
- 18. Duffy MJ, Bonfrer JM, Kulpa J, et al. CA‐125 in ovarian cancer: European Group on Tumor Markers guidelines for clinical use. Int J Gynecol Cancer. 2005;15(5):679‐691. [DOI] [PubMed] [Google Scholar]
Associated Data
This section collects any data citations, data availability statements, or supplementary materials included in this article.
Data Availability Statement
The datasets used and analyzed during the current study are available from the corresponding author upon reasonable request.