

Summary
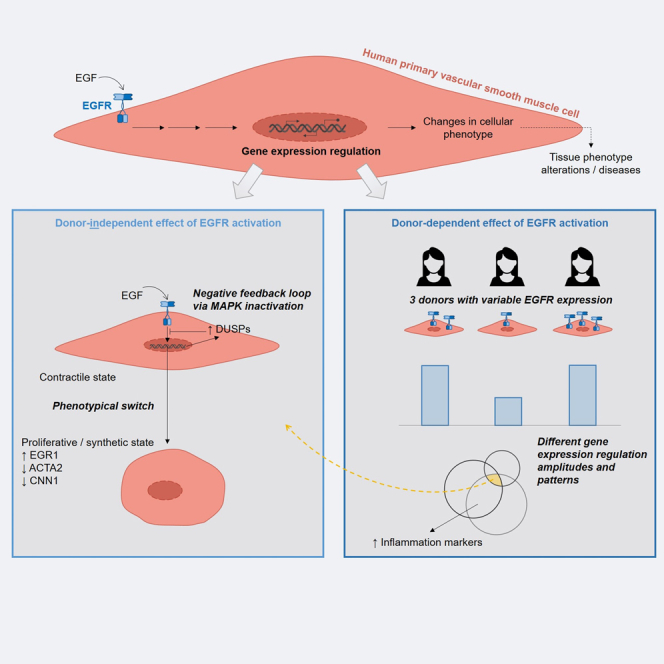
Vascular smooth muscle cells (VSMC) are critical for the vascular tone, but they can also drive the development of vascular diseases when they lose their contractile phenotype and de-differentiate. Previous studies showed that the epidermal growth factor receptor (EGFR) of VSMC is critical for vascular health, but most of the underlying mechanisms by which VSMC-EGFR controls vascular fate have remained unknown. We combined RNA-sequencing and bioinformatics analysis to characterize the effect of EGFR-activation on the transcriptome of human primary VSMC (from different female donors) and to identify potentially affected cellular processes. Our results indicate that the activation of human VSMC-EGFR is sufficient to trigger a phenotypical switch toward a proliferative and inflammatory phenotype. The extent of this effect is nonetheless partly donor-dependent. Our hypothesis-generating study thus provides a first insight into mechanisms that could partly explain variable susceptibilities to vascular diseases in between individuals.
Subject areas: Cardiovascular medicine, Molecular biology, Transcriptomics
Graphical abstract
Highlights
-
•
EGF may induce a phenotypical switch in female VSMC
-
•
EGF promotes a proliferative and inflammatory state in VSMC
-
•
The effect of EGF on the inflammatory status of VSMC is partly donor-dependent
Cardiovascular medicine; Molecular biology; Transcriptomics
Introduction
Arteries are large blood vessels subject to high blood pressure, whose main cellular component consists of vascular smooth muscle cells (VSMC). VSMC control the vascular tone through the contraction/dilation of the vessels. Although being differentiated cells, VSMC conserve high plasticity properties. The quiescent and contractile VSMC can thus “de-differentiate” in case of vascular injury or changes in their microenvironment, and switch to a less contractile but more proliferative phenotype.1 Once the vessel homeostasis is restored, the proliferative VSMC can re-differentiate and reacquire contractile properties. An imbalance of this fine-tuned system can lead to VSMC-driven vascular diseases, such as hypertension or atherosclerosis. This means that the phenotypical state of VSMC within the vessel wall affects the inherent properties of the latter, but also its susceptibility to pathologies.
In recent years it has become clear that the epidermal growth factor receptor (EGFR) is an important signaling-hub associated with vascular physiology and pathophysiology, and that it plays a prominent role within the delicate phenotypical balance of VSMC. Indeed, the ligand-dependent EGFR activation itself results in the regulation of e.g., cell proliferation, survival, differentiation, migration, and matrix homeostasis.2 But EGFR can also be transactivated by receptors for vasoactive substances (e.g., Angiotensin II), thereby contributing to vascular tone, dysfunction and remodeling as a transducer for non-EGFR ligands.3 Our previous EGFR-knock out animal model experiments allowed us to conclude that EGFR in VSMC is critical for cardiovascular health and disease.3,4,5,6 For instance, we observed that knocking-out EGFR in VSMC leads to arterial hypotension, prevents Angiotensin II-induced arterial wall stiffening and media thickening, and prevents obesity-induced vascular dysfunction. In vivo studies in human are rarer, mostly due to the ethically questionable approach of collecting samples from healthy patients, what would be required to have proper control groups. However, a few descriptive studies based on pre- or postmortem biopsies have been published and show an alteration of EGFR and its ligands in several pathological situations. For instance, EGFR is more expressed in advanced atherosclerotic plaques than in early stage plaques in human aorta,7 but also in the brain blood vessels of patients with dementia than in non-demented neurologically normal patients.8 Additionally, an analysis of cohort studies suggests that patients with SNPs associated with elevated EGFR exhibit elevated coronary artery calcium, what could result in vascular calcification.9 Finally, increased serum or plasma concentrations of EGF or HB-EGF (one of the endogenous ligand for EGFR) have been correlated with atrial fibrillation,10 heart hypertrophy,11 obesity, and coronary artery diseases.12 Cell culture models have also been used to show that the inhibition of EGFR prevents the secretion of some inflammatory markers by human VSMC13 and improves pulmonary hypertension by preventing human pulmonary arterial smooth muscle cell dysfunction.14 This means that the responsiveness of VSMC to the activation of the EGFR is important for vascular wall homeostasis and vessel function in human as well. But despite its clear implication in cardiovascular pathophysiology, no systematic evaluation of the transcriptional impact of EGFR activation on human VSMC has been performed yet. For this study, we thus carried out an RNA-sequencing-based transcriptomic analysis on the global impact of EGFR activation on human primary VSMC, using cells from different adult female donors.
Taking advantage of our diverse VSMC-derived data collection, we also sought to estimate the influence of the donor of the VSMC for their responsiveness to EGFR activation by EGF. Indeed, we wondered if EGFR activation led to a uniform response or rather to a donor-dependent one. We thus compared the EGF-induced changes in gene expression and the predicted subsequent phenotypic changes for each donor. Doing so, we aimed to obtain initial clues if primary human VSMC could play a key role in the donor-associated various susceptibility for vascular diseases.
Within this hypothesis-generating study, we predict that EGFR activation globally induces a phenotypical switch (from a contractile toward a proliferative phenotype) and an enhanced inflammatory response in VSMC. The amplitude of this effect appears nonetheless partly donor-dependent, especially regarding the inflammatory aspects.
Results
EGF-induced gene expression changes indicate a phenotypical switch in vascular smooth muscle cells
We investigated the impact of EGFR activation on the transcriptome of human primary VSMC. To do so, primary cells from three distinct female donors were incubated with EGF for 48 h and RNA samples were sequenced (total number of replicates N = 21). Differential expression analysis showed that 263 genes were regulated following EGFR activation, including 121 down- and 142 up-regulated genes (Figure 1A and Table S1).
Figure 1.

EGF-induced gene expression changes suggest a phenotypical switch of VSMC
(A) Number of differentially expressed genes following EGFR activation by EGF (number of independent replicates N = 21).
(B) Overview of the genes that displayed the strongest changes following EGFR activation (selection of the ten highest and the ten lowest log2 fold changes calculated by DESeq2, error bars show the standard errors).
(C) Heatmap showing GO terms that were significantly enriched for at least one list of regulated genes used as input for the analysis. Each row corresponds to a GO term and the color gradient to their respective –log (p value). The GO term clusters are indicated by different colors and numbers. The common parent term of the GO terms comprised in a given cluster is indicated.
(D) Log2 fold changes (calculated by DESeq2, error bars show the standard errors) of the genes comprised in the GO terms from the cluster 13 associated with “Regulation of protein phosphorylation”.
In order to determine which cellular processes may be affected by these changes, Gene Ontology (GO) term enrichment analysis was performed for the lists of down- and up-regulated genes. Most of the enriched GO terms were associated with development, cell differentiation and proliferation (Table S2), processes that have already been associated with EGFR activation.15 Additionally, hierarchical clustering and common ancestor mapping were applied on all GO terms enriched for at least one of the lists of regulated genes (Figure 1C), in order to identify functionally coherent patterns within the enriched GO terms. The GO term cluster 13 comprised terms strongly enriched in up-regulated genes. They were all associated with “Regulation of protein phosphorylation” and indicated a trend toward MAP kinase inactivation (Table S2). Figure 1D displays the EGF-induced changes for the genes enriched in these GO terms, which include several genes coding for DUSP phosphatases (DUSP4, DUSP5, DUSP6, DUSP10). EGFR activation has also been previously associated with MAP kinase inactivation, a negative feedback loop mechanism that ensures a finite response and that involves DUSP phophatases.16 These results thus constitute a positive control and validate our experimental system to study the effect of EGFR activation on VSMC.
The genes with the strongest EGF-induced changes in expression included some of the “MAP kinase inactivation”-associated genes, such as DUSP6 or IL1B (Figure 1B). But they also included ACTA2 and CNN1, which appeared strongly down-regulated by EGF, and that both code for proteins commonly considered as markers of differentiated and contractile smooth muscle cells.17 Additionally, EGFR activation led to a strong up-regulation of angiogenetic genes (e.g., EGR1, IL1B) and pro-inflammatory genes (e.g., IL1B, IL17A, and CSF3), which have themselves also been associated with vascular remodeling.18,19 The regulation of ACTA2, CNN1, and EGR1 was confirmed at the protein levels (Figures 2 and S1). Taken together, these results suggest that EGFR activation leads to a phenotypical switch of VSMC, from a contractile state toward a proliferative one, and to a putative enhanced inflammation.
Figure 2.

EGFR activation regulates contractility and proliferation markers in opposite direction in VSMC
The protein expression level of the selected (A) contractility (ACTA2 and CNN1) and (B) proliferation (EGR1) markers were measured by western blot. Uncut membranes are displayed in Figure S1. Number of replicates after outlier removal N = 10–12. The p values were calculated using Wilcoxon test.
EGF-induced changes may have pathophysiological consequences
We aimed to further characterize the putative consequences of such EGF-induced changes on the cardiovascular system. To do so, we used the “Function and Diseases” tool from the Ingenuity Pathways Analysis (IPA) software for which the whole list of EGF-regulated genes served as input (263 genes). The output comprised several enriched inflammation-related functions (marked in Table S2). Thereby, these results support here again the idea of an EGF-associated enhanced inflammation in VSMC, which could result in an increased leukocyte migration. These results also strongly suggest that EGFR-activation regulates genes involved in the activation of functions and diseases directly related to the cardiovascular system (Tables 1 and S2). The concerned EGF-regulated genes and their association with these different diseases and functions are displayed in Figure S2. Additionally, the generation of a regulatory network for angiogenesis-like functions (“growth of blood vessel” and “vascularization”) provides putative links between EGF-activated well-known regulators of these functions (e.g., EGR1, FOS, JUN) and the functions themselves (Figure 3). Our results thus suggest that the EGF-induced changes in gene expression not only lead to a phenotypical switch, but may actually have consequences for the integrity of the targeted vessels and in vascular pathophysiology.
Table 1.
EGF-regulated genes are involved in cardiovascular-related functions and diseases
| Categories | Diseases or Functions Annotation | B-H p value | Activation Z score |
|---|---|---|---|
| Cardiovascular Disease, Organismal Injury, and Abnormalities | Disorder of blood pressure | 3.20E-09 | 2.200 |
| Cardiovascular Disease, Organismal Injury and Abnormalities | Hypertension | 1.09E-08 | 1.942 |
| Cardiovascular System Development and Function, Organismal Development | Growth of blood vessel | 1.83E-06 | 1.802 |
| Cardiovascular System Development and Function | Vascularization | 1.83E-05 | 1.787 |
Significantly enriched (|Z-score| ≥ 1.5, B-H p value ≤0.001) “Diseases and functions” with EGF-regulated genes were filtered for those associated with the cardiovascular system. Z-scores were calculated based on the direction of the EGF-induced regulation of the genes included in these functions and on annotations in the software internal database. Positive Z-scores correspond to putatively promoted functions or diseases. The unfiltered list of enriched functions and diseases is available in Table S2. See also Figure S2.
Figure 3.

Network showing putative underlying mechanisms leading to angiogenesis following VSMC stimulation with EGF
IPA “Regulator Effects” consists in connecting predicted upstream regulators, regulated genes (input dataset) and predicted affected downstream functions. The actual network shows the predicted upstream regulators (top) of the EGF-regulated genes in VSMC (middle) that have been associated with the angiogenesis-like functions “Vascularization” and “Growth of blood vessels” (bottom).
See also Table S2.
The transcriptomic response to EGFR activation varies in between donors
The estimation of the distance between all the samples considered for our analysis suggests a strong donor-related influence on gene expression (Figures 4A and S3). After the hereinabove described investigation of the global effect of EGFR activation on VSMC transcriptome, we thus aimed to determine if EGFR activation led to a uniform or rather donor-dependent response. To do so, we performed differential expression analysis again for each individual donor (N = 4, 8, and 9 for donor 1, 2, and 3, respectively). The numbers and the nature of the regulated genes varied greatly from one donor to another (Figures 4B–4D). The response amplitude of the cells from donor 1 was especially limited in comparison to the ones from donor 2 and donor 3 (Figure 4B). In an attempt to understand this difference, we verified the level of expression of genes coding for EGFR and other receptors from the ERBB-family (Figure 4E). ERBB3 and ERBB4 were barely detectable. In comparison to the other two donors, donor 1 showed a slightly increased expression for ERBB2 but a clearly reduced expression of EGFR, the main receptor for EGF. The limited and partly changing response of the VSMC from donor 1 to EGFR activation by EGF may therefore result from a reduced amount of available receptor.
Figure 4.

The impact of EGFR activation varies among donors
(A) A sample-to-sample distance heatmap displays the overall gene expression patterns for all considered samples (total of 42 samples), with each row and column corresponding to a given sample. The clustering indicates relationships between the samples.
(B) Number of regulated genes following EGFR activation by EGF for each donor (N = 4, 8, and 9 for donor 1, 2 and 3, respectively).
(C) Number of down- or up-regulated genes following EGFR activation by EGF for each donor. These lists of genes were used for further functional analysis by GO term enrichment analysis (Figure 5A and Table S3).
(D) Venn diagram to compare EGF-regulated genes in VSMC from each donor.
(E) Number of Fragments Per Millions (FPM, calculated by edgeR) for EGFR and other receptors from the ERBB-family.
(F) Scatterplots to investigate if the genes regulated by EGF in VSMC from two different donors were actually regulated in the same direction and with the same amplitude in both cell populations. The log2 fold changes of the concerned genes were plotted and Pearson’s correlation scores were calculated.
(G) Log2 fold changes (calculated by DESeq2, error bars show the standard errors) of the genes regulated by EGFR activation for all three donors.
Despite these differences, when considering genes regulated in VSMC from at least two different donors, all genes but one were consistently regulated in the same direction (Figure 4F), which suggests a limited but existing consistency of the response to EGF. Additionally, 22 genes, including DUSP5 and DUSP6, were regulated by EGFR activation in a donor-independent manner (Figures 4D and 4G). As mentioned previously, DUSP phosphatases play a critical role in a negative feedback loop mechanism downstream of EGFR activation that leads to MAP kinase inactivation. The consistent activation of this process was further confirmed by GO term enrichment analysis, since related terms were found strongly enriched for genes regulated in all donors (Figure 5A and Table S3). The uniform regulation of these genes and of this process for all donors shows that this feedback mechanism is consistently activated by EGF, again providing a valuable positive control for our experimental model, even at the level of individual donors.
Figure 5.

EGFR activation may trigger an increase of VSMC inflammation in a donor-dependent manner
(A) Heatmap showing GO terms that were significantly enriched for at least one list of regulated genes used as input for the analysis. Each row corresponds to a GO term and the color gradient to their respective –log (p value). The GO term clusters are indicated by different colors (detailed results in Table S3).
(B) Multidimensional scaling plot of the GO term clusters. The groups of GO term clusters with clear functional coherence were manually annotated.
(C) EGF-induced log2 fold changes (calculated by DESeq2, error bars show the standard errors) of the genes included in the cytokine production-associated clusters 20 and 21 (marked in Figures 5A and 5B).
See also Table S3.
Finally, the hereinabove described effect of EGF on a phenotypical switch of VSMC toward a more proliferative state seems to be consistent for all donors, although with putative differences regarding its amplitude. Indeed, ACTA2, CNN1, and EGR1, the contractility and proliferation markers we previously selected for protein quantification, showed strong regulation trends that suggest a uniform promotion of proliferation, but without passing uniformly our statistical significance criteria for all donors when considered individually (Table S1). The corresponding proteins were also regulated in individual donors, even if a donor-induced variability was also observed at this level (Figure S4).
EGFR activation regulates inflammation markers in a donor-dependent manner
Multidimensional scaling was applied to the GO term clusters (Figure 5A and Table S3), what highlighted different subgroups of GO term clusters with respect to their level of similarity (Figure 5B). Most corresponded to processes that we already identified as EGF-regulated in the first phase of our analysis that considered all donors indifferently (e.g., development, cell differentiation, signaling – Figure 1C). However, a “cytokine production”-related GO term cluster group newly appeared. The latter comprised GO terms that displayed different enrichments for the various donors (Figure 5A and Table S3). The genes associated with these terms include pro-inflammatory genes such as IL1A, IL1B, IL33, or TLR4, which were indeed not regulated in cells of all donors (Figure 5C and Table S1). Although the results previously described suggested an EGF-induced enhanced inflammatory profile of VSMC, this additional piece of information implies that this aspect of the EGF effect may, at least partly, be donor-dependent.
Basal gene expression in vascular smooth muscle cells varies among donors
In addition to our consideration for the responsiveness of VSMC to EGFR activation, we used our diverse data collection to try to estimate how variable are VSMC from one donor to another under basal conditions. To do so, we considered control samples from each donor only, which associated again clearly by donor when considering their overall gene expression patterns (Figure 6A). We then performed a new round of differential expression analysis in order to compare the donors two by two (N = 4, 8, and 9 for donor 1, 2, and 3, respectively). Despite a variable number of replicates for each donor, large numbers of differentially expressed genes were identified for each comparison (Figure 6B). The overlap of these various lists of differentially expressed genes highlighted that 273 genes displayed donor-dependent expression levels (Figure 6C). GO term enrichment analysis for these 273 genes showed that they are enriched in various processes, but that the enriched GO terms exhibited a limited global functional coherence (Table S4). Nevertheless, the enriched GO terms included some related to the regulation of angiogenesis (GO:0001525, GO: 0045766) and of smooth muscle cell proliferation (GO:0048660).
Figure 6.

Vascular smooth muscle cells display donor-specific basal gene expression
(A) A sample-to-sample distance heatmap displays the overall gene expression patterns for all unstimulated considered samples (total of 24 samples), with each row and column corresponding to a given sample. The clustering indicates relationships between the samples.
(B) Number of differentially expressed genes when comparing the donors two by two.
(C) Venn Diagram to compare the differentially expressed genes when comparing unstimulated VSMC from different donors.
Discussion
In this hypothesis-generating study, we assessed the effect of EGFR activation by EGF on the transcriptome of primary human VSMC and predicted its putative phenotypical consequences. When considering VSMC from different adult female donors indifferently, our results suggest that EGFR activation induces a phenotypical switch, from a contractile state toward a proliferative and inflammatory trans-differentiation. However, further analysis taking into consideration the donor-origin of the VSMC highlighted that this factor also influences the transcriptional response of VSMC to EGFR activation.
Vascular EGFR has been associated with cardiovascular health and diseases thanks to knock-out animal studies and targeted approaches in cell culture.3,4,5,6,13 But to our knowledge, our untargeted study is the first one that reports the global effect of EGFR activation on the transcriptome of primary human VSMC. Our analysis suggests that EGFR activation in these cells primarily leads to a phenotypical switch from a differentiated/contractile to a de-differentiated/proliferative state. As a growth factor, it is well established that EGF leads to cell proliferation and we previously made such observations in murine aortic VSMC.20,21 But here, we additionally observed an EGF-induced strong downregulation of ACTA2 and CNN1, two markers of differentiated smooth muscle cells, whose downregulation has been already associated with the setting of a synthetic phenotypical state.22 VSMC not expressing ACTA2 have been reported as accumulating in atherosclerotic plaque cores.23 Such plaques actually contain cells with various alternative non-contractile phenotypes that derive from synthetic VSMC, such as macrophage-like, adipocyte-like or yet osteochondrogenic-like cells.24 Therefore, our results imply that EGFR activation can potentially lead to a dysregulated phenotypical switch of human VSMC if not tightly limited to acute injury cases, and can therefore be involved in the establishment of VSMC dysfunctions and of subsequent diseases in arteries. The findings on these aspects obtained from mouse models and cell studies appear transferrable to human VSMC.
In addition to the hereinabove discussed global effect of EGF on VSMC, our analysis additionally suggests that the transcriptomic impact of EGFR activation is nonetheless partly donor-dependent. Indeed, VSMC from the different donors displayed quantitatively and qualitatively different responses to EGFR activation. Beyond the obvious inherent biological variations between individuals that could explain these differences, we observed that all donors did not express EGFR mRNA at the same level in VSMC. The amount of available EGFR is most likely the main determining factor for the degree of responsiveness. Moreover, since we propose that EGFR can play a critical role in the development of VSMC-related diseases, its variable expression level may explain the differing susceptibility for such conditions in between individuals. This hypothesis is further supported by the fact that only VSMC from donors showing a higher EGFR expression level displayed an EGF-induced up-regulation of inflammatory markers such as IL1B, IL33, or TLR4. The proteins coded by these particular EGF-regulated genes have been described as regulators of cardiovascular pathologies,19,25,26 and more generally, enhanced inflammatory states by VSMC have been observed at vascular injury sites and associated with the setting up of vascular diseases such as atherosclerosis.27 An EGFR-related inflammatory state in VSMC have actually been previously reported by Wang et al.,13 who showed that EGFR inhibition led to a reduced expression of inflammation markers by human VSMC. However, they appear to have used cells from a single donor (unspecified sex and unknown EGFR expression level). Our data suggest that one should nuance any conclusions regarding the impact of EGFR on VSMC inflammatory state by taking the donor characteristics into consideration.
This last point is supported by our comparison of the basal transcriptomic footprints of the VSMC from the different donors. Even though the differentially expressed genes showed a reduced functional coherence, the results still hint at differences with regards to proliferation and angiogenesis regulation. This means that unstimulated VSMC from different donors putatively present inherent differences, which could be critical for the response to vascular injuries or for the development of cardiovascular pathologies.
The present study was conducted in order to generate statistically sound hypotheses regarding the role of EGFR in primary human VSMC. The experimental validations of EGF-induced phenotypical changes shall be carried in a second study phase (e.g., proliferation assays, in-depth analysis of the inflammatory response). The intra-individual variability we observed suggests that, if possible, a broader panel of donors should be considered when doing so. Moreover, for this first phase of the study, we exclusively worked on cells from adult female donors. Our interest in focusing on a coherent subpopulation was caused by the well-known influences of age and sex on cardiovascular diseases.28 We considered female donors first due to the common underrepresentation of women in cardiovascular research. The effect of EGFR activation on VSMC from adult male donors shall nonetheless also be evaluated in the future, in order to assess if the predicted effects are sex-specific or not.
In summary, with this study, we gathered valuable transcriptomic data that depict the global effect of EGFR activation in primary human VSMC. We also provide bioinformatics evidences that VSMC-EGFR may play a critical role in cardiovascular health and diseases in human, thereby extending our knowledge that has been mostly limited to animal studies so far. However, our results suggest that this effect may partly vary in between individuals. Further experiments and functional characterizations must be considered to validate the hypotheses formulated here.
Limitations of the study
We focused on the generation of RNA-sequencing data and on the subsequent bioinformatics analysis, in order to generate sound data regarding affected networks and phenotypes that can be used for further studies. This means that our study contains limited biological validation. However, the few selected biomarkers that we measured were concordant with our predictions. Because our analysis is based on cells from a small number of comparable female donors, subsequent studies should extend the investigations to a more diverse set of donors. Yet, the availability of cells from comparable donors (e.g., with regards to age, sex, known pathologies …) from different subgroups is limited.
STAR★Methods
Key resources table
| REAGENT or RESOURCE | SOURCE | IDENTIFIER |
|---|---|---|
| Antibodies | ||
| Rabbit monoclonal anti-EGR1 | Cell Signaling Technology (Germany) | 4154 |
| Rabbit polyclonal anti-ACTA2 | Cell Signaling Technology (Germany) | 14968 |
| Recombinant anti-CNN1 | Abcam (USA) | ab46794 |
| Anti-rabbit IRDye 800CW | LICOR Biosciences | 926-32211 |
| Chemicals, peptides, and recombinant proteins | ||
| BlueZol | Serva (Germany) | 39808.01 |
| Turbo DNAse-free kit | Invitrogen, Life Technologies (Germany) | AM1907 |
| Smooth Muscle Cell Growth Medium 2 | PromoCell (Germany) | C-22062 |
| Growth Medium 2 SupplementMix | PromoCell (Germany) | C-39267 |
| EGF (human, recombinant protein) | Merck (Germany) | 324831 |
| Deposited data | ||
| Raw and analyzed RNA-sequencing data | This paper | GEO database: GSE226358 |
| Experimental models: Cell lines | ||
| Human aortic vascular smooth muscle cells (“Donor 1”) | PromoCell (Germany) | C12533 (Lot 437Z016.2) |
| Human aortic vascular smooth muscle cells (“Donor 2”) | PromoCell (Germany) | C12533 (Lot 416Z048.2) |
| Human coronary artery vascular smooth muscle cells (“Donor 3”) | ATCC (USA) | ATCC-PCS-100-021 (Lot 804020) |
| Human coronary artery vascular smooth muscle cells (“Donor 4”) | PromoCell (Germany) | C12511 (Lot 416Z048.4) |
| Human aortic vascular smooth muscle cells (“Donor 5”) | PromoCell (Germany) | C12533 (Lot 454Z019.2) |
| Software and algorithms | ||
| HISAT | Kim et al.29 | Version 2.1.0 |
| featureCounts | Liao et al.30 | Version 2.0.0 |
| Ingenuity Pathway Analysis | Qiagen | Licensed software |
| R | https://cran.r-project.org/ | R 4.0.3 |
| EdgeR (R package) | https://doi.org/10.18129/B9.bioc.edgeR | Version 3.30.3 |
| DESeq2 (R package) | https://doi.org/10.18129/B9.bioc.DESeq2 | Version 1.28.1 |
| biomaRt (R package) | https://doi.org/10.18129/B9.bioc.biomaRt | Version 2.44.4 |
| ViSEAGO (R package) | https://doi.org/10.18129/B9.bioc.ViSEAGO | Version 1.2.0 |
Resource availability
Lead contact
Further information should be directed to and will be fulfilled by the lead contact Virginie Dubourg (virginie.dubourg@medizin.uni-halle.de).
Material availability
This study did not generate new unique reagents.
Experimental model and study participant details
Primary cell cultures
Commercially available human primary VSMC (purchased from PromoCell and ATCC) from multiple female donors were used for our experiments (information about the different donors listed in the “Table with information about primary cells”). PromoCell and ATCC performed phenotypic characterization to verify the purity of the isolated cells: all cells were smooth muscle alpha actin positive (marker for smooth muscle cells) but von Willebrand Factor and CD90 negative. For all donors, the providers did not report any known pathology.
We cultivated the VSMC at 37°C, 5% CO2, using “Smooth Muscle Cell Growth Medium 2” (low-serum cell culture media from PromoCell, Germany) supplemented with “Growth Medium 2 SupplementMix” (PromoCell, Germany) (Final supplementation concentrations after addition to the medium: 5% FCS, 0.5 ng/L EGF, 2 ng/mL FBF, 5 μg/mL Insulin). Before all experiments, cell synchronization and quiescence were induced by 24h in media without supplementation. This media was also used for further incubation with 10 μg/L EGF. Only cells that underwent no more than 7 cell culture passages were used for further experiments. Cells from three different donors were used for RNA-sequencing, as well as for Western Blot experiments.
Table with information about primary cells
| Identifier | Provider | Reference number (lot) | Sex donor | Age | Ethnicity | Application |
|---|---|---|---|---|---|---|
| Donor 1 | PromoCell, Germany | C12533 (437Z016.2) | Female | 51 | Caucasian | RNA-sequencing |
| Donor 2 | PromoCell, Germany | C12533 (416Z048.2) | Female | 63 | Asian | RNA-sequencing, Western Blot |
| Donor 3 | ATCC, USA | ATCC-PCS-100-021 (804020) | Female | 32 | Caucasian | RNA-sequencing |
| Donor 4 | PromoCell, Germany | C12511 (416Z048.4) | Female | 63 | Asian | Western Blot |
| Donor 5 | PromoCell, Germany | C12533 (454Z019.2) | Female | 12 | Caucasian | Western Blot |
Method details
RNA and protein sample preparation
RNA sequencing data (raw Total RNA and proteins were isolated after 48h treatment with BlueZol Reagent as described in the user manual. The “rigorous DNAse treatment” protocol of the “Turbo DNAse-free kit” (Invitrogen, Life Technologies, Germany) was applied onto the RNA samples remove eventual genomic DNA contaminations. These samples were then cleaned by ethanol precipitation (with 3 M sodium acetate, glycogen and 100% ethanol) and the RNA concentration was determined by NanoDrop (Biochrom, Germany). The quality of the to-be-sequenced RNA samples was assessed using a 2100 Bioanalyzer System (Agilent Technologies, Germany) and all samples had a RNA Integrity Number (RIN) above 7 (with 10 as maximal possible value). The protein samples were resuspended in 1% SDS and the concentrations were determined by BCA assay.
RNA sequencing
Novogene Co., Ltd (Cambridge, United-Kingdom) carried out the sequencing libraries preparation (poly(A) enrichment) and the paired-end sequencing (2 x 150bp) runs on a NovaSeq6000 Illumina system (N = 21 for each condition). Adaptor clipping and data quality control was provided by the service company as well.
Read mapping to the human genome hg38 was done with HISAT229 (v. 2.1.0) and featureCounts30 (2.0.0, –M –t exon) was used to count the mapped reads. Gene annotation was done using BiomaRt31 (v.2.44.4) to access Ensembl archive v101.
Differential expression analysis
Differential expression analysis was performed using edgeR32 (3.30.3) and DESeq233 (1.28.1). Based on the multiple variable influencing overall gene expression (Figure S1), the design ∼ donor + treatment and ∼ donor_treatment were used for the two different runs of differential expression analysis, respectively (for the “general effect of EGF” and the “donor specific effect”). Genes with sufficient counts to be considered in the statistical analyses were filtered using the filterByExpr edgeR function and the independent filtering parameter (α = 0.05) of the DESeq2 results function. Normalization factors were calculated with the “trimmed mean of M value” (TMM) method in the edgeR analysis. Significantly “differentially expressed genes” (DEG) were defined as genes with a false discovery rate (FDR) below 0.01 in both DESeq2 and edgeR outputs (overlap of the respective results), with at least 5 FPM on average in one of the sample groups considered for a given comparison and with |log2 Fold Change| ≥ 0.81 (threshold based on the inherent variation in control samples, corresponds to a 75% change - Table S5).
Heatmap visualization
pheatmap (https://cran.r-project.org/package=pheatmap) generated heatmaps that displayed the sample-to-sample distances (Euclidean distance calculated for normalized counts from DESeq2) and the normalized expression levels of pre-selected genes (log scale, calculated with rlog function from DESeq2). For the heatmaps displaying the normalized expression levels, each row represents a gene and each column a sample. Expression levels were additionally row-wise centered (subtraction of the mean to each values) and scaled (division by the standard deviation). Hierarchical clusterings were based on Euclidean distance (complete method, calculated by pheatmap).
Gene ontology enrichment analysis
GO term enrichment analysis was performed for genes differentially expressed following EGFR activation or when comparing the two cell types. The source code of the ViSEAGO34 R package (1.2.0) was adapted for this analysis and data visualization. Shortly, it used topGO35 (2.40.0) to perform GO analysis (GO annotation accessed with Ensembl v101 – parameters: algorithm = “weight01”, statistic = “fisher”, ont = “BP”). GO terms were defined as significantly enriched if p-value < 0.01 and enrichment E ≥ 3, with E = (intersection size / query size) / (term size / effective domain size). GO terms clustering was done with the dynamicTreeCut R package (version 1.63-1, https://cran.r-project.org/package=dynamicTreeCut), using “Semantic Similarity Distances” as distance matrix (calculated with “Wang” method) between the GO terms and the corresponding hierarchical clustering dendrogram (output of hclust, “ward.D2” method). The common parent term of GO terms included in a given cluster was identified by common ancestor mapping.
Ingenuity pathway analysis
The “Diseases and functions” (identify pathways / functions putatively affected by the changes in gene regulation) and “Upstream Regulator” (identify putative regulators of the observed gene regulation) tools from QIAGEN Ingenuity Pathway Analysis36 (IPA - https://digitalinsights.qiagen.com/IPA) were used for further investigations. The Ensembl identifiers of the regulated genes were mapped to networks incorporated into the software database. The log2 fold changes calculated by DESeq2 were included for each gene, thereby allowing more detailed predictions: IPA used these values to predict in which direction potentially regulated functions or upstream regulators lie (this prediction is reflected by the Z-scores). Functions and upstream regulators were filtered for adjusted (Benjamini–Hochberg) p-value < 0.01. Functions were additionally filtered for | Z-score| ≥ 1.5.
“Regulator effects” networks were generated for enriched cardiovascular-related “Diseases and Functions” with putative upstream regulators (filtered for “transcription factors”). Only networks with a consistency score CS > 0 were considered.
Protein quantification by western blot
For each sample, 25 μg of proteins were denaturated with 6x Laemmli Buffer for 30min at 37°C. Proteins were separated by 10% SDS-PAGE and transferred onto 45 μm nitrocellulose membranes. The proteins transferred onto the nitrocellulose membrane were stained with Ponceau S solution (AppliChem GmbH, Germany). Pictures of the stained membranes were taken for further quantification. After washing with TBS-Tween (17 mM Tris-HCl, 3 mM Tris-base, 140 mM NaCl, pH 7.4 HCl, 0.1% Tween-20), free binding sites of the membrane were blocked with a 5% solution of non-fat dry milk in TBS-Tween. The membranes were incubated overnight with primary antibodies against EGR1 (1:1000 dilution) and ACTA2 (1:1000 dilution) diluted in 5% BSA in TBS-Tween. IRDye-couple fluorescent secondary antibodies (diluted 1:20000 in 5% solution of non-fat dry milk in TBS-Tween) and a ChemiDoc MP imaging system (Bio-Rad, Germany) were used for detection of the proteins. Membranes were washed with TBS-Tween and incubated overnight with primary antibody against CNN1 (1:1000 dilution). Same procedure as above was applied for the detection. Densitometry analysis was performed with the ImageLab software (version 6.1, Bio-Rad, Germany). Whole protein contents obtained after Ponceau staining were used for normalization before relative quantification of the different targeted proteins. The experiment was performed for samples from 3 female donors, with 4 independent replicates each (N = 12).
Quantification and statistical analysis
RNA sequencing analysis
Differential expression analysis was performed using the gold standard tools DESeq2 and edgeR. The numbers of independent biological replicates used for each round of analysis are indicated in the results section.
Functional analysis with GO term enrichment analysis and IPA
The corresponding tests and cut-offs are indicated in the STAR Methods section.
Protein quantification by western blot
Western Blot were performed for 12 independent set of samples (cell coming from 3 donors, 4 replicates for each). Chi-squared test for outlier removal was performed with the R package “outliers” (https://cran.r-project.org/package=outliers). Significant differences in between the treatment conditions was assessed by Wilcoxon (rank sum) test.
Acknowledgments
This project was funded by the Deutsche Forschungsgemeinschaft (DFG GE 905/24 and BE 3246/6-1).
Author contributions
Conceptualization, V.D., M.G., G.S., B.S., and R.A.B.; methodology, V.D. and M.G.; validation, V.D.; formal analysis, V.D.; investigation, V.D., M.K., and S.M. ; data curation, V.D.; writing—original draft preparation, V.D.; writing—review and editing, M.G., G.S., R.A.B., and B.S.; visualization, V.D.; supervision, M.G.; project administration, M.G.; funding acquisition, M.G. and R.A.B. All authors have read and agreed to the published version of the manuscript.
Declaration of interests
The authors declare no conflict of interest.
Published: October 20, 2023
Footnotes
Supplemental information can be found online at https://doi.org/10.1016/j.isci.2023.108286.
Supplemental information
Output of DESeq2 and edgeR for the different comparisons. For each of the latter, are included the log2 fold change and the FDR calculated by DESeq2 and edgeR. The columns “Differentially expressed?” work as follow: 1 indicates that the corresponding gene was considered significantly regulated by the given condition after applying FDR, FPM and log2FC thresholds (see STAR methods); 0 indicates that it was not regulated. For each comparison the conditions compared are indicated as follow “reference vs. condition”.
Output of the GO term enrichment and IPA analyses for the genes regulated by EGFR activation, when considering all VSMC samples indifferently. The results of the GO term enrichment analysis correspond to the heatmap in Figure 1C. Significant values (log(p-value) ≥ 2 and E ≥ 3) are highlighted. The IPA analyses was based on the total list of regulated genes and the activation Z-scores were calculated based on the log2 fold changes.
Output of the GO term enrichment analysis, when considering VSMC samples from the different donors separately. The results of the GO term enrichment analysis correspond to the heatmap in Figure 2G. Significant values (log(p-value) ≥ 2 and E ≥ 3) are highlighted.
Output of the GO term enrichment analysis, when considering genes that are differentially expressed in unstimulated VSMC from the different donors.
Data and code availability
-
•
RNA sequencing data (raw and processed) on which is based this study have been deposited at GEO and are publicly available as of the date of publication. The accession number is listed in the key resources table. The original western blot images are available in the supplementary data.
-
•
This paper does not report original code.
-
•
Any additional information required to reanalyse the data reported in this paper is available from the lead contact upon request.
References
- 1.Frismantiene A., Philippova M., Erne P., Resink T.J. Smooth muscle cell-driven vascular diseases and molecular mechanisms of VSMC plasticity. Cell. Signal. 2018;52:48–64. doi: 10.1016/j.cellsig.2018.08.019. [DOI] [PubMed] [Google Scholar]
- 2.Bublil E.M., Yarden Y. The EGF receptor family: spearheading a merger of signaling and therapeutics. Curr. Opin. Cell Biol. 2007;19:124–134. doi: 10.1016/j.ceb.2007.02.008. [DOI] [PubMed] [Google Scholar]
- 3.Schreier B., Hünerberg M., Mildenberger S., Rabe S., Bethmann D., Wickenhauser C., Gekle M. Deletion of the EGF receptor in vascular smooth muscle cells prevents chronic angiotensin II-induced arterial wall stiffening and media thickening. Acta Physiol. 2018;222:1–14. doi: 10.1111/apha.12996. [DOI] [PubMed] [Google Scholar]
- 4.Schreier B., Rabe S., Schneider B., Bretschneider M., Rupp S., Ruhs S., Neumann J., Rueckschloss U., Sibilia M., Gotthardt M., et al. Loss of epidermal growth factor receptor in vascular smooth muscle cells and cardiomyocytes causes arterial hypotension and cardiac hypertrophy. Hypertension. 2013;61:333–340. doi: 10.1161/HYPERTENSIONAHA.112.196543. [DOI] [PubMed] [Google Scholar]
- 5.Schreier B., Hünerberg M., Rabe S., Mildenberger S., Bethmann D., Heise C., Sibilia M., Offermanns S., Gekle M. Consequences of postnatal vascular smooth muscle EGFR deletion on acute angiotensin II action. Clin. Sci. 2016;130:19–33. doi: 10.1042/CS20150503. [DOI] [PubMed] [Google Scholar]
- 6.Stern C., Schreier B., Nolze A., Rabe S., Mildenberger S., Gekle M. Knockout of vascular smooth muscle EGF receptor in a mouse model prevents obesity-induced vascular dysfunction and renal damage in vivo. Diabetologia. 2020;63:2218–2234. doi: 10.1007/s00125-020-05187-4. [DOI] [PMC free article] [PubMed] [Google Scholar]
- 7.Tamura R., Miyagawa J., Nishida M., Kihara S., Sasada R., Igarashi K., Nakata A., Yamamori K., Kameda-Takemura K., Yamashita S., Matsuzawa Y. Immunohistochemical localization of Betacellulin, a member of epidermal growth factor family, in atherosclerotic plaques of human aorta. Atherosclerosis. 2001;155:413–423. doi: 10.1016/S0021-9150(00)00576-1. [DOI] [PubMed] [Google Scholar]
- 8.Styren S.D., Mufson E.J., Styren G.C., Civin W.H., Rogers J. Epidermal growth factor receptor expression in demented and aged human brain. Brain Res. 1990;512:347–352. doi: 10.1016/0006-8993(90)90647-T. [DOI] [PubMed] [Google Scholar]
- 9.Bakhshian Nik A., Ng H.H., Ashbrook S.K., Sun P., Iacoviello F., Shearing P.R., Bertazzo S., Mero D., Khomtchouk B.B., Hutcheson J.D. Epidermal Growth Factor Receptor Inhibition Prevents vascular cylcifying extracellular vesicle biogenesis. Am. J. Physiol. Heart Circ. Physiol. 2023;324:H553–H570. doi: 10.1101/2021.11.08.467799. [DOI] [PMC free article] [PubMed] [Google Scholar]
- 10.Büttner P., Werner S., Sommer P., Burkhardt R., Zeynalova S., Baber R., Bollmann A., Husser-Bollmann D., Thiery J., Hindricks G., et al. EGF (Epidermal Growth Factor) Receptor Ligands in Atrial Fibrillation: From Genomic Evidence to the Identification of New Players. Circ. Arrhythm. Electrophysiol. 2019;12 doi: 10.1161/CIRCEP.119.007212. [DOI] [PubMed] [Google Scholar]
- 11.Sánchez-Vizcaíno E., Vehí C., Campreciós G., Morcillo C., Soley M., Ramírez I. Heparin-binding EGF-like growth factor in human serum. Association with high blood cholesterol and heart hypertrophy. Growth Factors. 2010;28:98–103. doi: 10.3109/08977190903443030. [DOI] [PubMed] [Google Scholar]
- 12.Matsumoto S., Kishida K., Shimomura I., Maeda N., Nagaretani H., Matsuda M., Nishizawa H., Kihara S., Funahashi T., Matsuzawa Y., et al. Increased Plasma HB-EGF Associated with Obesity and Coronary Artery Disease. Biochem. Biophys. Res. Commun. 2002;292:781–786. doi: 10.1006/bbrc.2002.6720. [DOI] [PubMed] [Google Scholar]
- 13.Wang L., Huang Z., Huang W., Chen X., Shan P., Zhong P., Khan Z., Wang J., Fang Q., Liang G., Wang Y. Inhibition of epidermal growth factor receptor attenuates atherosclerosis via decreasing inflammation and oxidative stress. Sci. Rep. 2017;8:45917. doi: 10.1038/srep45917. [DOI] [PMC free article] [PubMed] [Google Scholar]
- 14.Peng L.-Y., Yu M., Yang M.-X., Liu P., Zhou H., Huang W., Kong H., Xie W.-P. Icotinib Attenuates Monocrotaline-Induced Pulmonary Hypertension by Preventing Pulmonary Arterial Smooth Muscle Cell Dysfunction. Am. J. Hypertens. 2020;33:775–783. doi: 10.1093/ajh/hpaa066. [DOI] [PubMed] [Google Scholar]
- 15.Schreier B., Gekle M., Grossmann C. Role of epidermal growth factor receptor in vascular structure and function. Curr. Opin. Nephrol. Hypertens. 2014;23:113–121. doi: 10.1097/01.mnh.0000441152.62943.29. [DOI] [PubMed] [Google Scholar]
- 16.Ramos J.W. The regulation of extracellular signal-regulated kinase (ERK) in mammalian cells. Int. J. Biochem. Cell Biol. 2008;40:2707–2719. doi: 10.1016/j.biocel.2008.04.009. [DOI] [PubMed] [Google Scholar]
- 17.Rzucidlo E.M., Martin K.A., Powell R.J. Regulation of vascular smooth muscle cell differentiation. J. Vasc. Surg. 2007;45:A25–A32. doi: 10.1016/j.jvs.2007.03.001. [DOI] [PubMed] [Google Scholar]
- 18.Orejudo M., García-Redondo A.B., Rodrigues-Diez R.R., Rodrigues-Díez R., Santos-Sanchez L., Tejera-Muñoz A., Egido J., Selgas R., Salaices M., Briones A.M., Ruiz-Ortega M. Interleukin-17A induces vascular remodeling of small arteries and blood pressure elevation. Clin. Sci. 2020;134:513–527. doi: 10.1042/CS20190682. [DOI] [PubMed] [Google Scholar]
- 19.Melton E., Qiu H. Interleukin-1β in multifactorial hypertension: Inflammation, vascular smooth muscle cell and extracellular matrix remodeling, and non-coding rna regulation. Int. J. Mol. Sci. 2021;22 doi: 10.3390/ijms22168639. [DOI] [PMC free article] [PubMed] [Google Scholar]
- 20.Dubourg V., Schreier B., Schwerdt G., Rabe S., Benndorf R.A., Gekle M. The Functional Interaction of EGFR with AT1R or TP in Primary Vascular Smooth Muscle Cells Triggers a Synergistic Regulation of Gene Expression. Cells. 2022;11:1936. doi: 10.3390/cells11121936. [DOI] [PMC free article] [PubMed] [Google Scholar]
- 21.Schreier B., Schwerdt G., Heise C., Bethmann D., Rabe S., Mildenberger S., Gekle M. Substance-specific importance of EGFR for vascular smooth muscle cells motility in primary culture. Biochim. Biophys. Acta. 2016;1863:1519–1533. doi: 10.1016/j.bbamcr.2016.03.017. [DOI] [PubMed] [Google Scholar]
- 22.Allahverdian S., Chaabane C., Boukais K., Francis G.A., Bochaton-Piallat M.L. Smooth muscle cell fate and plasticity in atherosclerosis. Cardiovasc. Res. 2018;114:540–550. doi: 10.1093/cvr/cvy022. [DOI] [PMC free article] [PubMed] [Google Scholar]
- 23.Jacobsen K., Lund M.B., Shim J., Gunnersen S., Füchtbauer E.M., Kjolby M., Carramolino L., Bentzon J.F. Diverse cellular architecture of atherosclerotic plaque derives from clonal expansion of a few medial SMCs. JCI Insight. 2017;2 doi: 10.1172/jci.insight.95890. [DOI] [PMC free article] [PubMed] [Google Scholar]
- 24.Grootaert M.O.J., Bennett M.R. Vascular smooth muscle cells in atherosclerosis: Time for a re-assessment. Cardiovasc. Res. 2021;117:2326–2339. doi: 10.1093/cvr/cvab046. [DOI] [PMC free article] [PubMed] [Google Scholar]
- 25.Choi Y.S., Choi H.J., Min J.K., Pyun B.J., Maeng Y.S., Park H., Kim J., Kim Y.M., Kwon Y.G. Interleukin-33 induces angiogenesis and vascular permeability through ST2/TRAF6-mediated endothelial nitric oxide production. Blood. 2009;114:3117–3126. doi: 10.1182/blood-2009-02-203372. [DOI] [PubMed] [Google Scholar]
- 26.Li H., Sun B. Toll-like receptor 4 in atherosclerosis. J. Cell Mol. Med. 2007;11:88–95. doi: 10.1111/j.1582-4934.2007.00011.x. [DOI] [PMC free article] [PubMed] [Google Scholar]
- 27.Sorokin V., Vickneson K., Kofidis T., Woo C.C., Lin X.Y., Foo R., Shanahan C.M. Role of Vascular Smooth Muscle Cell Plasticity and Interactions in Vessel Wall Inflammation. Front. Immunol. 2020;11:599415. doi: 10.3389/fimmu.2020.599415. [DOI] [PMC free article] [PubMed] [Google Scholar]
- 28.Regitz-Zagrosek V., Gebhard C. Gender medicine: effects of sex and gender on cardiovascular disease manifestation and outcomes. Nat. Rev. Cardiol. 2023;20:236–247. doi: 10.1038/s41569-022-00797-4. [DOI] [PMC free article] [PubMed] [Google Scholar]
- 29.Kim D., Paggi J.M., Park C., Bennett C., Salzberg S.L. Graph-based genome alignment and genotyping with HISAT2 and HISAT-genotype. Nat. Biotechnol. 2019;37:907–915. doi: 10.1038/s41587-019-0201-4. [DOI] [PMC free article] [PubMed] [Google Scholar]
- 30.Liao Y., Smyth G.K., Shi W. featureCounts: an efficient general purpose program for assigning sequence reads to genomic features. Bioinformatics. 2014;30:923–930. doi: 10.1093/bioinformatics/btt656. [DOI] [PubMed] [Google Scholar]
- 31.Durinck S., Spellman P.T., Birney E., Huber W. Mapping identifiers for the integration of genomic datasets with the R/Bioconductor package biomaRt. Nat. Protoc. 2009;4:1184–1191. doi: 10.1038/nprot.2009.97. [DOI] [PMC free article] [PubMed] [Google Scholar]
- 32.Robinson M.D., McCarthy D.J., Smyth G.K. edgeR: a Bioconductor package for differential expression analysis of digital gene expression data. Bioinformatics. 2010;26:139–140. doi: 10.1093/bioinformatics/btp616. [DOI] [PMC free article] [PubMed] [Google Scholar]
- 33.Love M.I., Huber W., Anders S. Moderated estimation of fold change and dispersion for RNA-seq data with DESeq2. Genome Biol. 2014;15:550. doi: 10.1186/s13059-014-0550-8. [DOI] [PMC free article] [PubMed] [Google Scholar]
- 34.Brionne A., Juanchich A., Hennequet-Antier C. ViSEAGO: A Bioconductor package for clustering biological functions using Gene Ontology and semantic similarity. BioData Min. 2019;12:16. doi: 10.1186/s13040-019-0204-1. [DOI] [PMC free article] [PubMed] [Google Scholar]
- 35.Alexa A., Rahnenfuhrer J. 2020. topGO: Enrichment Analysis for Gene Ontology. R Package Version 2.40.0. https://bioconductor.org/packages/topGO. [Google Scholar]
- 36.Krämer A., Green J., Pollard J., Tugendreich S. Causal analysis approaches in ingenuity pathway analysis. Bioinformatics. 2014;30:523–530. doi: 10.1093/bioinformatics/btt703. [DOI] [PMC free article] [PubMed] [Google Scholar]
Associated Data
This section collects any data citations, data availability statements, or supplementary materials included in this article.
Supplementary Materials
Output of DESeq2 and edgeR for the different comparisons. For each of the latter, are included the log2 fold change and the FDR calculated by DESeq2 and edgeR. The columns “Differentially expressed?” work as follow: 1 indicates that the corresponding gene was considered significantly regulated by the given condition after applying FDR, FPM and log2FC thresholds (see STAR methods); 0 indicates that it was not regulated. For each comparison the conditions compared are indicated as follow “reference vs. condition”.
Output of the GO term enrichment and IPA analyses for the genes regulated by EGFR activation, when considering all VSMC samples indifferently. The results of the GO term enrichment analysis correspond to the heatmap in Figure 1C. Significant values (log(p-value) ≥ 2 and E ≥ 3) are highlighted. The IPA analyses was based on the total list of regulated genes and the activation Z-scores were calculated based on the log2 fold changes.
Output of the GO term enrichment analysis, when considering VSMC samples from the different donors separately. The results of the GO term enrichment analysis correspond to the heatmap in Figure 2G. Significant values (log(p-value) ≥ 2 and E ≥ 3) are highlighted.
Output of the GO term enrichment analysis, when considering genes that are differentially expressed in unstimulated VSMC from the different donors.
Data Availability Statement
-
•
RNA sequencing data (raw and processed) on which is based this study have been deposited at GEO and are publicly available as of the date of publication. The accession number is listed in the key resources table. The original western blot images are available in the supplementary data.
-
•
This paper does not report original code.
-
•
Any additional information required to reanalyse the data reported in this paper is available from the lead contact upon request.