Key Points
-
•
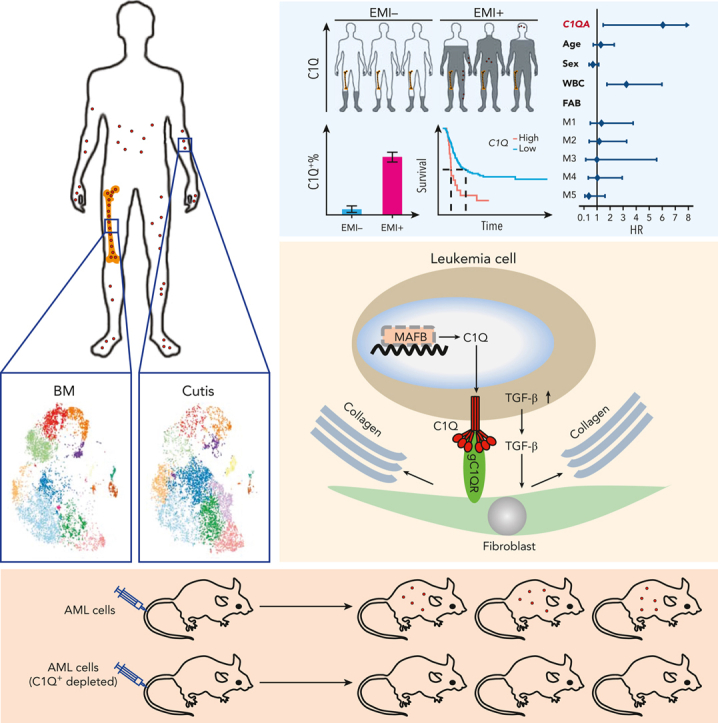
C1Q+ cells represent a highly tissue-infiltrative leukemia population and could reconstitute EMI phenotype of AML.
-
•
Fibroblast attracts C1Q+ leukemia cell via C1Q–globular C1Q receptor recognition and stimulation of transforming growth factor β1 synthesis.
Visual Abstract
Abstract
Extramedullary infiltration (EMI) is a concomitant manifestation that may indicate poor outcome of acute myeloid leukemia (AML). The underlying mechanism remains poorly understood and therapeutic options are limited. Here, we employed single-cell RNA sequencing on bone marrow (BM) and EMI samples from a patient with AML presenting pervasive leukemia cutis. A complement C1Q+ macrophage-like leukemia subset, which was enriched within cutis and existed in BM before EMI manifestations, was identified and further verified in multiple patients with AML. Genomic and transcriptional profiling disclosed mutation and gene expression signatures of patients with EMI that expressed high levels of C1Q. RNA sequencing and quantitative proteomic analysis revealed expression dynamics of C1Q from primary to relapse. Univariate and multivariate analysis demonstrated adverse prognosis significance of C1Q expression. Mechanistically, C1Q expression, which was modulated by transcription factor MAF BZIP transcription factor B, endowed leukemia cells with tissue infiltration ability, which could establish prominent cutaneous or gastrointestinal EMI nodules in patient-derived xenograft and cell line–derived xenograft models. Fibroblasts attracted migration of the C1Q+ leukemia cells through C1Q–globular C1Q receptor recognition and subsequent stimulation of transforming growth factor β1. This cell-to-cell communication also contributed to survival of C1Q+ leukemia cells under chemotherapy stress. Thus, C1Q served as a marker for AML with adverse prognosis, orchestrating cancer infiltration pathways through communicating with fibroblasts and represents a compelling therapeutic target for EMI.
Extramedullary infiltration (EMI) in patients with acute myeloid leukemia (AML) is associated with poor prognosis. Yang et al investigated a patient with extensive leukemia cutis and demonstrated a complement C1Q+ subset of cells within the skin and the bone marrow. Subsequent studies reveal that C1Q overexpression is commonly seen in AML with EMI and relapse. C1Q is both a poor prognostic marker in AML and is associated with EMI, offering a potential novel therapeutic target.
Introduction
Acute myeloid leukemia (AML) is a lethal hematological malignancy that originates from unlimited proliferation of immature progenitors characterized by medullary and extramedullary invasion, with a 5-year overall survival (OS) rate of <30% with chemotherapy.1, 2, 3 Infiltration of bone marrow (BM) malignant leukemia cells into tissues other than the BM to form an extramedullary mass, referred to as extramedullary infiltration (EMI), is a common concomitant symptom of AML, with an incidence at initial diagnosis ranging from 2.5% to 30.5%,4, 5, 6, 7, 8, 9, 10 to even 65% if diagnosed by positron emission tomography/computed tomography.11 Acute myelomonocytic (M4) and monocytic leukemias (M5) are the 2 subtypes of AML that display the most frequent incidence of EMI. Common EMI tissues include skin, peritoneum, lymph nodes, gastrointestinal (GI) tract, genitourinary system, and central nervous system (CNS).5, 6, 7,12, 13, 14, 15 The prognostic significance of EMI involvement is not fully established. Some investigations showed that it serves as an indication of poor prognosis, chemotherapy resistance, or recurrence, including in patients who had received allogeneic hematopoietic stem cell transplantation (HSCT).12,16,17 However, other studies including the ECOG-ACRIN Cancer Research Group trials found no prognostic influence of EMI in AML.12,18,19 In contrast, a number of genetic molecular abnormalities including t(8;21), inv(16), NPM1 mutation, and CD56 expression were indicated to associate with EMI yet with controversial results and limited evidence to construct direct association between cytogenetic abnormalities and incidence of EMI.5,6,20, 21, 22 Overall, the underlying causes of EMI remain elusive and pose a clinical challenge for optimal treatment of patients with EMI.
Herein, we started our investigation with a patient with extremely aggressive monocytic leukemia who had experienced multiple drug resistance and widespread leukemia cutis, a phenomenon defined as cutaneous involvement of AML.21,23 Given the failure of conventional therapies and the lack of alternative therapeutic options, we expected that single-cell RNA sequencing (scRNA-seq) might offer a personalized medicine approach to enable the identification of altered pathways that might be targeted via clinical available strategies. Although, unfortunately, the patient passed away rapidly before any targeted therapy could be developed, we identified the most featured macrophage-like C1Q+ population associated with EMI and adverse outcome and confirmed its unique function in migration. More interestingly, we also illustrated the contribution of tissue fibroblasts, and developed antibodies that could block leukemia migration, which could benefit other patients with AML who experience EMI.
Methods
Patient-derived xenograft (PDX) models from patients with AML
Primary AML cells were transplanted via tail vein into a female, 8- to 10-week-old sublethally irradiated (2.5 Gy) NOD.Cg-PrkdcscidIl2rgtm1Wjl/SzJ (NSG) mice (The Jackson Laboratory). Human cells were assessed by flow cytometry using anti-human CD45, CD33, CD14, CD16, and C1Q. Animal handling was approved by the committee for humane treatment of animals at Shanghai Jiao Tong University School of Medicine.
scRNA-seq and data processing
scRNA-seq was performed using the chromium system. Briefly, cells were loaded, and a library was prepared using the Chromium Single Cell 3 Reagent Kits (version 3). Reads were aligned to the hg38/GRCh38 reference genome and gene expression was quantified to generate the gene barcode unique molecular identifier matrixes using the CellRanger software package (version 3.0.1).
Results
scRNA-seq identifies C1Q+ macrophage-like leukemia cells in P-S1022
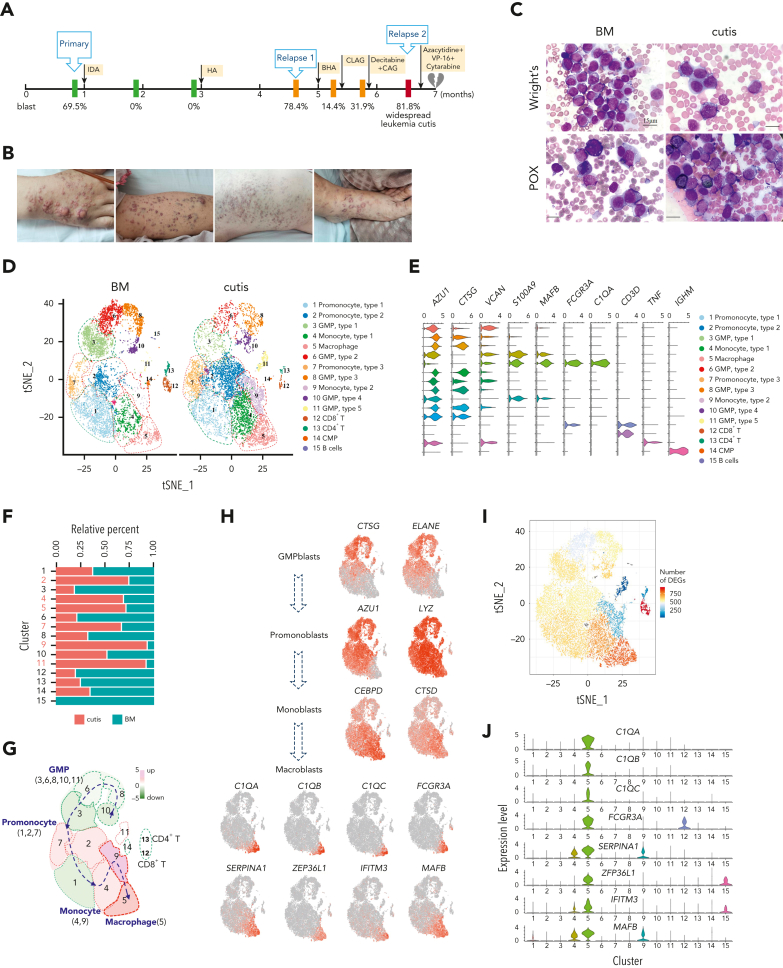
Here, we report a case of M5 in a 39-year-old male patient (P-S1022) who experienced extremely aggressive progression, featuring multiple drug resistance and widespread leukemia cutis (Figure 1A-B). The diagnosis of AML was further confirmed according to negative staining for markers of blastic plasmacytic dendritic cell neoplasm (supplemental Figure 1A, available on the Blood website).4,24 The patient achieved complete remission after induction chemotherapy but became refractory (relapse 1) to a second induction and developed uncontrolled pervasive leukemia cutis (relapse 2) as evidenced by positive peroxidase staining in skin biopsy (Figure 1A-C). We promptly collected BM and cutis samples and conducted scRNA-seq with the expectation to identify potential therapeutic targets. However, the patient passed away owing to disseminated intravascular coagulation and multiple organ failure 7 days after development of leukemia cutis.
Figure 1.
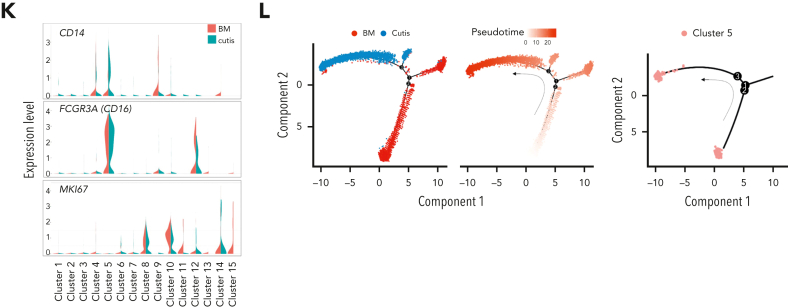
scRNA-seq identified unique C1Q+ macrophage-like leukemia cells in a patient with AML (P-S1022). (A) Disease course of P-S1022 from primary to deceased. (B) Clinical presentations of leukemia cutis. (C) Wright staining and peroxidase staining of BM biopsy collected at relapse 1 and cutis sample of P-S1022. (D) Unsupervised t-distributed stochastic neighbor embedding (t-SNE) plot displaying 18 213 cells from BM and cutis samples of P-S1022. Number- and color-labeled 15 different clusters. Clusters belonging to the same category of cells were distinguished by type 1, 2, or 3. (E) Expression levels (x-axis) of cluster-defining genes in each cluster. Violin plots show the distribution of normalized expression levels of genes and are color coded according to cluster, as in panel D. (F) Frequencies of defined clusters, color coded based on origin (BM vs cutis). Red bar indicates cutis-derived cells; green bar, BM-derived cells. (G) Differentiation trajectory of 15 identified clusters. Arrow begins from the primitive clusters to mature clusters. Red indicates increase and green indicates decrease of frequencies of defined clusters (cutis vs BM). (H) t-SNE projections of selected marker genes of indicated clusters are shown (left). (I) Projection of differentially expressed genes (DEGs) between BM and cutis sample on t-SNE plot. DEGs: |log fold change| >0.5; adjusted P < .05 was derived by a Wilcoxon rank-sum test. (J) Expression levels (y-axis) of featured genes in 15 clusters. Violin plots show the distribution of normalized expression levels of indicated genes. (K) Expression levels of monocyte- (CD14 and FCGR3A/CD16) and proliferation-associated (MKI67) genes are illustrated by violin plots. (L) Trajectory of leukemia cells of BM and cutis samples using the monocle 2 algorithm and pseudotime projections for the distinct transcriptional states, with each point representing a single cell. Three states (1, 2, and 3) are identified. Solid arrows represent cell trajectories defined by single-cell transcriptomes. BHA, bortezomib + homoharringtonine + cytarabine; CAG, cytarabine + granulocyte colony-stimulating factor (G-CSF); CLAG, cladribine + cytarabine + G-CSF; CMP, common myeloid progenitor; GMP, granulocyte-monocyte progenitors; HA, homoharringtonine + cytarabine; IDA, idarubicin + cytarabine.
scRNA-seq was performed on 18 213 cells from BM and cutis samples, and 15 cell clusters were visualized by the t-distributed stochastic neighbor embedding projection using Seurat (Figure 1D; supplemental Table 1). The cell types were assigned according to the expression of established cell-specific marker genes.25, 26, 27 Finally, 4 leukemic populations were referred to as granulocyte-monocyte progenitor–blasts (3, 6, 8, 10, and 11), promonoblasts (1, 2, and 7), monoblasts (4 and 9), and macroblasts (5); and nonmalignant cells including B cells (15) and CD4+ and CD8+ T cells (12 and 13) were clearly recognized (Figure 1D-E). Compared with BM, we observed reduced granulocyte-monocyte progenitor–blasts and increased promonoblasts, monoblasts, and macroblasts in cutis (Figure 1D,F).28, 29, 30, 31, 32 In addition, the pattern summarized as “differentiation trajectory” clearly demonstrated differentiation heterogeneity of monocytic leukemia cells and a more mature state of leukemia cells in cutis than in BM (Figure 1G-H). Intriguingly, projection of the numbers of differentially expressed genes revealed the most prominent transcriptomic changes arose within the macroblasts (Figure 1I; supplemental Table 2), strongly suggesting a critical role of this macrophage cluster in EMI.
We further examined featured genes of each cluster and observed that the macroblasts expressed a high level of mature macrophage markers including C1QA, C1QB, C1QC, FCGR3A(CD16), and MAFB (Figure 1J).29,31, 32, 33, 34, 35 Owing to the unique feature of C1Q gene expression, we named this cluster C1Q+ macroblast. Matched scatterplots revealed a strong correlation between the signature genes of macroblasts (supplemental Figure 1B). Different from monocytic clusters, C1Q+ macroblasts expressed moderate levels of CD14, a high level of CD16, and low level of MKI67, indicating a low proliferative state (Figure 1K). Strikingly, monocle trajectory analysis revealed that C1Q+ macroblast preexisted at very early pseudotime (Figure 1L). Collectively, we identified a unique C1Q+ leukemia population bearing macrophage markers, which is enriched in EMI lesion yet preexisted in primary neoplasm.
C1Q expression associates with EMI and specific oncogenic events
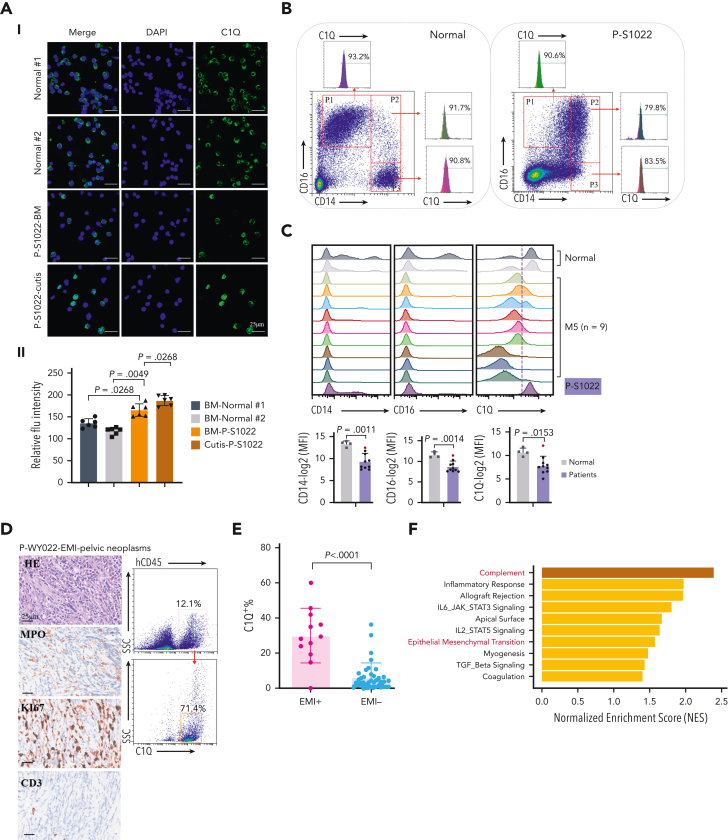
Next, we validated C1Q expression of P-S1022. Compared with healthy donors, mononuclear cells of P-S1022 expressed a significant level of C1Q (Figure 2A). In contrast, patients diagnosed with M5 displayed heterogeneity regarding C1Q expression (Figure 2B-C). C1Q expression was observed on each of the classical (CD14highCD16low), nonclassical (CD14lowCD16high), and intermediate (CD14highCD16high) populations of P-S1022 as well as in healthy donors (Figure 2B).30,31,33
Figure 2.
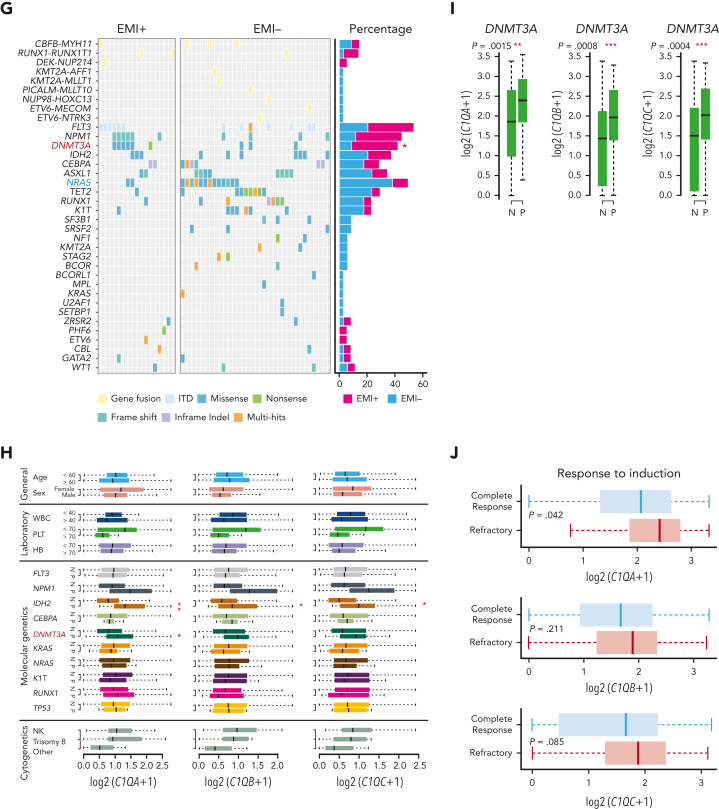
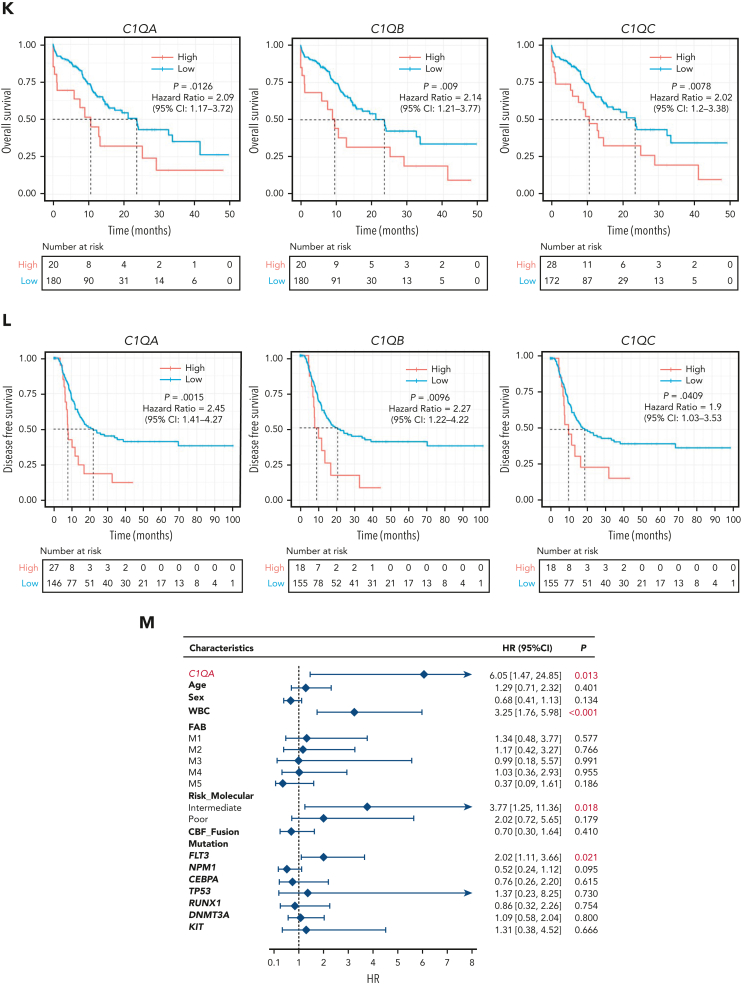
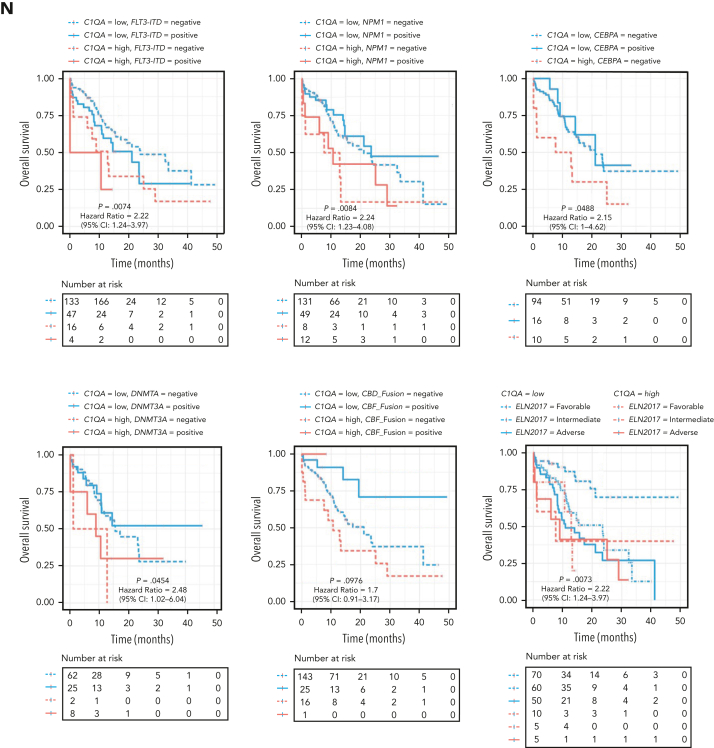
C1Q+ macroblasts exist in patients with AML and predict poor outcomes. (A) Immunofluorescent staining of C1Q in BM from healthy donors (normal #1 and normal #2) and BM and cutis samples from P-S1022 are shown in panel Ai. Quantified fluorescence intensities were shown in panel Aii (bottom). (B) Flow cytometry analysis of CD14, CD16, and C1Q on BM samples of healthy donor (normal) and P-S1022. P1 gate, nonclassical monocyte subset (CD14lowCD16high); P2 gate, intermediate monocyte subset (CD14highCD16high); and P3 gate, classical monocyte subset (CD14highCD16low). (C) Expression of CD14, CD16, and C1Q evaluated by flow cytometry in BM from healthy donors, P-S1022, and other patients with AML-M5 (n = 9). Mean fluorescence intensity was quantified by flow cytometry and is shown (bottom). The red dot indicates P-S1022. (D) The leukemic invasions in pelvic tissue from P-WY022 were analyzed by hematoxylin and eosin (H&E) staining and immunohistochemistry (IHC) staining of MPO, KI67, and CD3. Flow cytometry analysis of human CD45 (hCD45) and C1Q expression on cells is shown (right). (E) Expression of C1Q was evaluated by flow cytometry in BM from patients with AML with (EMI+) or without (EMI−) EMI. (F) Top 10 HALLMARK gene sets from the gene set enrichment analysis between patients with AML with or without EMI. (G) Landscape and percentage for the mutations and fusions in patients with AML with or without EMI. ∗P = .0314. (H) Differential expression of C1QA, C1QB, and C1QC by general (age and sex), laboratory (white blood cell counts, platelets, and hemoglobin), cytogenetic, and molecular genetics characteristics in patients with AML from our inhouse RNA-seq data set (n = 110). P values are shown from 2-sample 1-tailed t test. ∗P < .05, ∗∗P < .01. (I) Differential expression of C1QA, C1QB, and C1QC by the DNMT3A mutation in patients with AML from the BeatAML data set. P values are shown from 2-sample 1-tailed t test. ∗∗P < .01, ∗∗∗P < .001. (J) Differential expression of C1QA, C1QB, and C1QC for the induction response in patients with AML from the BeatAML data set. P values are shown from 2-sample 1-tailed t test. (K) Differences in OS in patients with de novo AML from the BeatAML data set (n = 200) by expression of C1QA, C1QB, and C1QC. P values, hazard ratios (HRs), and 95% confidence interval (CI) are shown from univariate Cox analysis. (L) Differences in DFS in patients with de novo AML from the TCGA data set (n = 173) by expression of C1QA, C1QB, and C1QC. P values, HRs, and 95% CI are shown from univariate Cox analysis. (M) Multivariate Cox analysis of DFS in patients with de novo AML from the TCGA data set (n = 173) according to C1QA expression, age, sex, white blood cell counts, French-American-British classification, risk molecular, CBF fusion, and genetic characteristics. Patient number and percentage, regression coefficient (β), HR, and P values are shown for each parameter. (N) Differences in OS in patients with de novo AML from the BeatAML data set (n = 200) by combination of C1QA expression with presence of FLT3-ITD, NPM1, CEBPA, DNMT3A, and CBF fusion, or 2017 European LeukemiaNet risk stratification. P values, HRs, and 95% CI are shown for C1QA high expression from the multivariate Cox analysis. CBF fusion: RUNX1-RUNX1T1 fusion or CBFB-MYH11 fusion.
Next, high C1Q expression was validated in multiple extramedullary sites including cerebrospinal fluids from CNS involvement of patients with AML (supplemental Figure 1C) and EMI lesion presenting as pelvic neoplasm (P-WY022) whose diagnosis was histologically confirmed (Figure 2D).
To further define the association of C1Q with EMI, we measured C1Q expression by flow cytometry in a larger AML population in which patients were divided into EMI+ (n = 17) and EMI− (n = 33) subgroups. In parallel, targeted DNA sequencing and RNA-seq were conducted to define the molecular pathogenic features. The results showed that the EMI+ group expressed higher levels of C1Q compared with the EMI− (Figure 2E). Gene set enrichment analysis of RNA-seq data disclosed complement as the top enriched pathway (Figure 2F) with C1QA residing in the top 10 upregulated genes in the EMI+ group vs EMI− (supplemental Figure 1D). Targeted DNA-seq illustrated a higher frequency of mutations in DNMT3A (6/17, P = .0314), FLT3 (6/17, P = .2291), and NPM1 (6/17, P = .0609) in the EMI+ group and more NRAS (13/33, P = .0413) mutation in the EMI− group, indicating distinct mutation patterns (Figure 2G; supplemental Table 3). Interestingly, among all the oncogenic aberrations, the association between DNMT3A mutation and C1Q was further validated in our inhouse AML RNA-seq data set (Figure 2H) and in a larger cohort BeatAML36 (Figure 2I), suggesting a correlation between DNMT3A mutation and C1Q expression. Interestingly, previous report showed that DNMT3A mutation leads to leukemic EMI through TWIST1.37 Taken together, these data established the correlation between C1Q and EMI and identified an association of C1Q with specific oncogenic events.
C1Q is an adverse prognosis marker in AML
To understand the prognostic significance of C1Q expression in AML, we analyzed C1Q genes (C1QA, C1QB, and C1QC) in publicly available data from BeatAML (n = 200),36 The Cancer Genome Atlas (TCGA) (n = 173),38 and the Leucegene project (n = 373) cohorts. Firstly, C1QA high expression showed significant correlation with refractory patients (Figure 2J). Secondly, high levels of C1Q genes were observed in the adverse patient group according to 2017 European LeukemiaNet classification in BeatAML,39 and in the group with poor molecular feature in the TCGA cohort (supplemental Figure 1E-F). Thirdly, deceased patients showed significantly higher expression of C1Q compared with living patients (supplemental Figure 1G). Furthermore, univariate Cox regression analysis revealed an association of high expression of C1Q genes with decreased OS in BeatAML (Figure 2K) and Leucegene cohorts (supplemental Figure 1H) and decreased disease-free survival (DFS) in TCGA (Figure 2L). Collectively, C1Q expression was a predictor for worse clinical outcome of AML.
The prognostic significance of the C1Q was further confirmed in a multivariate Cox analysis. For the DFS analysis, the poor prognostic impact of high white blood cell counts, intermediate risk stratification, and FLT3 mutation remained statistically significant, consistent with previous reports.5,8,9 Strikingly, C1QA overexpression was proven to be an independent DFS marker with a hazard ratio of 6.05 in the TCGA cohort (Figure 2M; supplemental Table 4). Although C1Q in BeatAML did not show independent prognostic value for OS (P = .805 for C1QA), C1QA overexpression remained significantly associated with worse OS when survival analysis was applied to C1QA plus FLT3-ITD, NPM1, CEBPA, DNMT3A, CBF fusion, or 2017 European LeukemiaNet classification (Figure 2N). Overall, we propose that C1Q serves as an adverse prognostic marker for AML.
C1Q was upregulated upon relapse in P-S1022 and is associated with early recurrence
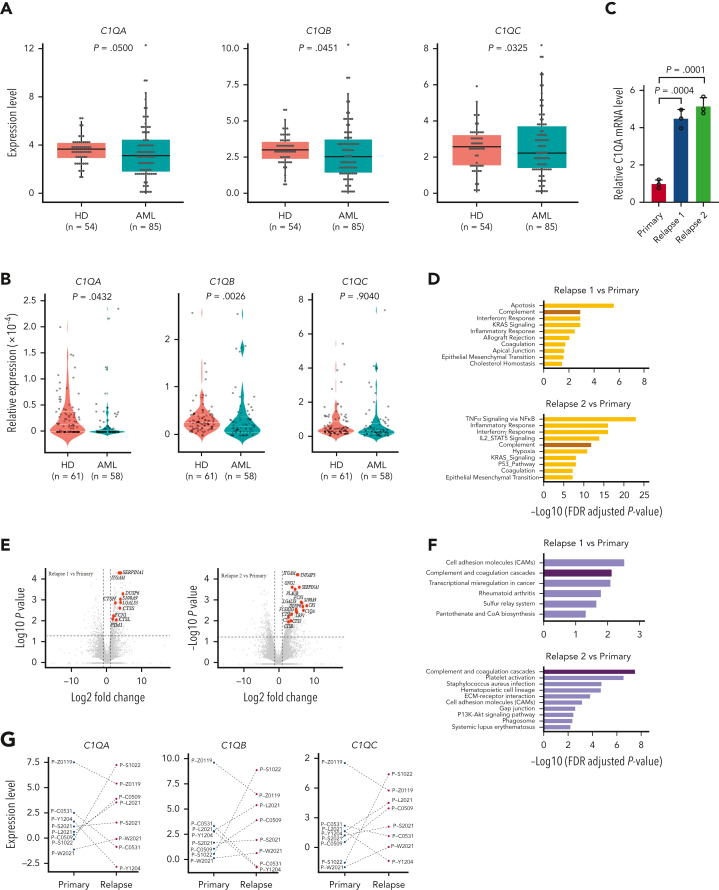
To clarify the status of C1Q across patients with AML, we collected samples at primary stage as well as from healthy donors and performed RNA-seq (Figure 3A) and quantitative proteomic analysis (Figure 3B). Surprisingly, we observed a lower level of C1Q in patients with AML compared with healthy donors, which is similar in CD34+ populations. Further, AML presents lower C1Q level compared to other types of cancers (supplemental Figure 2A-B). Among all the French-American-British classification subtypes of AML, M4, and M5 displayed the highest level of C1Q expression in BeatAML and Leucegene (supplemental Figure 2C), supporting the notion that monocytic cells are the major origin of C1Q.40 The seemingly contradictory results prompted us to suspect that C1Q might be regulated during the progression of disease. We measured C1Q level on longitudinally collected samples during treatment (primary and relapse 1 and 2) of P-S1022 and observed elevated C1Q upon relapses (Figure 3C). RNA-seq (Figure 3D-E) and quantitative proteomic analysis (Figure 3F; supplemental Tables 5 and 6) revealed enrichment of complement pathway. Specifically, C1QA, C1QB, and C1QC were remarkably increased during relapses (Figure 3G-H). Patients who expressed high levels of C1Q either at primary (P-Z0119) or during progression (P-S1022 and P-L2021) showed early relapse after HSCT or resistance (Figure 3G-I; supplemental Figure 2D; supplemental Table 7).
Figure 3.
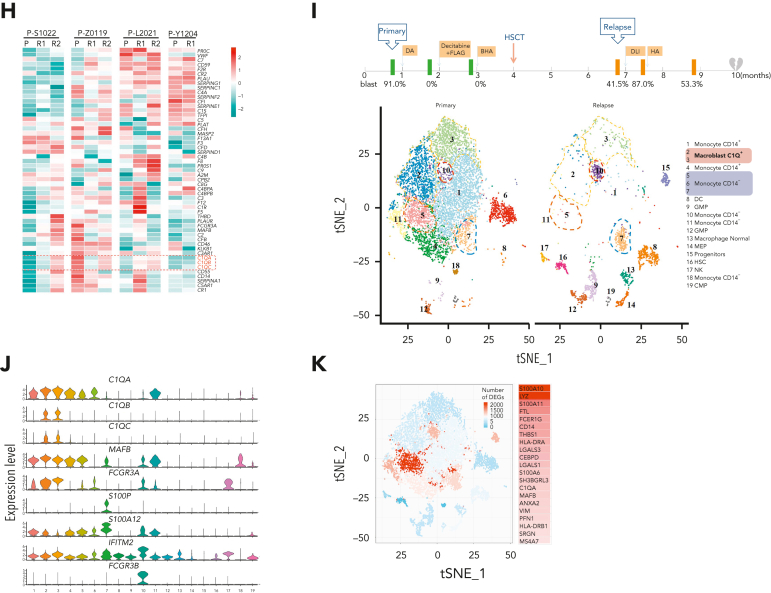
C1Q level is modulated during disease courses and is associated with early recurrence after HSCT. (A) RNA-seq analysis of BM mononuclear cell samples collected from patients with de novo AML (AML, n = 85) and healthy donors (HDs, n = 54). The messenger RNA (mRNA) expression level of C1QA, C1QB, and C1QC are shown. (B) Quantitative proteomic analysis of BM mononuclear cell samples collected from patients with de novo AML (AML, n = 58) and healthy donors (HDs, n = 61). The protein level of C1QA, C1QB, and C1QC are shown. (C) C1QA mRNA level measured by quantitative polymerase chain reaction (qPCR) in leukemia blasts of P-S1022 at the time point of primary, relapse 1, and relapse 2. P value was calculated by 2-sample t test. (D) RNA-seq analysis and pathway enrichment of indicated samples of P-S1022. (E) Volcano plot of DEGs that are upregulated (red) in relapse 1 vs primary (top) or relapse 2 vs primary (bottom). Relevant DEGs identified in the pathways are labeled. P value was derived by Wilcoxon rank-sum test. (F) Quantitative proteomic analysis and pathway enrichment of samples in panel D. (G) C1QA, C1QB, and C1QC mRNA expression levels on longitudinally collected samples of patients with AML (n = 8) measured by RNA-seq. (H) Relative expression heat map of complement genes on longitudinally collected samples of indicated patients with AML. (I) Timeline of disease course of P-Z0119 from primary to deceased (top). Unsupervised t-SNE plot displaying 13 097 cells of primary and relapse post-HSCT from P-Z0119 colored by shared nearest neighbor clusters. (J) Violin plots show the distribution of normalized expression levels of genes and are color coded according to clusters in panel I. (K) Projection of DEGs between primary and relapse samples from P-Z0119. The heat map shows the DEGs within cluster 5. DEG: |log fold change| >0.5; adjusted P < .05 was derived by a Wilcoxon rank-sum test. DA, daunorubicin + cytarabine; DLI, donor lymphocyte infusion; FLAG, fludarabine + cytarabine + G-CSF; P, primary; R, relapse.
Based on the aforementioned findings, to further confirm the association of C1Q with disease progression, we conducted scRNA-seq on another patient with AML (P-Z0119) who experienced early relapse post-HSCT. Unsupervised clustering analysis identified 19 distinct cell clusters (Figure 3I; supplemental Table 8). Nonmalignant cells including hematopoietic stem cells, common myeloid progenitors, granulocyte-monocyte progenitors, megakaryocyte erythroid progenitors, natural killer cells, dendritic cells, and CD4+ and CD8+ T cells were clearly recognized (Figure 3I). Intriguingly, despite high heterogeneity among all the clusters in relapse samples, 2 C1Q+ macrophage-like leukemia clusters (2 and 3) were identified with 5 marker genes (C1QA, C1QB, C1QC, FCGR3A, and MAFB), identical to that of C1Q+ macroblasts from P-S1022 (Figure 3J; supplemental Figure 3A-B). C1QA and MAFB were further identified as the most significantly regulated genes of cluster 5 in differentially expressed gene analysis (Figure 3K). Overall, these data indicate that C1Q could be associated with early relapse of leukemia.
C1Q+ leukemia cells are cancer-initiating cells
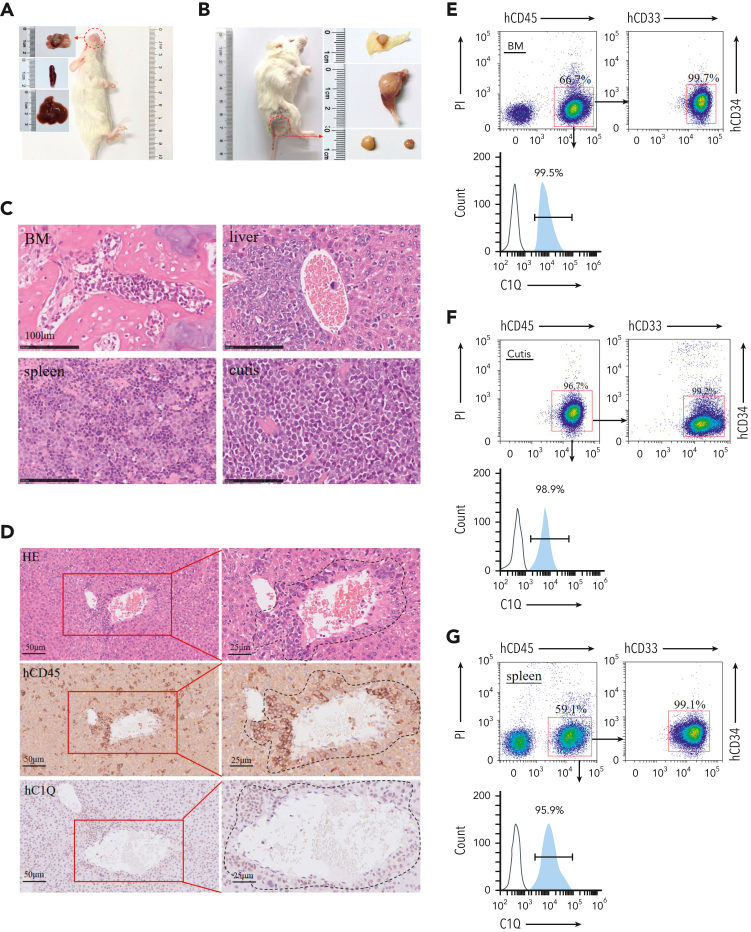
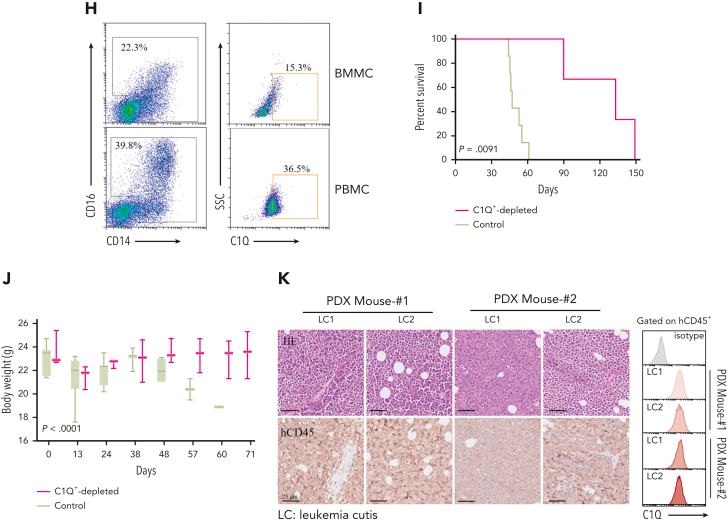
To investigate the oncogenic role of C1Q in AML cells in vivo, we constructed a PDX model by injecting human CD45+ (hCD45+) cells purified from BM of P-S1022 at relapse 1 into mice. The mice died of leukemia rapidly as evidenced by enlarged spleen and infiltration of leukemia cells into BM, spleen, and liver (Figure 4A-C), which displayed positive staining for hCD45 and hCD33 (Figure 4D-G). Interestingly, nearly 100% of hCD45+ cells recovered from NSG mice were C1Q+ (Figure 4D-G; supplemental Figure 4A), in contrast to 36.5% and 15.3% positive for peripheral blood and BM mononuclear cell samples, respectively, from P-S1022 (Figure 4H), indicating a tumorigenic advantage of C1Q+ cells. Depletion of C1Q+ cells remarkably reduced tumor-propagating potential as evidenced by extended survival of recipient mice and delayed body weight loss (Figure 4I-J; supplemental Figure 4B), suggesting that C1Q+ cells are essential for leukemia progression.
Figure 4.
C1Q+populations are cancer-initiating cells. (A-B) Pictures of PDX recipient-mice constructed by injecting 1 million primary cells of P-S1022. Red circles and arrows indicate the leukemia cutis. (C-D) The leukemic invasions in BM, spleen, liver, and cutis were analyzed by H&E staining (C-D), or IHC staining of hCD45 and hC1Q in liver (D). Flow cytometry analysis of human CD45, CD33, CD34, and C1Q (hCD45, hCD33, hCD34, and hC1Q) expression on cells recovered from BM (E), cutis (F), or spleen (G) of PDX recipient mice. (H) Flow cytometry sorting of BM and peripheral blood sample of P-S1022 based on expression of C1Q. (I-J) Survival curve and body weight of PDX mice injected with one million cells sorted from P-S1022. The hCD45+ cells of P-S1022 were sorted to deplete C1Q+ cells and injected into NSG mice through tail vein. P value was calculated by log-rank (Mantel-Cox) test (I) and 2-sample t test (J). (K) The leukemia cutis from PDX mice was analyzed by H&E and IHC staining of hCD45. Flow cytometry analysis of C1Q expression on cells is shown (right).
Notably, all passage 1–recipient mice (P-S1022) developed multiple EMI lesions including leukemia cutis, confirmed by infiltration of leukemia cells and positive staining of hCD45 and hCD33 (Figure 4A-C,F). In contrast, PDX mice engineered using cells from P-W2021, P-C0531, and P-Y1204, which displayed low levels of C1Q, did not show any sign of leukemia cutis (supplemental Figure 4C). Moreover, hCD45+ cells from cutis of P-S1022 or from cutis of passage 1 PDX mice could be fully engrafted in recipient mice (supplemental Figure 4D,F), which was also possible in a PDX model of P-WY022 successfully constructed through injection of pelvic neoplasm cells, as evidenced by infiltration of leukemia cells into spleen and liver (supplemental Figure 4G). Importantly, C1Q expression was confirmed to be highly presented in multiple leukemia cutis collected from different P-S1022 PDX mice (Figure 4K) as well as in liver and spleen of P-WY022 PDX (supplemental Figure 4G). Overall, these data demonstrate full oncogenic potential of EMI leukemia cells and universal expression of C1Q in various EMI locations.
C1Q+ leukemia cells show higher migration capability, promoted by fibroblasts
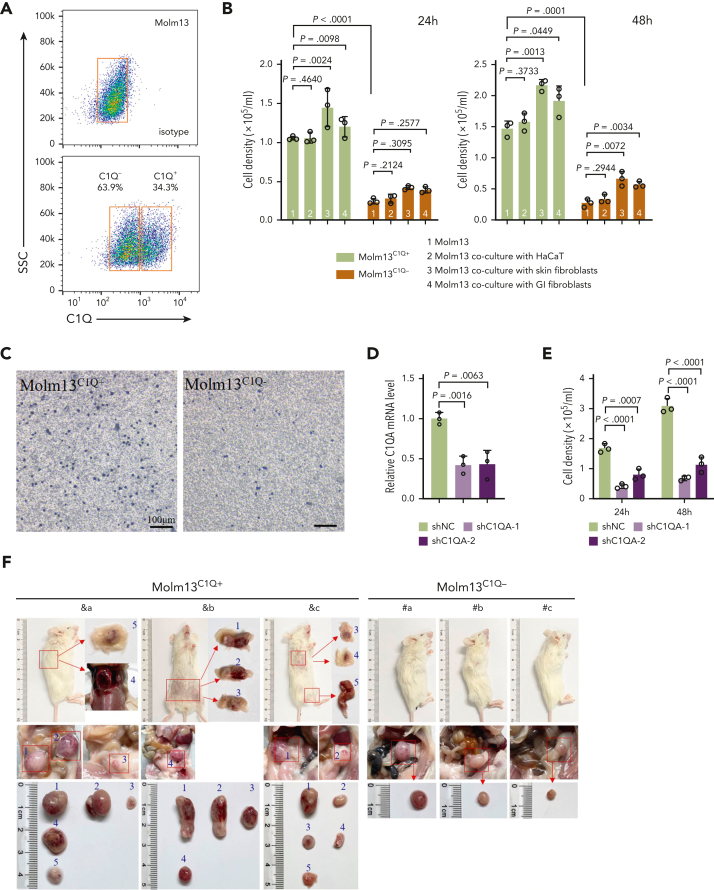
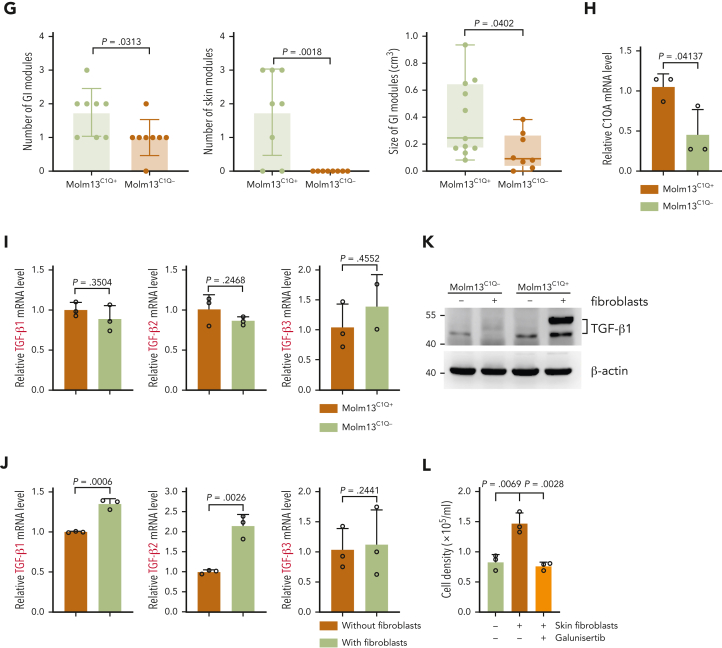
The frequency of C1Q+ varied among human leukemia cell lines (supplemental Figure 5A). To gain insight into the mechanism through which C1Q promotes leukemia, we sorted C1Q+ and C1Q– cells from Molm13 (Figure 5A). No significant differences in proliferation and the 50% inhibitory concentration to chemotherapy drugs including etoposide, daunorubicin, and cytarabine was observed between Molm13C1Q+ and Molm13C1Q– populations or upon C1Q depletion (supplemental Figure 5B-D). However, Molm13C1Q+ presented remarkably increased migration capacity (Figure 5B-C), which was abrogated upon depletion of C1Q (Figure 5D-E). Next, we transplanted cells into NSG mice and observed significantly more EMI nodules in skin and GI tract, and larger GI metastasis nodules in Molm13C1Q+ recipients, with zero skin nodules in the Molm13C1Q– group (Figure 5F-G).
Figure 5.
C1Q+Molm13 cells are highly infiltrative toward tissue fibroblasts. (A) Flow cytometry sorting of Molm13 based on expression of C1Q. (B-C) Transwell migration assay of Molm13C1Q+ and Molm13C1Q−, or Molm13 cocultured with HaCaT, skin fibroblasts, or GI fibroblasts. (D) qPCR analysis of C1QA in Molm13 cells upon depletion of C1QA through shRNA (shC1QA-1 and shC1QA-2). (E) Transwell migration assay of Molm13 cells upon C1QA depletion. (F) NSG mice were injected with one million of Molm13C1Q+ or Molm13C1Q− cells and metastasis nodules in skin and intestine are numbered and shown. (G) Number or size of skin or GI nodules were calculated. (H-I) qPCR analysis of C1QA (H) and TGF-β1, TGF-β2, and TGF-β3 (I) in Molm13C1Q+ and Molm13C1Q− cells. (J) qPCR analysis of TGF-β1, TGF-β2, and TGF-β3 in Molm13C1Q+ cells cocultured with or without fibroblasts. (K) Western blot analysis of TGF-β1 of Molm13C1Q+ and Molm13C1Q− cells cocultured with or without fibroblasts. (L) Transwell migration assay of Molm13C1Q+ cells upon skin fibroblast coculture and TGF-β1 inhibitor galunisertib treatment.
Gene set enrichment analysis of our EMI+ and EMI– AML samples revealed an enrichment of the epithelial mesenchymal transition signature in the EMI+ group, supporting a highly migrative characteristic (Figure 2F). Transcriptomic profiling of C1Q+ clusters between BM and cutis of P-S1022 identified upregulation of CXCL2 and CXCL8 in cutis,41 which was associated with worse survival and were impeded by shC1Q (supplemental Figure 5E-G). RNA-seq data identified an enrichment of cell adhesion in Molm13C1Q+ cells (supplemental Figure 5H). Overall, these data demonstrate that C1Q endowed cancer cells the ability to migrate.
To understand whether EMI target tissues contribute to the metastasis of leukemia cells, we cocultured epithelium or fibroblasts with Molm13 cells in a transwell migration assay. Skin and GI fibroblasts, but not epithelium, could remarkably promote migration of Molm13C1Q+ but not Molm13C1Q− cells (Figure 5B). Tumor-derived transforming growth factor β (TGF-β) is a critical factor that accelerates metastasis through activating fibroblasts.42 Similar levels of TGF-β were observed between Molm13C1Q+ and Molm13C1Q− cells (Figure 5H-I). Interestingly, TGF-β1 and TGF-β2, but not TGF-β3, were significantly upregulated in Molm13C1Q+ cells upon coculture with skin fibroblasts (Figure 5J-K). Furthermore, inhibition of TGF-β1 by galunisertib could remarkably block migration of Molm13C1Q+ to skin and GI fibroblasts (Figure 5L; supplemental Figure 6A). These data demonstrate that fibroblasts stimulated TGF-β1 synthesis of Molm13C1Q+ cells and enabled migration.
C1Q+ leukemia cells communicate with tissue fibroblasts via surface C1Q-gC1QR signaling
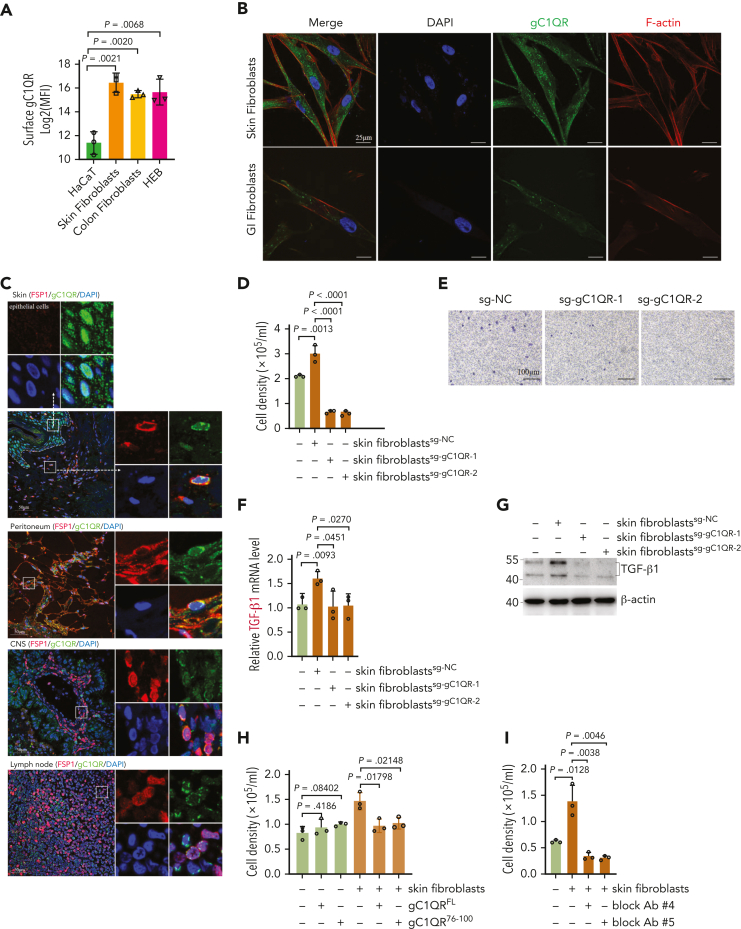
Next, we explored the interaction between C1Q+ leukemia cells and fibroblasts. A much higher level of surface globular C1Q receptor (gC1QR) was observed on fibroblasts than epithelium (Figure 6A).40,43, 44, 45 Moreover, immunofluorescence staining of gC1QR colabeled with fibroblast-specific protein 1 in human skin, peritoneum, lymph nodes, and brain tissue sections (Figure 6C), the most frequently affected sites of EMI,5,10,12 as well as in cultured primary skin and GI fibroblasts and CNS fibroblast HEB cells colabeled with F-actin, (Figure 6B; supplemental Figure 6B) confirmed the expression of gC1QR on these tissue fibroblasts. Importantly, deletion of gC1QR in skin and GI fibroblasts significantly diminished its ability to facilitate migration of Molm13C1Q+ cells and induction of TGF-β1 (Figure 6D-G, supplemental Figure 6C-E). Preincubation of recombinant gC1QR or gC1QR76-100 (C1Q binding domain) with Molm13C1Q+ cells to preoccupy the C1Q-gC1QR binding site blocked the migration of Molm13C1Q+ cells toward fibroblasts (Figure 6H; supplemental Figure 6F-G). These results demonstrate that C1Q-gC1QR–mediated communication of leukemia cells with fibroblasts is necessary for induction of migration and TGF-β1.
Figure 6.
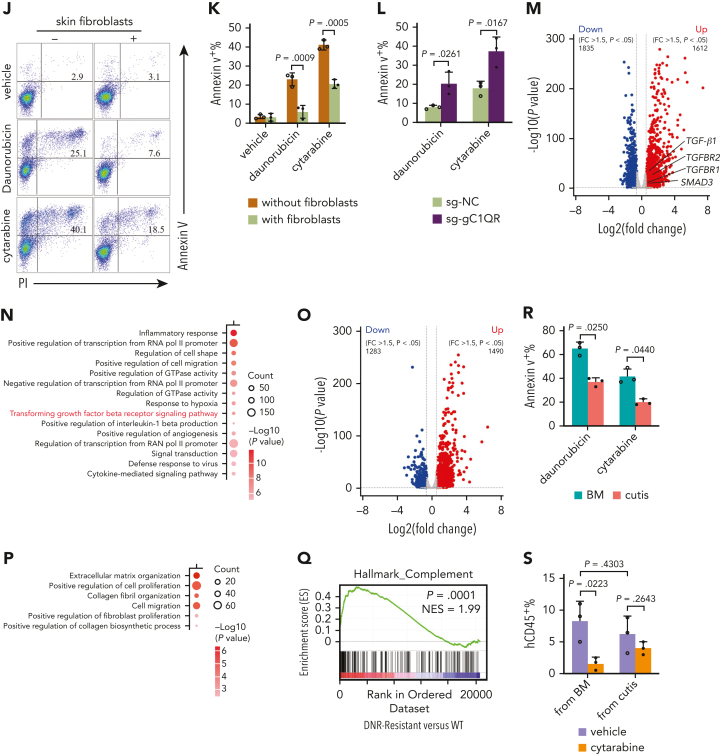
C1Q+ leukemia cells communicate with fibroblasts via surface C1Q-gC1QR signaling. (A) Surface expression of gC1QR on epidermal cells (HaCaT), skin fibroblasts, colon fibroblasts, and HEB cells were evaluated by flow cytometry. Mean fluorescence intensity quantified by flow cytometry is shown. (B) Immunofluorescent staining for gC1QR and F-actin in nonpermeabilized skin fibroblast and GI fibroblast. (C) Immunofluorescent costaining for gC1QR (green), fibroblast-specific protein 1 (red), and the nucleus (4′,6-diamidino-2-phenylindole, blue) on skin, peritoneum, CNS, and lymph node tissue sections. The dashed line indicates the boundary between epidermis and dermis in skin section. The marked regions are enlarged (top or right). (D-E) Transwell migration assay of Molm13C1Q+ cells cocultured with skin fibroblasts with or without gC1QR deletion. (F-G) qPCR (F) and western blot (G) analysis of TGF-β1 of Molm13C1Q+ cells cocultured with skin fibroblasts with or without gC1QR deletion. (H-I) Transwell migration assay of Molm13C1Q+ cells in the presence of recombinant gC1QR (H) or antibodies against C1Q binding sequence of gC1QR (I). (J-K) Molm13C1Q+ cells cocultured with skin fibroblasts were treated with daunorubicin or cytarabine for 48 hours. Cell apoptosis was measured by annexin V/propidium iodide (PI) staining. Representative flow cytometry plots (J) and quantified apoptosis (K) are shown. (L) Molm13C1Q+ cells cocultured with skin fibroblasts with or without gC1QR deletion were treated with daunorubicin or cytarabine. Cell apoptosis was measured by annexin V/PI staining. (M-N) Molm13C1Q+ cells cocultured with or without fibroblasts were subjected to RNA-seq. A volcano plot of DEGs (M) and top 15 biological processes for upregulated DEGs (N) are shown. Relevant DEGs identified in the pathways are labeled. (O-P) Fibroblasts cocultured with or without Molm13C1Q+ were subjected to RNA-seq. A volcano plot of DEGs (O) and enriched biological processes for upregulated DEGs (P) are shown. (Q) Gene set enrichment analysis for complement pathway in daunorubicin-resistant (DNR-R) and sensitive (WT) HL-60 leukemia cells. (R) The hCD45+ cells of BM and leukemia cutis from PDX mice were treated with daunorubicin or cytarabine. Cell apoptosis was measured by annexin V/PI staining. (S) The percentage of living hCD45+ cells was evaluated by flow cytometry in BM from recipient mice injected with BM or leukemia cutis–derived cells after cytarabine treatment (10 mg/kg, once daily for 3 consecutive days, intraperitonially).
We further analyzed 3 publicly available scRNA-seq data sets of dermal fibroblasts and found no significant difference regarding gC1QR expression between different fibroblasts subpopulations, indicating a universal expression of gC1QR in dermal fibroblasts despite their potential functional heterogeneity (supplemental Figure 6H-I).46, 47, 48 In addition, TGF-β1 treatment of fibroblasts did not increase gC1QR expression (supplemental Figure 6J).
Finally, we generated monoclonal blocking antibodies against the C1Q binding sequence of gC1QR (supplemental Figure 6K).44,49 Clone numbers 4 and 5 significantly impeded migration of Molm13C1Q+ cells in the presence of fibroblasts (Figure 6I), suggesting a potential for C1Q-targeted therapy in blocking EMI.
Fibroblasts promote chemoresistance of C1Q+ leukemia cells
Our analysis of BeatAML illustrated that high C1QA expression correlated with refractory to chemotherapy (Figure 2J). We speculate that extramedullary tissues could contribute to leukemia survival under chemotherapy stress. We cocultured Molm13C1Q+ cells with skin fibroblasts followed by exposure to daunorubicin or cytarabine. Survival of the tumor cells was dramatically enhanced upon coculture with fibroblasts rather than with gC1QR-depleted fibroblasts (Figure 6J-L).
Next, RNA-seq was performed on both leukemia cells and fibroblasts to profile the pathways that may contribute to chemoresistance (supplemental Figure 6L). Upon coculture, 1612 genes were upregulated and 1835 were downregulated in Molm13C1Q+ cells. Gene ontology analysis illustrated enrichment of TGF-β receptor signaling.50 Notably, multiple pathways known to be associated with therapy resistance, including upregulated cell shape and positive regulation of angiogenesis accompanied by downregulated cell division, were observed (Figure 6M-N; supplemental Figure 6M).50,51 In contrast, skin fibroblasts also underwent remarkable transcriptional reprogramming with enrichment of extracellular matrix synthesis and organization pathways, which have been documented to contribute to chemoresistance (Figure 6O-P; supplemental Figure 6N).50,52 These data disclose chemoresistant-favorable reprogramming of both cancer cells and fibroblasts upon coculture. In addition, we analyzed publicly available transcriptomic data obtained from daunorubicin-resistant and sensitive (WT) HL-60 leukemia cells and found that genes upregulated in daunorubicin-resistant cells showed a strong enrichment for complement pathway (Figure 6Q),53 suggesting an association of complement with chemoresistance.
Furthermore, we treated cells of leukemia cutis and BM samples from PDX mice with doxorubicin and cytarabine and found that hCD45+ cells from BM were more sensitive to both drugs (Figure 6R). Next, we employed a passage 2 PDX model by injecting same amount of hCD45+ cells collected from BM or cutis of passage 1 P-S1022–PDX mice followed by cytarabine treatment. The percentage of living hCD45+ cells were higher in the recipients of leukemia cutis–derived cells (Figure 6S), suggesting a more chemoresistant feature of EMI leukemia in vivo.
Overall, these data demonstrate that cell-to-cell communication leads to reprogramming of both cancer cells and fibroblasts to create a microenvironment to accommodate leukemia.
MAFB modulates C1Q and TGF-β expression and contributes to EMI
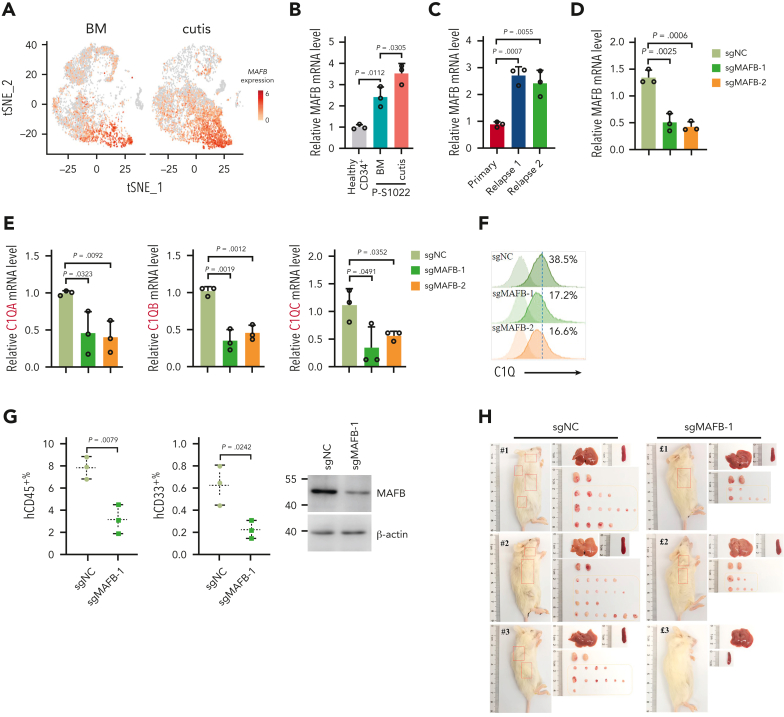
Among the marker genes of C1Q+ macroblast, the transcription factor MAF BZIP transcription factor B (MAFB) has been documented as a critical regulator of C1Q expression and was significantly upregulated in EMI tissue (Figure 7A-B; supplemental Figure 7A)35 and upon relapse, in parallel with its known regulators interleukin 10 and retinoic acid receptor α (Figure 7C; supplemental Figure 7B-D). Importantly, MAFB depletion significantly decreased C1Q, whereas ectopically expression of Flag-tagged MAFB increased C1Q levels in Molm13 cells (Figure 7D-F; supplemental Figure 7E). Chromatin immunoprecipitation assay revealed MAFB occupancy at the MAF recognition elements of C1Q gene (supplemental Figure 7F) in Molm13 cells,35 indicating a direct modulation.
Figure 7.
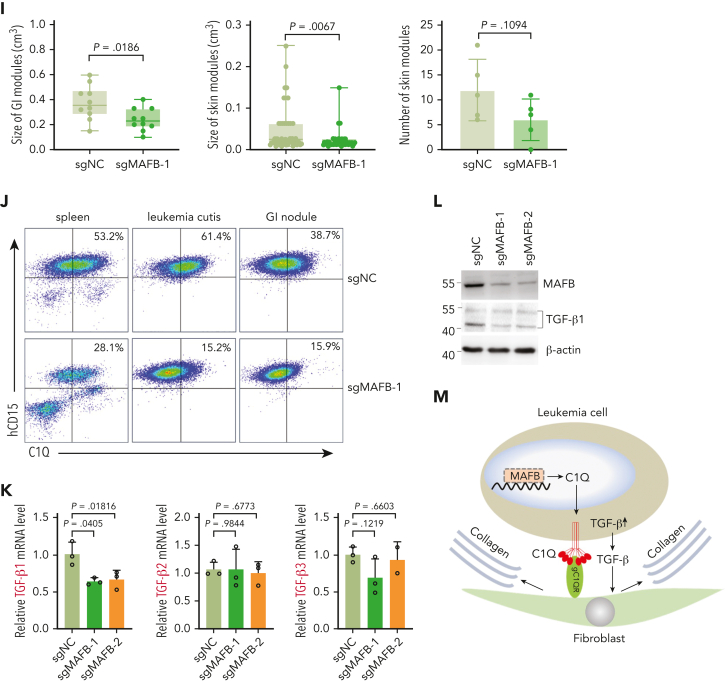
MAFB modulates C1Q and TGF-β expression and contributes to EMI. (A) t-SNE projection of MAFB in BM and cutis samples of P-S1022. (B) qPCR analysis of MAFB in healthy BM CD34+ cells and BM and cutis samples from P-S1022. (C) qPCR analysis of MAFB in leukemia blasts of P-S1022 at the time point of primary, relapse 1, and relapse 2. (D-E) qPCR analysis of MAFB (D), C1QA, C1QB, and C1QC (E) in Molm13 cells upon depletion of MAFB through single-guide RNA (sgRNA) (sgMAFB-1 and sgMAFB-2). (F) Flow cytometry analysis of C1Q expression on Molm13 cells upon MAFB depletion. (G) PDX models were constructed with BM cells from P-S1022 infected with sgNC or sgMAFB-1. The percentage of hCD45+ and hCD33+ cells in BM from recipient mice were evaluated by flow cytometry. Western blot analysis of MAFB is shown (right). (H) NSG mice were injected with 2 million Molm13-sgNC or Molm13-sgMAFB-1 cells and metastasis nodules in skin and GI tissues are shown. (I) Number or size of skin or GI nodules were calculated. (J) Flow cytometry analysis of human CD45 and C1Q expression on cells recovered from spleen, leukemia cutis, and GI nodules of PDX recipient mice. (K) qPCR analysis of TGF-β1, TGF-β2, and TGF-β3 in Molm13C1Q+ cells upon MAFB depletion. (L) Western blot analysis of TGF-β1 upon MAFB depletion in Molm13 cells. (M) A model proposing the mechanism by which C1Q-gC1QR signaling promotes leukemia cell migration.
Furthermore, PDX models constructed with cells from P-S1022 infected with sgNC or sgMAFB showed a lower proportion of peripheral hCD45+ and hCD33+ cells in the sgMAFB group (Figure 7G). CDX models constructed with MAFB-depleted Molm13C1Q+ cells displayed a smaller number and size of skin and GI nodules compared with the sgNC group (Figure 7H-I; supplemental Figure 7G). In parallel, expression of C1Q of hCD45+ cells recovered from spleen, skin, and GI nodules was significantly decreased in the sgMAFB group (Figure 7J), providing in vivo evidence for MAFB in modulating EMI and C1Q expression.
To explore the mechanism of the expression abnormalities of the MAFB-C1Q axis, we performed whole exome sequencing for P-S1022 and found no point mutation or copy number variations in C1Q and MAFB genes (supplemental Table 9). Next, we found that 5 out of 200 patients concurrently harbored the copy number amplifications of the C1Q genes and found high levels of C1Q in the TCGA cohort (supplemental Figure 7H). Characterization of clinical information revealed that all 5 individuals presented complex karyotypes and poor outcomes (supplemental Table 10). The copy number variation of MAFB was identified in only 2 individuals (supplemental Figure 7H). These data did not support genomic aberrations as the dominant mechanism of C1Q and MAFB overexpression. Moreover, C1Q was highly expressed in patients with mutated DNMT3A (Figure 2H-I). Interestingly, MAFB level was also revealed to be significantly increased in patients positive for DNMT3AR882 in BeatAML (supplemental Figure 7I), which is supported by a recent report showing association of DNMT3AR882 mutation with elevated expression of MAFB in patients with M4/M5 AML.54
A previous report demonstrated that aberrant TGF-β1 expression was controlled by MAFB in high myopia.55 In Molm13C1Q+ cells, deletion of MAFB could significantly decrease the level of TGF-β1, whereas ectopic expression of MAFB increased TGF-β1 levels (Figure 7K-L; supplemental Figure 7E).
Overall, these findings strengthen the role of MAFB-C1Q and MAFB–TGF-β signaling in the EMI of leukemia (Figure 7M).
Discussion
It is still clinically challenging to conduct timely treatment owing to a lack of understanding of EMI. In-depth study of a single patient using scRNA-seq followed by successful intervention has been achieved in several diseases.56, 57, 58 Inspired by these studies, we had expected similar result for P-S1022. Although rapid disease progression of this patient did not permit timely identification of clinical targetable markers, we did identify a population that unexpectedly bear mature macrophage markers including C1Q, which was further confirmed in multiple patients with AML.1,25 Our data also demonstrate the importance of eradicating tissue-resident EMI cells for long-term disease control owing to the ability of cutaneous blasts to reconstruct systematic AML.5
C1Q, a collagen-like glycoprotein, is the recognition unit of the C1 component of complement. Binding of C1Q to appropriate targets leads to sequential activation and cleavage of complement components, which plays a fundamental role in innate immunity.43 Data accumulated over the last few years have revealed noncanonical functions of C1Q and its receptors in cancers. Ghebrehiwet et al showed that addition of C1Q to cultured leukemia cells inhibited their growth.44,59 More recently, however, stromal-derived C1Q displayed cancer-promoting effects in a number of human cancers including colon, lung, breast, pancreatic adenocarcinoma, and melanoma.60,61 Interestingly, another complement component, C5a, generated in the tumor microenvironment, favored human cervical cancer growth yet inhibited murine mammary sarcoma.62 These seemingly opposite effects of complement components urged a deeper understanding of complement components in cancer.31,33
There are 2 well-known types of C1Q receptors, calreticulin and gC1QR (gC1QR/p33), the latter exhibits a high affinity for the globular domain of C1Q.63 Blocking the binding between gC1QR and C1Q reportedly inhibits cancer cell proliferation.45,64 The expression discrepancy of surface gC1QR partially explains how fibroblasts but not epithelial cells effectively attracted the migration of leukemia cells. How the leukemia cell homes to targeted tissues, and the signaling pathway after C1Q and its receptors recognition still require investigation. In addition, because tissue distribution of chemotherapy drugs or immune effector cells between BM and skin may also contribute to EMI and thus recurrence of leukemia, there is a requirement for future studies to explore other potential mechanisms.48
Successful intervention with targeted therapy guided by the use of scRNA-seq and multiomic analysis remains clinically challenging when confronting rapidly progressing disease. Patients with extreme manifestations, although rare and presented deviation from average, could provide important insights for biomarkers that are linked to certain phenotypes. This study acknowledged this diversity and enabled identification of patient subsets with EMI risk and potential early clinical intervention.
Conflict-of-interest disclosure: The authors declare no competing financial interests.
Acknowledgments
Some of the results presented in this manuscript are based on data generated by the Leucegene group, located at Institute for Research in Immunology and Cancer in Montreal, QC, Canada, and supported by Genome Canada and Génome Québec. Collection of these data were made possible through human acute myeloid leukemia specimens provided by the Quebec Leukemia Cell Bank, Montreal, QC, Canada.
This work was supported by the National Natural Science Foundation (82170179, 81970131, 81770146, 32171431, and 81800168), Foundation from Science and Technology Commission of Shanghai Municipality (22S11900400) (Y.L.), Applied Basic Research Programs of Dalian Innovation Project (2019J12SN56) (J.-S.Y.), and Key directive projects of Liaoning Province (2019JH8/10300027) (J.-S.Y.).
Authorship
Contribution: Y.L., J.-S.Y., and L.X. designed the research; L.-X.Y., M.-Y.Y., C.-T.Z., Y.J., L.X., H.-C.L., Z.-P.S., and Y.L. performed the experiments; J.-S.Y., Y.L., H.-C.L., A.-W.Z., J.M., Y.-C.Y., Z.-M.W., C.-T.Z., C.-H.L., X.-H.Z., L.X., R.-Q.W., and Z.-R.Y. contributed new reagents; J.-S.Y., H.-C.L., X.-H.Z., R.-Q.W., Z.-R.Y., Z.-Y.Y., and C-.T.Z. collected samples and managed participant information; J.-S.Y., H.-C.L., and C.-T.Z. provided patient care; Y.L., J.-S.Y., Z.-R.Y., L.X., A.-W.Z., J.M., L.Z., and X.-H.Z. analyzed data; and Y.L. wrote the manuscript.
Footnotes
∗L.-X.Y., C.-T.Z., M.-Y.Y., X.-H.Z., and L.X. contributed equally to this study.
The data supporting the findings of this study are available in the supplemental tables and figures.
The RNA sequencing data of gene expression profiles of patient samples and cultured cells reported in this article have been deposited in the Gene Expression Omnibus database (accession number GSE213584).
The mass spectrometry proteomics data reported in this article have been deposited in the ProteomeXchange Consortium via the iProX partner repository (data set identifier PXD035784).
Data are available on request from the corresponding authors, Ying Lu (stove@shsmu.edu.cn), Jin-Song Yan (yanjsdmu@dmu.edu.cn), and Li Xia (lixia@shsmu.edu.cn).
The online version of this article contains a data supplement.
There is a Blood Commentary on this article in this issue.
The publication costs of this article were defrayed in part by page charge payment. Therefore, and solely to indicate this fact, this article is hereby marked “advertisement” in accordance with 18 USC section 1734.
Contributor Information
Li Xia, Email: lixia@shsmu.edu.cn.
Jin-Song Yan, Email: yanjsdmu@dmu.edu.cn.
Ying Lu, Email: stove@shsmu.edu.cn.
Supplementary Material
References
- 1.Martin-Subero JI. Predicting leukemia relapse. Nat Med. 2018;24(4):385–387. doi: 10.1038/nm.4529. [DOI] [PubMed] [Google Scholar]
- 2.Welch JS, Petti AA, Miller CA, et al. TP53 and decitabine in acute myeloid leukemia and myelodysplastic syndromes. N Engl J Med. 2016;375(21):2023–2036. doi: 10.1056/NEJMoa1605949. [DOI] [PMC free article] [PubMed] [Google Scholar]
- 3.Marchesi V. Genetics: the AML mutational landscape. Nat Rev Clin Oncol. 2013;10(6):305. doi: 10.1038/nrclinonc.2013.81. [DOI] [PubMed] [Google Scholar]
- 4.Shahin OA, Ravandi F. Myeloid sarcoma. Curr Opin Hematol. 2020;27(2):88–94. doi: 10.1097/MOH.0000000000000571. [DOI] [PubMed] [Google Scholar]
- 5.Bakst RL, Tallman MS, Douer D, Yahalom J. How I treat extramedullary acute myeloid leukemia. Blood. 2011;118(14):3785–3793. doi: 10.1182/blood-2011-04-347229. [DOI] [PubMed] [Google Scholar]
- 6.Chang H, Brandwein J, Yi QL, Chun K, Patterson B, Brien B. Extramedullary infiltrates of AML are associated with CD56 expression, 11q23 abnormalities and inferior clinical outcome. Leuk Res. 2004;28(10):1007–1011. doi: 10.1016/j.leukres.2004.01.006. [DOI] [PubMed] [Google Scholar]
- 7.Wei Y, Lu W, Yu Y, et al. miR-29c&b2 encourage extramedullary infiltration resulting in the poor prognosis of acute myeloid leukemia. Oncogene. 2021;40(19):3434–3448. doi: 10.1038/s41388-021-01775-9. [DOI] [PubMed] [Google Scholar]
- 8.Byrd JC, Mrozek K, Dodge RK, et al. Pretreatment cytogenetic abnormalities are predictive of induction success, cumulative incidence of relapse, and overall survival in adult patients with de novo acute myeloid leukemia: results from Cancer and Leukemia Group B (CALGB 8461) Blood. 2002;100(13):4325–4336. doi: 10.1182/blood-2002-03-0772. [DOI] [PubMed] [Google Scholar]
- 9.Stolzel F, Luer T, Lock S, et al. The prevalence of extramedullary acute myeloid leukemia detected by (18)FDG-PET/CT: final results from the prospective PETAML trial. Haematologica. 2020;105(6):1552–1558. doi: 10.3324/haematol.2019.223032. [DOI] [PMC free article] [PubMed] [Google Scholar]
- 10.Eckardt JN, Stolzel F, Kunadt D, et al. Molecular profiling and clinical implications of patients with acute myeloid leukemia and extramedullary manifestations. J Hematol Oncol. 2022;15(1):60. doi: 10.1186/s13045-022-01267-7. [DOI] [PMC free article] [PubMed] [Google Scholar]
- 11.Cribe AS, Steenhof M, Marcher CW, Petersen H, Frederiksen H, Friis LS. Extramedullary disease in patients with acute myeloid leukemia assessed by 18F-FDG PET. Eur J Haematol. 2013;90(4):273–278. doi: 10.1111/ejh.12085. [DOI] [PubMed] [Google Scholar]
- 12.Ganzel C, Manola J, Douer D, et al. Extramedullary disease in adult acute myeloid leukemia is common but lacks independent significance: analysis of patients in ECOG-ACRIN Cancer Research Group trials, 1980-2008. J Clin Oncol. 2016;34(29):3544–3553. doi: 10.1200/JCO.2016.67.5892. [DOI] [PMC free article] [PubMed] [Google Scholar]
- 13.Byrd JC, Edenfield WJ, Shields DJ, Dawson NA. Extramedullary myeloid cell tumors in acute nonlymphocytic leukemia: a clinical review. J Clin Oncol. 1995;13(7):1800–1816. doi: 10.1200/JCO.1995.13.7.1800. [DOI] [PubMed] [Google Scholar]
- 14.Wang CX, Pusic I, Anadkat MJ. Association of leukemia cutis with survival in acute myeloid leukemia. JAMA Dermatol. 2019;155(7):826–832. doi: 10.1001/jamadermatol.2019.0052. [DOI] [PMC free article] [PubMed] [Google Scholar]
- 15.Solh M, Solomon S, Morris L, Holland K, Bashey A. Extramedullary acute myelogenous leukemia. Blood Rev. 2016;30(5):333–339. doi: 10.1016/j.blre.2016.04.001. [DOI] [PubMed] [Google Scholar]
- 16.Pirisi M, Krengli M, Valente G. Granulocytic sarcoma of the skin. Can Med Assoc J. 2008;179(7):727. doi: 10.1503/cmaj.080674. [DOI] [PMC free article] [PubMed] [Google Scholar]
- 17.Solh M, DeFor TE, Weisdorf DJ, Kaufman DS. Extramedullary relapse of acute myelogenous leukemia after allogeneic hematopoietic stem cell transplantation: better prognosis than systemic relapse. Biol Blood Marrow Transplant. 2012;18(1):106–112. doi: 10.1016/j.bbmt.2011.05.023. [DOI] [PubMed] [Google Scholar]
- 18.Bourlon C, Lipton JH, Deotare U, et al. Extramedullary disease at diagnosis of AML does not influence outcome of patients undergoing allogeneic hematopoietic cell transplant in CR1. Eur J Haematol. 2017;99(3):234–239. doi: 10.1111/ejh.12909. [DOI] [PubMed] [Google Scholar]
- 19.Agis H, Weltermann A, Fonatsch C, et al. A comparative study on demographic, hematological, and cytogenetic findings and prognosis in acute myeloid leukemia with and without leukemia cutis. Ann Hematol. 2002;81(2):90–95. doi: 10.1007/s00277-001-0412-9. [DOI] [PubMed] [Google Scholar]
- 20.Hu GH, Lu AD, Jia YP, Zuo YX, Wu J, Zhang LP. Prognostic impact of extramedullary infiltration in pediatric low-risk acute myeloid leukemia: a retrospective single-center study over 10 years. Clin Lymphoma Myeloma Leuk. 2020;20(11):e813–e820. doi: 10.1016/j.clml.2020.06.009. [DOI] [PubMed] [Google Scholar]
- 21.Kobayashi R, Tawa A, Hanada R, et al. Extramedullary infiltration at diagnosis and prognosis in children with acute myelogenous leukemia. Pediatr Blood Cancer. 2007;48(4):393–398. doi: 10.1002/pbc.20824. [DOI] [PubMed] [Google Scholar]
- 22.Di Bona E, Sartori R, Zambello R, Guercini N, Madeo D, Rodeghiero F. Prognostic significance of CD56 antigen expression in acute myeloid leukemia. Haematologica. 2002;87(3):250–256. [PubMed] [Google Scholar]
- 23.Cho-Vega JH, Medeiros LJ, Prieto VG, Vega F. Leukemia cutis. Am J Clin Pathol. 2008;129(1):130–142. doi: 10.1309/WYACYWF6NGM3WBRT. [DOI] [PubMed] [Google Scholar]
- 24.Garnache-Ottou F, Vidal C, Biichle S, et al. How should we diagnose and treat blastic plasmacytoid dendritic cell neoplasm patients? Blood Adv. 2019;3(24):4238–4251. doi: 10.1182/bloodadvances.2019000647. [DOI] [PMC free article] [PubMed] [Google Scholar]
- 25.van Galen P, Hovestadt V, Wadsworth Ii MH, et al. Single-cell RNA-seq reveals AML hierarchies relevant to disease progression and immunity. Cell. 2019;176(6):1265–1281.e24. doi: 10.1016/j.cell.2019.01.031. [DOI] [PMC free article] [PubMed] [Google Scholar]
- 26.Pellin D, Loperfido M, Baricordi C, et al. A comprehensive single cell transcriptional landscape of human hematopoietic progenitors. Nat Commun. 2019;10(1):2395. doi: 10.1038/s41467-019-10291-0. [DOI] [PMC free article] [PubMed] [Google Scholar]
- 27.Dong F, Hao S, Zhang S, et al. Differentiation of transplanted haematopoietic stem cells tracked by single-cell transcriptomic analysis. Nat Cell Biol. 2020;22(6):630–639. doi: 10.1038/s41556-020-0512-1. [DOI] [PubMed] [Google Scholar]
- 28.Bian Z, Gong Y, Huang T, et al. Deciphering human macrophage development at single-cell resolution. Nature. 2020;582(7813):571–576. doi: 10.1038/s41586-020-2316-7. [DOI] [PubMed] [Google Scholar]
- 29.Pombo Antunes AR, Scheyltjens I, Lodi F, et al. Single-cell profiling of myeloid cells in glioblastoma across species and disease stage reveals macrophage competition and specialization. Nat Neurosci. 2021;24(4):595–610. doi: 10.1038/s41593-020-00789-y. [DOI] [PubMed] [Google Scholar]
- 30.Cormican S, Griffin MD. Human monocyte subset distinctions and function: insights from gene expression analysis. Front Immunol. 2020;11:1070. doi: 10.3389/fimmu.2020.01070. [DOI] [PMC free article] [PubMed] [Google Scholar]
- 31.Obradovic A, Chowdhury N, Haake SM, et al. Single-cell protein activity analysis identifies recurrence-associated renal tumor macrophages. Cell. 2021;184(11):2988–3005.e16. doi: 10.1016/j.cell.2021.04.038. [DOI] [PMC free article] [PubMed] [Google Scholar]
- 32.Dong L, Chen C, Zhang Y, et al. The loss of RNA N6-adenosine methyltransferase Mettl14 in tumor-associated macrophages promotes CD8+ T cell dysfunction and tumor growth. Cancer Cell. 2021;39(7):945–957.e10. doi: 10.1016/j.ccell.2021.04.016. [DOI] [PubMed] [Google Scholar]
- 33.Zhang L, Li Z, Skrzypczynska KM, et al. Single-cell analyses inform mechanisms of myeloid-targeted therapies in colon cancer. Cell. 2020;181(2):442–459.e29. doi: 10.1016/j.cell.2020.03.048. [DOI] [PubMed] [Google Scholar]
- 34.Kelly LM, Englmeier U, Lafon I, Sieweke MH, Graf T. MafB is an inducer of monocytic differentiation. EMBO J. 2000;19(9):1987–1997. doi: 10.1093/emboj/19.9.1987. [DOI] [PMC free article] [PubMed] [Google Scholar]
- 35.Tran MTN, Hamada M, Jeon H, et al. MafB is a critical regulator of complement component C1q. Nat Commun. 2017;8(1):1700. doi: 10.1038/s41467-017-01711-0. [DOI] [PMC free article] [PubMed] [Google Scholar]
- 36.Tyner JW, Tognon CE, Bottomly D, et al. Functional genomic landscape of acute myeloid leukaemia. Nature. 2018;562(7728):526–531. doi: 10.1038/s41586-018-0623-z. [DOI] [PMC free article] [PubMed] [Google Scholar]
- 37.Xu J, Zhang W, Yan XJ, et al. DNMT3A mutation leads to leukemic extramedullary infiltration mediated by TWIST1. J Hematol Oncol. 2016;9(1):106. doi: 10.1186/s13045-016-0337-3. [DOI] [PMC free article] [PubMed] [Google Scholar]
- 38.Cancer Genome Atlas Research N. Ley TJ, Miller C, et al. Genomic and epigenomic landscapes of adult de novo acute myeloid leukemia. N Engl J Med. 2013;368(22):2059–2074. doi: 10.1056/NEJMoa1301689. [DOI] [PMC free article] [PubMed] [Google Scholar]
- 39.Dohner H, Estey E, Grimwade D, et al. Diagnosis and management of AML in adults: 2017 ELN recommendations from an international expert panel. Blood. 2017;129(4):424–447. doi: 10.1182/blood-2016-08-733196. [DOI] [PMC free article] [PubMed] [Google Scholar]
- 40.Ghebrehiwet B, Hosszu KK, Valentino A, Ji Y, Peerschke EI. Monocyte expressed macromolecular C1 and C1q receptors as molecular sensors of danger: implications in SLE. Front Immunol. 2014;5:278. doi: 10.3389/fimmu.2014.00278. [DOI] [PMC free article] [PubMed] [Google Scholar]
- 41.Vilgelm AE, Richmond A. Chemokines modulate immune surveillance in tumorigenesis, metastasis, and response to immunotherapy. Front Immunol. 2019;10:333. doi: 10.3389/fimmu.2019.00333. [DOI] [PMC free article] [PubMed] [Google Scholar]
- 42.Kalluri R. The biology and function of fibroblasts in cancer. Nat Rev Cancer. 2016;16(9):582–598. doi: 10.1038/nrc.2016.73. [DOI] [PubMed] [Google Scholar]
- 43.Kishore U, Thielens NM, Gaboriaud C. Editorial: state-of-the-art research on C1q and the classical complement pathway. Front Immunol. 2016;7:398. doi: 10.3389/fimmu.2016.00398. [DOI] [PMC free article] [PubMed] [Google Scholar]
- 44.Peerschke EI, Ghebrehiwet B. cC1qR/CR and gC1qR/p33: observations in cancer. Mol Immunol. 2014;61(2):100–109. doi: 10.1016/j.molimm.2014.06.011. [DOI] [PubMed] [Google Scholar]
- 45.Sanchez-Martin D, Cuesta AM, Fogal V, Ruoslahti E, Alvarez-Vallina L. The multicompartmental p32/gClqR as a new target for antibody-based tumor targeting strategies. J Biol Chem. 2011;286(7):5197–5203. doi: 10.1074/jbc.M110.161927. [DOI] [PMC free article] [PubMed] [Google Scholar]
- 46.Sole-Boldo L, Raddatz G, Schutz S, et al. Single-cell transcriptomes of the human skin reveal age-related loss of fibroblast priming. Commun Biol. 2020;3(1):188. doi: 10.1038/s42003-020-0922-4. [DOI] [PMC free article] [PubMed] [Google Scholar]
- 47.Deng CC, Hu YF, Zhu DH, et al. Single-cell RNA-seq reveals fibroblast heterogeneity and increased mesenchymal fibroblasts in human fibrotic skin diseases. Nat Commun. 2021;12(1):3709. doi: 10.1038/s41467-021-24110-y. [DOI] [PMC free article] [PubMed] [Google Scholar]
- 48.Xu Z, Chen D, Hu Y, et al. Anatomically distinct fibroblast subsets determine skin autoimmune patterns. Nature. 2022;601(7891):118–124. doi: 10.1038/s41586-021-04221-8. [DOI] [PubMed] [Google Scholar]
- 49.Nayak A, Ferluga J, Tsolaki AG, Kishore U. The non-classical functions of the classical complement pathway recognition subcomponent C1q. Immunol Lett. 2010;131(2):139–150. doi: 10.1016/j.imlet.2010.03.012. [DOI] [PubMed] [Google Scholar]
- 50.Weiss F, Lauffenburger D, Friedl P. Towards targeting of shared mechanisms of cancer metastasis and therapy resistance. Nat Rev Cancer. 2022;22(3):157–173. doi: 10.1038/s41568-021-00427-0. [DOI] [PMC free article] [PubMed] [Google Scholar]
- 51.Sun Y, Liu Y, Ma X, Hu H. The influence of cell cycle regulation on chemotherapy. Int J Mol Sci. 2021;22(13):6923. doi: 10.3390/ijms22136923. [DOI] [PMC free article] [PubMed] [Google Scholar]
- 52.Han X, Zhang WH, Wang WQ, Yu XJ, Liu L. Cancer-associated fibroblasts in therapeutic resistance of pancreatic cancer: Present situation, predicaments, and perspectives. Biochim Biophys Acta Rev Cancer. 2020;1874(2):188444. doi: 10.1016/j.bbcan.2020.188444. [DOI] [PubMed] [Google Scholar]
- 53.Paolillo R, Boulanger M, Gatel P, et al. The NADPH oxidase NOX2 is a marker of adverse prognosis involved in chemoresistance of acute myeloid leukemias. Haematologica. 2022;107(11):2562–2575. doi: 10.3324/haematol.2021.279889. [DOI] [PMC free article] [PubMed] [Google Scholar]
- 54.Yang L, Liu Y, Zhu L, Xiao M. DNMT3A R882 mutation is associated with elevated expression of MAFB and M4/M5 immunophenotype of acute myeloid leukemia blasts. Leuk Lymphoma. 2015;56(10):2914–2922. doi: 10.3109/10428194.2015.1015123. [DOI] [PubMed] [Google Scholar]
- 55.Zhu X, Du Y, Li D, et al. Aberrant TGF-beta1 signaling activation by MAF underlies pathological lens growth in high myopia. Nat Commun. 2021;12(1):2102. doi: 10.1038/s41467-021-22041-2. [DOI] [PMC free article] [PubMed] [Google Scholar]
- 56.Kim D, Kobayashi T, Voisin B, et al. Targeted therapy guided by single-cell transcriptomic analysis in drug-induced hypersensitivity syndrome: a case report. Nat Med. 2020;26(2):236–243. doi: 10.1038/s41591-019-0733-7. [DOI] [PMC free article] [PubMed] [Google Scholar]
- 57.Guo C, Li B, Ma H, et al. Single-cell analysis of two severe COVID-19 patients reveals a monocyte-associated and tocilizumab-responding cytokine storm. Nat Commun. 2020;11(1):3924. doi: 10.1038/s41467-020-17834-w. [DOI] [PMC free article] [PubMed] [Google Scholar]
- 58.Lee HW, Chung W, Lee HO, et al. Single-cell RNA sequencing reveals the tumor microenvironment and facilitates strategic choices to circumvent treatment failure in a chemorefractory bladder cancer patient. Genome Med. 2020;12(1):47. doi: 10.1186/s13073-020-00741-6. [DOI] [PMC free article] [PubMed] [Google Scholar]
- 59.Ghebrehiwet B, Habicht GS, Beck G. Interaction of C1q with its receptor on cultured cell lines induces an anti-proliferative response. Clin Immunol Immunopathol. 1990;54(1):148–160. doi: 10.1016/0090-1229(90)90014-h. [DOI] [PubMed] [Google Scholar]
- 60.Bulla R, Tripodo C, Rami D, et al. C1q acts in the tumour microenvironment as a cancer-promoting factor independently of complement activation. Nat Commun. 2016;7:10346. doi: 10.1038/ncomms10346. [DOI] [PMC free article] [PubMed] [Google Scholar]
- 61.Markiewski MM, DeAngelis RA, Benencia F, et al. Modulation of the antitumor immune response by complement. Nat Immunol. 2008;9(11):1225–1235. doi: 10.1038/ni.1655. [DOI] [PMC free article] [PubMed] [Google Scholar]
- 62.Kim DY, Martin CB, Lee SN, Martin BK. Expression of complement protein C5a in a murine mammary cancer model: tumor regression by interference with the cell cycle. Cancer Immunol Immunother. 2005;54(10):1026–1037. doi: 10.1007/s00262-005-0672-7. [DOI] [PMC free article] [PubMed] [Google Scholar]
- 63.Kishore U, Reid KB. C1q: structure, function, and receptors. Immunopharmacology. 2000;49(1-2):159–170. doi: 10.1016/s0162-3109(00)80301-x. [DOI] [PubMed] [Google Scholar]
- 64.Kim KB, Yi JS, Nguyen N, et al. Cell-surface receptor for complement component C1q (gC1qR) is a key regulator for lamellipodia formation and cancer metastasis. J Biol Chem. 2011;286(26):23093–23101. doi: 10.1074/jbc.M111.233304. [DOI] [PMC free article] [PubMed] [Google Scholar]
Associated Data
This section collects any data citations, data availability statements, or supplementary materials included in this article.


