

Abstract

In this study, an eco-friendly strategy was used to prepare a novel SrTiO3/Ag/rGO composite. A SrTiO3/Ag/rGO composite-modified screen-printed carbon electrode (SPCE) was applied for the electrochemical detection of 4-nitrophenol. A simple ultrasonic method with an ultrasonic frequency of 20 kHz was used for the synthesis of SrTiO3/Ag/rGO composite material. The obtained SrTiO3/Ag/rGO composite was characterized by X-ray diffraction, Fourier transform infrared, Raman spectroscopy, field emission electron microscopy, and UV–visible spectroscopy. Electrochemical impedance spectroscopy was used to determine the electrical conductivity of the SrTiO3/Ag/rGO composite. The electrochemical properties of the modified electrode were studied using cyclic voltammetry as well as linear sweep voltammetry techniques. In comparison to SrTiO3/SPCE, SrTiO3/Ag/SPCE, and SrTiO3/rGO/SPCE electrodes, SrTiO3/Ag/rGO/SPCE demonstrates a considerable increase in 4-nitrophenol redox peak current. At optimum conditions, a large linear response range of 0.1–1000 M, with a relatively low limit of detection (0.03 M), outperforms the previously published modified electrode for 4-nitrophenol. Moreover, the SrTiO3/Ag/rGO/SPCE electrode-based 4-nitrophenol sensor is distinguished by good selectivity, high stability, and repeatability. Furthermore, SrTiO3/Ag/rGO/SPCE contributed to the detection of 4-nitrophenol in river water and drinking water with the recovery range from 97.5 to 98.7%. The experimental finding was supported by density functional theory calculation.
1. Introduction
Over the few decades, due to growing industrialization, organic compounds such as aromatic compounds are among the most and largest important groups of pharmaceutical and industrial chemicals to create various pollutions.1−3 The EPA (United States Environmental Protection Agency) has listed aromatic nitro compounds as potential environmental pollutants because of their toxic effects on aquatic life, plants, and animals in addition to humans because these compounds are highly soluble in the aquatic environment and have a low rate of degradation.4,5 The 4-nitrophenol molecule is one of the aromatic nitro compounds found in the water of various environments, which is regarded as a dangerous chemical pollutant and is a common precursor used in dye, pesticide, pharmaceutical, and leather industries.6−8 In particular, 4-nitrophenol causes inflammation and irritation in the eyes damages the liver.9−12 Therefore, it is important for the detection and removal of 4-nitrophenol from agriculture and wastewater or at least convert it to a less-toxic substance that is vital. The results of earlier studies show that a variety of methods have been employed to detect 4-nitrophenol in environmental samples, including UV–vis spectrophotometry, capillary electrophoresis, gas chromatography, high-performance liquid chromatography, and fluorescence.4,6,13 However, all of these detection performances are quite expensive and time-consuming, which caused difficulties in monitoring 4-nitrophenol in agriculture and wastewater. Electrochemical methods are useful for analyte monitoring because they are affordable and have rapid response time, have excellent selectivity and sensitivity, and are viable for real-time sample analysis.
Perovskite materials are generally studied for their application in energy storage, sensors, catalysts, etc., because of their several physical properties.14 Among the perovskites, strontium titanate (SrTiO3) has good optical and electronic properties, thermal stability, superior reliability, and nontoxicity.15,16 Composites based on SrTiO3 are gaining popularity in a variety of applications, including energy storage as well as conversion devices, sensors, optical fibers, and photocatalysts.17 However, with the large bandgap of 3.2 eV, SrTiO3 cannot contribute full applications in sensor, electronic, and energy storage devices. Therefore, internal modification of SrTiO3 is necessary for the fatal defect; until now, various strategies have been employed such as coupling with other semiconductors, doping, and organic species sensitization.18,19 On the other hand, graphite, amorphous carbon, graphene oxide, and fullerene have been employed extensively in sensing, catalysis, and energy storage application.20,21 Among these, reduced graphene oxide (rGO) is a carbon allotrope, has been hailed as a viable candidate for usage in electrochemical sensors due to its large surface area, and ability to act as an electron receptor.22,23 For the preparation of SrTiO3, numerous approaches are well documented, namely, sol–gel, high-temperature solid-state, coprecipitation, hydrothermal, ultrasonication, etc.24−26 For the ultrasonication method, the primary physical phenomena associated with sonochemistry in acoustic cavitation are in the liquid phase (i.e., the formation growth and subsequent implosive collapse of bubbles) and nebulization. This route promotes and improves solute diffusion, therefore, triggers the product to provide narrow size distribution and fast reaction rate, as well as enhances the crystallization process without using the high-temperature crystallization process; furthermore, it can be easily scalable to industrial needs.27,28
In this study, a SrTiO3/Ag/rGO composite-modified electrode was developed for the effective detection of 4-nitrophenol in actual samples. SrTiO3/Ag/rGO/SPCE-modified electrode electrochemical studies were performed by CV (cyclic voltammetry) and LSV (linear sweep voltammetry). Electrochemical studies revealed that SrTiO3/Ag/rGO/SPCE exhibits excellent analytical performance toward the 4-nitrophenol sensor. The novelty is as follows: (i) this is the first report to develop on the ultrasonic synthesis of the SrTiO3/Ag/rGO composite, (ii) SrTiO3/Ag/rGO/SPCE-modified electrode first time developed for electrochemical detection of 4-nitrophenol, and (iii) furthermore, first-time report of density functional theory (DFT) analysis to the SrTiO3/Ag/rGO composite.
2. Experimental Section
2.1. Reagent and Materials
Strontium hydroxide octahydrate (Sr(OH)2·8H2O) (95%), titanium(IV) butoxide (Ti (OCH2CH2CH2CH3)4) (97%), silver nitrate (AgNO3) (99%), rGO, absolute ethanol (C2H6O) (99.8%), potassium ferricyanide (K3Fe(CN)6) (99%), potassium hexacyanoferrate trihydrate (K3Fe(CN)6·3H2O) (98.5%), potassium chloride (KCl) (99%), sodium phosphate dibasic (Na2HPO4) (99%), sodium phosphate monobasic (H2NaO4P) (99%), 4-nitrophenol (C6H5NO3) (99%), 2-nitroaniline (C6H5N2O2) (98%), magnesium hydroxide (Mg(OH)2) (95%), calcium hydroxide (Ca(OH)2) (95%), and copper hydroxide (Cu(OH)2)(95%) are obtained from Sigma-Aldrich and used as received.
2.2. Instrumentation
The morphological and elemental composition of materials was obtained by field emission electron microscopy (FE-SEM) (HITACHI S-3000N, Japan, at an accelerating voltage 0.3–30 kV) with an energy-dispersive spectrometer. X-ray diffraction (Shimadzu XRD 6000, Japan using Cu Kα radiation 1.54 Å) analysis is used to determine the formation, crystalline size, and crystalline phase of synthesized materials. The functional group analysis of the samples was measured with PerkinElmer Fourier transform infrared (FT-IR) spectroscopy (JASCO FT/IR-6600 spectrometer). Raman spectra were recorded using a Micro-Raman spectroscope (RENISHAW in via system, U.K) using a 514 nm excitation light source. Electrochemical characterization was conducted by CV, LSV using a conventional three-electrode system, and a CHI6116E electrochemical workstation was employed for all electrochemical measurements. Silver/silver chloride (Ag/AgCl) served as the reference electrode, a platinum wire served as the counter electrode, and the screen-printed carbon electrode (SPCE) as it had been created served as the working electrode.
2.3. Preparation of SrTiO3/Ag/rGO Composite
In a typical synthesis process, 2.6 g of Sr(OH)2 was first dispersed in 50 mL of ethanol while kept in a sonic bath for 15 min. Additionally, 3.4 g of Ti(C4H9O)4 was added dropwise into the above solution during the sonication. Finally, 20 mL of DI water was introduced to the above solution; along with it, a white suspension was achieved. Second, 2 g of rGO was added into the above solution under sonication for a further 15 min. Third, 2.6 g of AgNO3 powder was added to the solution for the final homogeneous suspension. After that, the precursor solution was treated with ultrasonic irradiation technique (operating frequency 20 kHz, 500 W, Sonics-VCX 500, Taiwan, per cycle 20 s) for 1 h. The final SrTiO3/Ag/rGO composite was obtained by washing with distilled water and deionized water and finally dried under vacuum at 100 °C for 12 h. The fabrication process for the SrTiO3/Ag/rGO composite is outlined in Scheme 1. For the synthesis of pure SrTiO3, SrTiO3/Ag, and SrTiO3/rGO, the same procedure is followed without rGO/Ag, rGO, and Ag, respectively.
Scheme 1. Schematic Diagram of Preparation of SrTiO3/Ag/rGO Composite.

2.4. Fabrication of Electrode
To prepare the modified electrode, SrTiO3/Ag/rGO/SPCE, the drop-drying method was used. One mg of SrTiO3/Ag/rGO was dispersed in 10 mL of DI water, followed by drop-casting 5 μL on SPCE and drying it in an oven at 50 °C for 15 min. SrTiO3/SPCE, SrTiO3/Ag/SPCE, and SrTiO3/rGO/SPCE were prepared in the same way.
2.5. DFT Studies
Quantum chemistry calculations have been performed using Gaussian 09 W software and DFT (B3LYP) methods utilizing the LANL2DZ/6-311++G (d, p) foundation set.29 Since no fictional frequency mode could be generated at the ideal form for the aforementioned molecule, a true minimum on the possible energy surface was found. The scaling factors have been included into the estimated experimental data using least-squares optimization in order to match theoretical wavenumbers with the experimental results. In order to get visual animation and to confirm the assignment of the normal modes, the Gauss view Program30,31 has been taken into consideration.
3. Results and Discussion
3.1. Morphological and Structural Examination of Synthetic Materials
FE-SEM characterization was performed to study the morphological analysis of the SrTiO3, SrTiO3/Ag, SrTiO3/rGO, and SrTiO3/Ag/rGO composite materials. Pure SrTiO3 had irregular spherical shapes and had considerable agglomeration, as can be seen in Figure 1a. The FE-SEM images of SrTiO3/Ag are shown in Figure 1b, which shows less agglomeration than pure SrTiO3. Figure 1c shows the crumbled layered structure of rGO along with the high density of spherical SrTiO3 that were unevenly deposited on rGO. Notably, from the FE-SEM images of the SrTiO3/Ag/rGO composite (Figure 1d), most of the stratiform rGO covered with numerous SrTiO3/Ag can be observed because SrTiO3/Ag particles are densely populated in the composite. The presence of a clear sphere-like structure can be evidenced by the successful synthesis of SrTiO3/Ag/rGO composite by the ultrasonic method. As a result, the morphology of SrTiO3 is changed by adding Ag and rGO. Figure S1 indicates the EDS analysis and percentage of elements of pure SrTiO3, SrTiO3/Ag, SrTiO3/rGO, and SrTiO3/Ag/rGO composite. The elementary composition of all samples is pure because no other signals were obtained in the EDS analysis. A typical TEM image of SrTiO3/Ag/rGO composites at two different magnifications are shown in Figure 2. As can be seen in Figure 2, the Ag and SrTiO3 spherical particles are spread over the rGO sheet.
Figure 1.

FE-SEM images and histogram of (a) SrTiO3, (b) SrTiO3/Ag, (c) SrTiO3/rGO, and (d) SrTiO3/Ag/rGO composites.
Figure 2.

TEM images of (a,b) SrTiO3/Ag/rGO composite.
Figure 3 displays the powder XRD patterns of the SrTiO3, SrTiO3/Ag, SrTiO3/rGO, and SrTiO3/Ag/rGO composites. According to the XRD findings, the distinctive peaks appeared at the plane (100), (110), (111), (211)s and (310) correspond to 2θ values 19.70, 32.30, 39.90, 58.10, and 72.10, respectively, which indicate the cubic phase of pristine SrTiO3.17 The XRD pattern showed that the whole SrTiO3/Ag, SrTiO3/rGO, and SrTiO3/Ag/rGO composites correspond exactly to the diffraction peak values of pure SrTiO3. Additionally, the characteristic peaks of Ag and rGO were not observed in the SrTiO3/Ag and SrTiO3/rGO composites, respectively, due to not influencing the crystal structure of pure SrTiO3 and low concentration of Ag and rGO beyond the detection limit by the diffractometer. Furthermore, the intensity peak of (110) for the SrTiO3/Ag/rGO composite was suppressed compared to pure SrTiO3, SrTiO3/Ag, and SrTiO3/rGO composites, which represents the high crystallinity of the SrTiO3/Ag/rGO composite than other samples. The average particle size of ultrasonic-assisted synthesis of SrTiO3/Ag/rGO composite for the (110) plane is found to be 14.3 nm, which was calculated using the Scherrer equation.32
Figure 3.
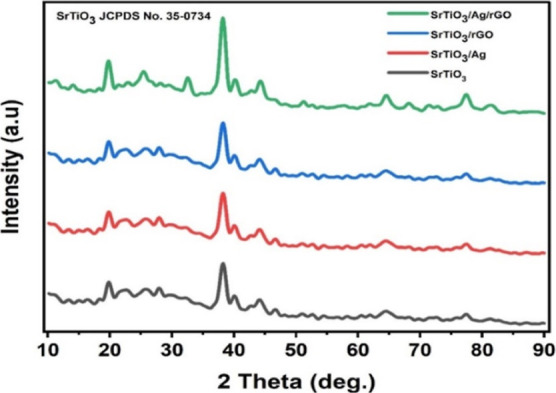
XRD pattern of SrTiO3, SrTiO3/Ag, SrTiO3/rGOs and SrTiO3/Ag/rGO composites.
3.2. FT-IR Analysis
In Figure 4a, the FT-IR spectra of pure SrTiO3, SrTiO3/Ag, SrTiO3/rGO, and SrTiO3/Ag/rGO composites are displayed. For SrTiO3, an absorption peak appeared at 563 and 853 cm–1, which corresponded to the Ti–O–Ti stretching vibration of the Sr–O bond. The C–H bending vibration is thought to be the cause of the absorption peak at 1471 cm–1.33,34 The two bands that appeared at 1645 and 3437 cm–1 was due to C=C stretching vibration and bending vibration of the O–H bond, respectively, which confirms that some water molecule is present in the product.35,36 563 cm–1 peaks appeared in SrTiO3/Ag, SrTiO3/rGO, and SrTiO3/Ag/rGO composites, confirming that SrTiO3 is present in all composites. A close look at the pure SrTiO3 and SrTiO3/Ag FT-IR peak intensity reduced to Ag-loaded SrTiO3, which might be a chemical interaction between Ag and SrTiO3. In the FT-IR spectrum of SrTiO3/rGO and SrTiO3/Ag/rGO composites compared to pure SrTiO3, the Ti–O–Ti stretching vibration intensity appeared weaker, which is represented by the incorporation of C atom to form rGO into SrTiO3 and create the Ti–C bond.37 Additionally, that 1645 cm–1 peak somewhat migrated to the 1550 cm–1 wavelength, showing that the rGO sheets’ skeletal structure had been affected. The 1381 cm–1 peak that was seen is attributed to the rGO’s C–O stretching vibration.38 Finally, the FT-IR spectra confirm the formation of SrTiO3/Ag/rGO composite successfully, with the chemical bond of SrTiO3/Ag on rGO.
Figure 4.

(a) FT-IR spectra and (b) Raman spectra of SrTiO3, SrTiO3/Ag, SrTiO3/rGO, and SrTiO3/Ag/rGO composites.
3.3. Raman Spectra Results
Figure 4b shows the Raman spectra of pure SrTiO3, SrTiO3/Ag, SrTiO3/rGO, and SrTiO3/Ag/rGO composites. The band occurred in two main areas about 250–500 and 600–850 cm–1, which are connected to the first- and second-order Raman scattering demonstrating the production of SrTiO3, respectively. Peaks around 151, 431, 873, and 1060 cm–1 are categorized as TO3, LO3, LO4, and A2g degrees of order–disorder, respectively.39−41 Furthermore, the peaks appeared at 151 cm–1 as well as 431 cm–1 are ascribed to first-order modes, whereas the peaks at 873 and 1060 cm–1 have been attributed to second-order modes. For the SrTiO3/rGO and SrTiO3/Ag/rGO composites, two additional peaks appeared at 1359 and 1556 cm–1 corresponding to the D band and G band arising due to in-plane sp3 defects and sp2 domine in carbon, respectively.42,43 The 431 and 873 cm–1 peaks slightly changed to 375 and 759 cm–1, respectively, which could be attributed to the interaction between rGO and SrTiO3. The coexistence of main Raman peaks of both SrTiO3 and rGO, as found in SrTiO3/rGO and SrTiO3/Ag/rGO composites, further confirms the composite formation.
3.4. UV–Visible DRS Spectra
Figures S2 and 5 show the UV–visible DRS results of the pure SrTiO3, SrTiO3/Ag, SrTiO3/rGO, and SrTiO3/Ag/rGO composites. According to T–M theory (Tauc–Mott), we have calculated the bandgap (Eg) of pure SrTiO3, SrTiO3/Ag, SrTiO3/rGO, and SrTiO3/Ag/rGO composites as 2.33 2.19, 2.13, and 2.03 eV, respectively. The calculated bandgap of pure SrTiO3 is well correlated with the literature. The bandgap for pure SrTiO3 and SrTiO3/Ag/rGO composites showed a slight change from 2.33 to 2.03 eV in the UV–visible DRS spectra; the following consequence is accounted for the variation in the bandgap: (i) when adding Ag, rGO in SrTiO3 which creates defects and stress within SrTiO3 and further changed the Fermi level, further boosts e/h pair, (ii) the inclusion of Ag particles and rGO produces charge-transfer complexes in the SrTiO3 matrix, which cause the reduction of bandgap, and (iii) due to changes in morphology.37,44
Figure 5.

UV–visible DRS spectra of the SrTiO3/Ag/rGO composite.
3.5. Electrochemical Studies
Generally, EIS (electrochemical impedance spectroscopy) analysis was used to measure the conductivity as well as the interfacial electrochemical characteristics of the electrode materials. EIS was performed at a 100 mV ac potential and 5.5 kHz frequency. Figure 6a demonstrates the Nyquist plot of bare SPCE, SrTiO3/SPCE, SrTiO3/Ag/SPCE, SrTiO3/rGO/SPCE, and SrTiO3/Ag/rGO/SPCE in the presence of 5 mM Fe(CN)63–/4 and 0.1 M KCl with 100 μM concentration of 4-nitrophenol. As demonstrated in Figure 6a, the Nyquist plot of the bare SPCE revealed a semicircle with a larger diameter than the other modified electrode, indicating a high charge-transfer resistance (Rct). However, the Rct values of SrTiO3/SPCE, SrTiO3/Ag/SPCE, SrTiO3/rGO/SPCE, and SrTiO3/Ag/rGO/SPCE significantly decrease, respectively, suggesting the redox reaction taking place successfully at the electrode surface. The fact that SrTiO3/Ag/rGO/SPCE exhibits the shortest semicircle when compared to other modified electrodes suggests that the integration of rGO and Ag can alter the electrical properties of a SrTiO3. The smaller Rct values were observed for the SrTiO3/Ag/rGO composite because of the diffusion control reaction occurred at the electrode–electrolyte interface, transfer efficiency, electronic conductivity, and large surface area.44−47 Therefore, the SrTiO3/Ag/rGO composite provides excellent electrochemical activity compared to other samples.
Figure 6.

(a) EIS plot of bare SPCE, SrTiO3/SPCE, SrTiO3/Ag/SPCE, SrTiO3/rGO/SPCE, and SrTiO3/Ag/rGO/SPCE in a 0.1 M KCl solution containing 5 mM of Fe(CN)63–/4– with 100 μM concentration of 4-nitrophenol; (b) CV plot for the bare SPCE, SrTiO3/SPCE, SrTiO3/Ag/SPCE, SrTiO3/rGO/SPCE, and SrTiO3/Ag/rGO/SPCE in the presence of PBS (pH 7.0) and a scan rate of 50 mV s–1 with 100 μM concentration of 4-nitrophenol; and (c) CV response of 2, 4, 5, 6, and 8 μL concentration of SrTiO3/Ag/rGO SPCE with 100 μM concentration of 4-nitrophenol.
Cyclic voltammetry (CV) analysis was performed in the presence of PBS (pH 7.0) using a scan rate of 50 mV s–1 with a concentration of 4-nitrophenol of 100 M. The electrochemical characteristics of SrTiO3/SPCE, SrTiO3/Ag/SPCE, SrTiO3/rGO/SPCE, and SrTiO3/rGO/SPCE as well as bare SPCE have been examined using CV analysis. Figure 6b exhibits the CV reduction peak current signals of 4-nitrophenol at bare SPCE, SrTiO3/SPCE, SrTiO3/Ag/SPCE, SrTiO3/rGO/SPCE, as well as SrTiO3/Ag/rGO/SPCE; results could be observed that SrTiO3/Ag/rGO/SPCE exhibit the cathodic peak current signals that illustrate the synergistic effect for 4-nitrophenol detection. The bare SPCE surface’s poor adsorption capabilities and the CV analysis for the bare SPCE revealed the lowest reduction peak for the 4-nitrophenol reduction. For the other modified electrode, a reduction peak is observed between −0.8 and −1.2 V, and no oxidation peak is observed in the reverse scan, representing that 4-nitrophenol undergoes an irreversible reduction process on the modified electrode. Fascinatingly, SrTiO3/SPCE has shown a reduction peak current of −21.3 μA, SrTiO3/Ag/SPCE has shown a reduction peak current of −50.8 μA, SrTiO3/rGO/SPCE has shown a reduction peak current of −54.4 μA, and SrTiO3/Ag/rGO/SPCE shows a high peak current of −66.5 μA in the presence or absence of 100 μM 4-nitrophenol with a slight potential shift. The increased current response owing to excellent electronic characteristics, high active surface area, good conductivity ability, and π interaction between rGO and SrTiO3 in SrTiO3/Ag/rGO/SPCE among other modified electrodes was used for further investigation. The CVs of various concentrations (2, 4, 5, 6, and 8 μL) of the SrTiO3/Ag/rGO composite solution are shown in Figure 6c. The reduction peak current response rises synchronously as the concentration of SrTiO3/Ag/rGO/SPCE increases. However, 6–8 μL concentration of the composite’s current response is shown to somewhat drop, which may be due to the thick layer of SrTiO3/Ag/rGO with a greater volume produced on the SPCE, which may have prevented the diffusion of 4-nitrophenol, which might be the cause of the drop of current. Therefore, a 5 μL concentration of SrTiO3/Ag/rGO was chosen for the following studies.
3.5.1. Effect of Scan Rate and Electrolyte pH on 4-Nitrophenol Reduction
For practical application, some criteria including concentration, the impact of pH, scan rate, and the presence of interfering chemicals are influencing the electrochemical analysis. By measuring CV at various scan rates (10–200 mV s–1) while using a 100 M concentration of 4-nitrophenol in PBS (pH 7.0), it is possible to determine the effect of scan rate upon the electrochemical determination of 4-nitrophenol, as shown in Figure 7a. Scan rate test was conducted to determine whether the electrode’s reactivity was regulated by diffusion or was surface-controlled. In this work, the cathodic peak current for 4-nitrophenol detection gradually increases with an increase in scan rate from 10 to 200 mV s–1 along with a slight change in the maximum potential toward the positive direction, which describes the involvement of protons while the reaction as well as the irreversible behavior occurs at the electrode, respectively. The linearity plot based on various scan rates is shown in Figure 7b using the regression equation with a correlation coefficient of y = −0.2468x – 42.882 and R2 = 0.9932. The adsorption process used in the electrochemical reduction process by the SrTiO3/Ag/rGO/SPCE-modified electrode was shown by the aforementioned results.
Figure 7.

(a) CV response upon a various scan rate (10–200 mV s–1) at SrTiO3/Ag/rGO/SPCE, (b) linear plot of the current vs scan rate, (c) LSV obtained for SrTiO3/Ag/rGO/SPCE having a concentration of 4-nitrophenol from 0.1 to 1 μM, (d) LSV obtained for SrTiO3/Ag/rGO/SPCE having a concentration of 4-nitrophenol from 100 to 1000 μM, and (e) plot of stability for repeated cycling of SrTiO3/Ag/rGO/SPCE against the cyclic number (1–50 cycles).
The CV measurements taken using the pH range between 3.0 and 11.0 are shown in Figure S3a, and each pH value, potential, and its related histogram are displayed in Figure S3b, and were carried out to achieve the highest possible efficiency of the electrochemical sensor used for detection of 4-nitrophenol. When it comes to 4-nitrophenol, the reduction peak current progressively increases from pH 3.0 to pH 7.0; however, the peak current abruptly reduced after pH 7. From the results, pH 7.0 was considered the optimal pH for all electrochemical analyses for this work. The decrease of reduction peak current could be explained based on the reduction mechanism, which involves proton transfer,48,49 as described in Scheme 2. During the electrochemical detection of 4-nitrophenol, reduction occurs in 4-nitrophenol to p-(hydroxyamino)-phenol when direct reduction occurs when the four-electron and four-proton transfer process is involved due to the H+ ion concentration which participates in the electrochemical reduction mechanism,50 while increasing pH > 7, the shift of the cathodic peak potential is negative and decreases peak current because of increasing OH– ion concentration; as a result, electrochemical regulation occurs between 4-nitrophenol and SrTiO3/Ag/rGO/SPCE.
Scheme 2. 4-Nitrophenol Electrochemical Reduction Method on SrTiO3/Ag/rGO/SPCE.

3.5.2. Electrochemical Sensing Behavior of 4-Nitrophenol on the Modified Electrode
In order to explore the analytical performance of the SrTiO3/Ag/rGO/SPCE electrode, an LSV analysis of 4-nitrophenol under optimized conditions was carried out. LSV is a technique that can play an important role in electrochemical sensors to determine the varied concentration of toxic analytes with high sensitivity. Figure 7c,d show that the LSV cathodic peak current increased without significant change of peak potential shift with increasing 4-nitrophenol two different concentrations from 0.1 to 1 and 100 to 1000 μM. Figure S4a,b represents the corresponding calibration plot and provides the correlation equation of R2 = 0.9927. The limit of detection (LOD) has been calculated using the following equation: LOD = 3Sb/S, where Sb is the standard deviation of the first five blank values and S is the slope value. From these data, the LOD of the modified electrode was determined to be 0.03 μM. Furthermore, in Table 1, a comparison of the 4-nitrophenol detection limit, LOD, and linear range values is shown compared with the previous and current studies. From Table 1, it is concluded that the developed sensor based on SrTiO3/Ag/rGO/SPCE holds a remarkably low detection limit and excellent sensitivity toward the detection of 4-nitrophenol.
Table 1. Comparison of Some Characteristics of Different Electrochemical Sensors for the Detection of 4-Nitrophenol.
| type of materials | LOD (nM) | linear range (μM) | method | reference |
|---|---|---|---|---|
| rGO-HNT-AgNPs | 0.0486 | 0.1–363.9 | DPV | (51) |
| FeOx/TiO2@mC | 0.183 | 5–310 | DPV | (52) |
| rGO | 42 | 50–800 | CV | (53) |
| ZnFe2O4/g-C3N4/GCE | 0.00417 | 0.015–724.17 | amperometry | (54) |
| γ-Fe2O3–N-rGO | 0.1 | 0.1–100 | DPV | (55) |
| multiwall carbon nanotubes–nafion/GCE | 0.04 | 0.1–10 | DPV | (56) |
| Co3O4@BVFC | 0.005 | 0.1–140 | DPV | (2) |
| rGO–HNT–AgNP/SPCE | 0.0486 | 0.1–363.9 | DPV | (6) |
| MgFe2O4/GCE | 0.03 | 3–302 | DPV | (8) |
| BSO-gCN/GCE | 1 | 1.6–50 | LSV | (57) |
| SrTiO3/Ag/rGO/SPCE | 0.03 | 0.1–1000 | LSV | present work |
3.5.3. Repeatability, Long-Term Stability, and Test Stability
The SrTiO3/Ag/rGO/SPCE electrode’s repeatability, reproducibility, and stability were assessed using LSV in the presence of a 100 M 4-nitrophenol-containing PBS (pH 7.0) buffer. The repeatability of the SrTiO3/Ag/rGO/SPCE electrode was performed 50 replicate measurements, and the RSD (relative standard deviation) was obtained with a very low value of 1.4%, indicating good repeatability (Figure 7e). The SrTiO3/Ag/rGO/SPCE-modified electrode was kept in PBS at room temperature during the stability measurements. The stability was examined by examining its current response after 2 weeks, and the calculated RSD value of 3.1% thus exhibited good long-term stability (Figure S4c). Furthermore, to assess the repeatability for the SrTiO3/Ag/rGO/SPCE-modified electrodes, five separate SrTiO3/Ag/rGO/SPCE-altered electrodes were employed to electrochemically detect 4-nitrophenol, yielding an RSD of 4.3% (Figure S4d). Thus, the results proved that the electrode offers excellent reproducibility. Based on these results, the SrTiO3/Ag/rGO/SPCE-modified electrode has excellent repeatability, stability, and reproducibility, and hence, it can be preferably applied for the sensing of 4-nitrophenol real-time electroanalytical application.
3.5.4. Selectivity Studies
Due to the potential impact of some interfering compounds present in actual samples, selectivity is regarded as a significant criterion in selecting a modified sensor with practical use. The selectivity experiments were conducted with 2-nitroaniline, dimethylaniline, Mg2+, Cu2+, and Ca2+ substances along with 100 μM 4-nitrophenol, which were investigated by LSV measurement. The results showed that several inorganic ions, such as 100-fold concentrations of Mg2+, Cu2+, and Ca2+, did not significantly affect the detection of 100 M 4-nitrophenol and that a 50-fold concentration of an aromatic molecule had no impact on the detected signals of 4-nitrophenol. In the interference experiment, a SrTiO3/Ag/rGO/SPCE-modified electrode was noticed, and the interferents had no obvious influences for the determination of 4-nitrophenol. It can be seen in the bar diagram in Figure S5 that the peak current responses display selectivity in the interference study. Figure S5 clearly shows that the SrTiO3/Ag/rGO/SPCE-modified electrode has an outstanding anti-interference ability.
3.5.5. Real Sample Analysis
Practical applications of the SrTiO3/Ag/rGO/SPCE-modified electrode were explored in the drinking water and river water samples by the standard addition method using LSV. Tap water was directly applied without any pretreatment, while the river water was filtered using filters before use, and their pH values were adjusted to pH 7.0. The recovery test was carried out by LSV response using real samples spiked with 0, 5, and 10 μM 4-nitrophenol, and the results were recorded three times for each spiked concentration under the same condition to confirm the practicability. As shown in Table 2, the obtained recovery results were between 97.5 and 98.7%, and this result exhibits that this electrochemical sensor is a reliable method to determine 4-nitrophenol in real samples.
Table 2. 4-Nitrophenol Determination in Real Samples Using a Modified SrTiO3/Ag/rGO/SPCE Electrode.
| sample | spiked (μM) | found (μM) | recovery range (%) | RSD (%) n = 3 |
|---|---|---|---|---|
| tap water | 0 | 0 | ||
| 100 | 96.4 (±0.5) | 97.5 | 3.25 | |
| 150 | 148.8 (±1.2) | 99.2 | 3.21 | |
| river water | 0 | 0 | ||
| 100 | 98.7 (±0.9) | 98.7 | 3.27 | |
| 150 | 147.4 (±1.5) | 98.3 | 3.21 |
3.6. DFT Studies
DFT was used to investigate the Ag incorporation effect in SrTiO3 in SrTiO3/Ag and its characteristics. The Ag basis set’s coefficients were tuned for precision. Since Ag enhances SrTiO3’s optical absorption qualities and therefore creates new technological opportunities, it is an excellent metal for doping in SrTiO3. These groundbreaking results imply that rGO has the ability to function as the ligand for reactive metal–oxygen (SrTiO3/Ag) radicals with new shapes and ionic states (Figures 8 and S6).
Figure 8.

Optimized 3D structure of the SrTiO3/Ag/rGO composite.
3.6.1. Frontier Molecular Orbitals
Frontier molecular orbitals (FMOs) are defined as the highest- and lowest-lying occupied and empty molecular orbitals, respectively (FMO). The electric and optical characteristics, as well as quantum chemistry, are all significantly influenced by the FMOs. The optical polarizability, chemical reactivity, kinetic stability, and chemical hardness–softness of a molecule are all governed by the energy difference between HOMO and LUMO. The rigid molecules are no more polarizable compared to soft ones since they need an abundance of energy in order to excite them. To evaluate the energy behavior exhibited by the SrTiO3/Ag composite (with rGO as a ligand), we ran calculations in the gas phase. The energies of the lowest while the second-lowest unoccupied molecular orbitals (LUMO and LUMO + 1), the second-highest along with the highest occupied molecular orbitals (HOMO and HOMO – 1), and the lowest as well as the second-lowest unoccupied molecular orbitals (HOMO and HOMO – 1) were calculated using B3LYP/LANL2DZ/6-311++G (d, p). The HOMO – 1, HOMO, LUMO, and LUMO + 1 orbitals of the SrTiO3/Ag/rGO composite molecules (in the gas phase) estimated for the B3LYP/LANL2DZ/6-311++G (d, p) levels are plotted in three dimensions in Figure 9.
Figure 9.

HOMO 1, HOMO, LUMO, and LUMO + 1 of SrTiO3/Ag have specific atomic orbitals and energies.
The figure clearly shows that the LUMO is notably concentrated on the ring, in contrast to the HOMO, which is essentially distributed across the entire molecule. Antibonding types make up the majority of the possible orbitals from the HOMO and LUMO families. The HOMO’s computed energy levels in the gas phase are −9.39033 eV. The LUMO energy values are −6.9444 eV, too. The molecule’s chemical stability is shown by the energy difference between HOMO and LUMO. The energy difference between the HOMO and LUMO in this molecule is 2.446 eV in the gas phase (similar to the obtained bandgap in the solid phase), respectively. The Koopmans’ theorem and the total energies are used to calculate the molecule’s electronic properties. The energy difference between the compound’s (radical cation’s) energy and that of the corresponding neutral compound yields the ionization potential.
The nature of reactivity of the molecule and certain chemical reactivity describe the hardness (η), chemical potential (μ), softness(s), electrophilicity index (ω), and electronegativity (χ) defined by HOMO and LUMO energy values for a molecule. By applying Koopmann’s theorem to the equations for closed-shell molecules (eqs 1–5), we may get HOMO and LUMO.
| 1 |
| 2 |
| 3 |
| 4 |
| 5 |
The gas-phase values for the title molecule’s electronegative, chemical hardness, softness, and electrophilicity index are 8.1674, 1.2229, 0.8178, and 0.9145 eV, respectively. A further significant electrical characteristic of a molecule is its dipole moment. For instance, the intermolecular interactions will be greater with larger dipole moment. Table 3 also includes the computed dipole moment values for the compounds. These charge distributions are in accordance and confirm that SrTiO3/Ag can be an efficient electron donor for the electrochemical reduction of 4-nitrophenol (4-nitrophenol acts as an electron acceptor to convert p-(hydroxyamino)-phenol).
Table 3. Frontier Orbital Energies η, μ, S, χ, and ω of the SrTiO3/Ag/rGO Combination Were Computed Using B3LYP/6-31G++(d,p) Levels.
| parameters | LANL2D2/B3LYP/6-31G++(d,p) |
|---|---|
| SCF energy (a.u) | –459.9595 |
| EHOMO (eV) | –9.3903 |
| ELUMO (eV) | –6.9444 |
| ΔEGAP (eV) | 2.446 |
| EHOMO–1 (eV) | –9.99756 |
| ELUMO+1 (eV) | –6.5337 |
| ΔEGAP (eV) | 3.4639 |
| EHOMO–2 (eV) | –10.1646 |
| ELUMO+2 (eV) | –5.3355 |
| ΔEGAP (eV) | 4.5292 |
| χ (eV) | 8.1674 |
| μ (eV) | –8.1674 |
| η (eV) | 1.2229 |
| S (eV) | 0.8178 |
| ω = μ2/2η | 0.9145 |
3.6.2. Molecular Electrostatic Potential, Total Electron Density, and Electrostatic Potential
Molecular electrostatic potential (MEP), electron density (ED), and electrostatic potential (ESP) of SrTiO3/Ag (in this work, we consider rGO as a ligand, so we run all DFT work-based metal-oxide frameworks) are shown in Figure S5 of the current work. The MEP, a depiction of ESP projected onto the surface of constant ED given that an approaching electrophile would be drawn to negative areas where the electron distribution effect is predominant, is a valuable feature to research reactivity. In the majority of MEP, the most positive region chose the site for nucleophilic attack symptoms as blue, while the most negative region preferred the location for electrophilic attack indications as red. The significance of MEP lies in the simultaneous display of positive, negative, and neutral ESP regions, molecular size, and shape in terms of color grading (Figure 10). MEP is also very helpful in the research of molecular structure with its physiochemical property relationship. The resultant surface shows the ESP value, molecule size, and shape all at once. Red, blue, and green depict the regions with the most negative potential, most positive potential, and zero ESP, respectively, while the varied values of the ESP at the MEP surface are shown by different hues. These maps include color codes that range from −0.337 au (deepest red) through 0.337 au (deepest blue), whereas blue indicates the strongest attraction and red indicates the sharpest repulsion. Regions that are negative V(r) are frequently connected with the only pairs of atoms that are electronegative. According to the MEP map of the molecule shown in the title, the positive potential regions are located over the (Sr) atom, while the negatively charged regions are located around the electronegative oxygen atoms. According to these findings, the Sr atom shows the most attraction, whereas the (O–Ti–O) atoms show the strongest repulsion. From the DFT studies, the SrTiO3/Ag/rGO composite provides a nucleophilic and electrophilic site, which involves a proton-transfer reaction during electrochemical detection of 4-nitrophenol.
Figure 10.

ESP, ED, and MEP map for SrTiO3–Ag.
4. Conclusions
To summarize, the SrTiO3/Ag/rGO composite was successfully prepared at a minimal temperature through an ultrasonic-assisted technique. The ultrasonic-assisted synthesized SrTiO3/Ag/rGO composite material possesses distinctive properties, including spherical morphology onto rGO layers. Composite formation and elemental presence of SrTiO3/Ag/rGO were in agreement with spectroscopic studies as XRD, EDAX, and Raman analysis. The SrTiO3/Ag/rGO/SPCE-modified electrode shows an efficient electron mediator for the electrochemical reduction of 4-nitrophenol in neutral buffer solution due to excellent electronic characteristics, facile electron transfers, and good conductivity ability. The LSV approach stands out as an excellent electrochemical sensor for practical use, and it exhibited a lower LOD value of 0.03 M with stronger selectivity even in the chemicals that can interfere. Moreover, the real sample analysis of tap water and river water proved the successful practicability of the SrTiO3/Ag/rGO/SPCE-modified sensor. Further, computational studies reveal that the HOMA and LUMO energy difference is 2.446 eV in the SrTiO3/Ag/rGO composite, and the MEP mapping also reveals the electron donor characteristic during the electrochemical process. As a result, the SrTiO3/Ag/rGO/SPCE-modified electrode provides a good candidate for analytical application.
Supporting Information Available
The Supporting Information is available free of charge at https://pubs.acs.org/doi/10.1021/acsomega.3c05111.
EDS spectrum of pure SrTiO3, SrTiO3/Ag, SrTiO3/rGO, and SrTiO3/Ag/rGO composites with percentage of elements; UV–visible spectrum of SrTiO3, SrTiO3/Ag, and SrTiO3/rGO composites; pH performance of SrTiO3/Ag//rGO/SPCE; histogram plot of different pH vs current (μA); plot of 4-nitrophenol concentration (0.1–1 μM) vs anodic peak current obtained for SrTiO3/Ag//rGO/SPCE; plot of 4-nitrophenol concentration (100–1000 μM) vs anodic peak current obtained for SrTiO3/Ag//rGO/SPCE pH; histogram representing stability studies for 14 days of 100 μM of 4-nitrophenol at 50 mV/s; reproducibility studies of the five different SrTiO3/Ag/rGO/SPCE-modified electrodes; LSV response of the peak current vs different interferences at SrTiO3/Ag//rGO/SPCE; and optimized structure of the SrTiO3/Ag composite (PDF)
This study was supported via funding from Prince Sattam bin Abdulaziz University project number (PSAU/2023/R/1444).
The authors declare no competing financial interest.
Supplementary Material
References
- Hai-Bo W.; Bei-Bei T.; Ning-Ning W.; Hong-Ding Z.; Yan-Ming L. Glutathione-stabilized copper nanoclusters mediated-inner filter effect for sensitive and selective determination of p-nitrophenol and alkaline phosphatase activity. Spectrochim. Acta, Part A 2022, 271, 10697–10703. 10.1016/j.saa.2022.120948. [DOI] [PubMed] [Google Scholar]
- Li G.; Wu J.; Qi X.; Wan X.; Liu Y.; Chen Y.; Xu L. Molecularly imprinted polypyrrole film-coated poly(3,4-ethylenedioxythiophene):polystyrene sulfonate-functionalized black phosphorene for the selective and robust detection of norfloxacin. Mater. Today Chem. 2022, 26, 101043. 10.1016/j.mtchem.2022.101043. [DOI] [Google Scholar]
- Li G.; Qi X.; Wu J.; Xu L.; Wan X.; Liu Y.; Chen Y.; Li Q. Ultrasensitive, label-free voltammetric determination of norfloxacin based on molecularly imprinted polymers and Au nanoparticle-functionalized black phosphorus nanosheet nanocomposite. J. Hazard. Mater. 2022, 436, 129107. 10.1016/j.jhazmat.2022.129107. [DOI] [PubMed] [Google Scholar]
- Xia Y.; Li G.; Zhu Y.; He Q.; Hu C. Facile preparation of metal-free graphitic-like carbon nitride/graphene oxide composite for simultaneous determination of uric acid and dopamine. Microchem. J. 2023, 190, 108726. 10.1016/j.microc.2023.108726. [DOI] [Google Scholar]
- Li G.; Qi X.; Zhang G.; Wang S.; Li K.; Wu J.; Wan X.; Liu Y.; Li Q. Low-cost voltammetric sensors for robust determination of toxic Cd(II) and Pb(II) in environment and food based on shuttle-like α-Fe2O3 nanoparticles decorated β-Bi2O3 microspheres. Microchem. J. 2022, 179, 107515. 10.1016/j.microc.2022.107515. [DOI] [Google Scholar]
- Wang H.; Tao B.; Wu N. DNA-Au nanoclusters inner filter effect induced fluorescence quenching for sensitive detection of 4-nitrophenol. J. Xinyang Norm. Univ. 2022, 35 (3), 464–468. [Google Scholar]
- Fang Y. X.; Guo S. J.; Zhu C. Z.; Zhai Y. M.; Wang E. K. Self-assembly of cationic polyelectrolyte-functionalized graphene nanosheets and gold nanoparticles: A two-dimensional heterostructure for hydrogen peroxide sensing. Langmuir 2010, 26, 11277–11282. 10.1021/la100575g. [DOI] [PubMed] [Google Scholar]
- Baby J. N.; Sriram B.; Wang S. F.; George M. Effect of various deep eutectic solvents on the sustainable synthesis of MgFe2O4 nanoparticles for simultaneous electrochemical determination of nitrofurantoin and 4-nitrophenol. ACS Sustainable Chem. Eng. 2020, 8 (3), 1479–1486. 10.1021/acssuschemeng.9b05755. [DOI] [Google Scholar]
- Sajjan V. A.; Aralekallu S.; Nemakal M.; Palanna M.; Keshavananda Prabhu C.; Koodlur Sannegowda L. Nanomolar detection of 4-nitrophenol using Schiff-base phthalocyanine. Microchem. J. 2021, 164, 105980. 10.1016/j.microc.2021.105980. [DOI] [Google Scholar]
- Rahman M. M.; Wahid A.; Alam M.; Asiri A. M.; Abdullah M. Asiri, Efficient 4-nitrophenol sensor development based on facile Ag@Nd2O3 nanoparticles. Mater. Today Commun. 2018, 16, 307–313. 10.1016/j.mtcomm.2018.07.009. [DOI] [Google Scholar]
- Faisal M.; Abu Tariq M.; Muneer M. Semiconductor mediated photo-catalyzed degradation of two selected pesticide derivatives, 4-cyanophenol and 4-aminophenol in aqueous suspension. Sci. Adv. Mater. 2011, 3 (1), 66–72. 10.1166/sam.2011.1132. [DOI] [Google Scholar]
- Paul D.; Sachan D.; Das G. Silver nanoparticles embedded on in-vitro biomineralized vaterite: a highly efficient catalyst with enhanced catalytic activity towards 4-nitrophenol reduction. Mol. Catal. 2021, 504, 111433. 10.1016/j.mcat.2021.111433. [DOI] [Google Scholar]
- Nemakal M.; Aralekallu S.; Mohammed I.; Pari M.; Venugopala Reddy K.; Sannegowda L. K. Nanomolar detection of 4-aminophenol using amperometric sensor based on a novel phthalocyanine. Electrochim. Acta 2019, 318, 342–353. 10.1016/j.electacta.2019.06.097. [DOI] [Google Scholar]
- Tailor N. K.; Abdi-Jalebi M.; Gupta V.; Hu H.; Dar M. I.; Li G.; Satapathi S. Recent progress in morphology optimization in perovskite solar cell. J. Mater. Chem. A 2020, 8, 21356–21386. 10.1039/D0TA00143K. [DOI] [Google Scholar]
- Takata T.; Jiang J.; Sakata Y.; Nakabayashi M.; Shibata N.; Nandal V.; Seki K.; Hisatomi T.; Domen K. Photocatalytic water splitting with a quantum efficiency of almost unity. Nature 2020, 581, 411–414. 10.1038/s41586-020-2278-9. [DOI] [PubMed] [Google Scholar]
- Wang C.; Liu J.; Cai X.; Jia Q.; Duan D. Perovskite micro-nano cage SrTiO3: formation mechanism, vacancy analysis, and exciton dynamics. J. Phys. Chem. C 2022, 126, 15962–15970. 10.1021/acs.jpcc.2c04059. [DOI] [Google Scholar]
- Govindasamy M.; Wang S. F.; Pan W. C.; Subramanian B.; Ramalingam R. J.; Al-lohedan H. Hamad Al-lohedan, Facile sonochemical synthesis of perovskite-type SrTiO3 nanocubes with reduced graphene oxide nanocatalyst for an enhanced electrochemical detection of α-amino acid (tryptophan). Ultrason. Sonochem. 2019, 56, 193–199. 10.1016/j.ultsonch.2019.04.004. [DOI] [PubMed] [Google Scholar]
- Sharifian K.; Mahdikhah V.; Sheibani S. Ternary Ag@SrTiO3@CNT plasmonic nanocomposites for the efficient photodegradation of organic dyes under the visible light irradiation. Ceram. Int. 2021, 47, 22741–22752. 10.1016/j.ceramint.2021.04.291. [DOI] [Google Scholar]
- Wu Z.; Zhang Y.; Wang X.; Zou Z. Ag@SrTiO3 nanocomposite for super photocatalytic degradation of organic dye and catalytic reduction of 4-nitrophenol. New J. Chem. 2017, 41, 5678–5687. 10.1039/C7NJ00522A. [DOI] [Google Scholar]
- Dalkiran B.; Brett C. M. Polyphenazine and polytriphenylmethane redox polymer/nanomaterial-based electrochemical sensors and biosensors: a review. Microchim. Acta 2021, 188 (5), 178–220. 10.1007/s00604-021-04821-1. [DOI] [PubMed] [Google Scholar]
- Wu N.; Hu Q.; Wei R.; Mai X.; Naik N.; Pan D.; Guo Z.; Shi Z. Review on the electromagnetic interference shielding properties of carbon-based materials and their novel composites: Recent progress, challenges and prospects. Carbon 2021, 176, 88–105. 10.1016/j.carbon.2021.01.124. [DOI] [Google Scholar]
- Luo X. Y.; Chen Y.; Mo Y. A review of charge storage in porous carbon-based supercapacitors. N. Carbon Mater. 2021, 36 (1), 49–68. 10.1016/S1872-5805(21)60004-5. [DOI] [Google Scholar]
- Thirumalraj B.; Palanisamy S.; Chen S. M.; Yang C. Y.; Periakaruppan P.; Lou B. S. Direct electrochemistry of glucose oxidase and sensing of glucose at a glassy carbon electrode modified with a reduced graphene oxide/fullerene-C60 composite. RSC Adv. 2015, 5, 77651–77657. 10.1039/c5ra12018g. [DOI] [Google Scholar]
- Gao H.; Yang H.; Wang S. Hydrothermal synthesis, growth mechanism, optical properties and photocatalytic activity of cubic SrTiO3 particles for the degradation of cationic and anionic dyes. Optik 2018, 175, 237–249. 10.1016/j.ijleo.2018.09.027. [DOI] [Google Scholar]
- Zhang J.; Huang M.; Yanagisawa K.; Yao S. NaCl-H2O-assisted preparation of SrTiO3 nanoparticles by solid state reaction at low temperature. Ceram. Int. 2015, 41, 5439–5444. 10.1016/j.ceramint.2014.12.110. [DOI] [Google Scholar]
- Hussain T.; Junaid M.; Qayyum H. A. Preparation of Ba-doped SrTiO3 photocatalyst by sol-gel method for hydrogen generation. Chem. Phys. Lett. 2020, 754, 137741. 10.1016/j.cplett.2020.137741. [DOI] [Google Scholar]
- Dhanalakshmi M.; Nagabhushana H.; Darshan G. P.; Daruka Prasad B. Ultrasound assisted sonochemically engineered effective red luminescent labeling agent for high resolution visualization of latent fingerprints. Mater. Res. Bull. 2018, 98, 250–264. 10.1016/j.materresbull.2017.09.059. [DOI] [Google Scholar]
- Antonio Fuentes-Garcia J.; Carvalho Alavarse A.; Carolina Moreno Maldonado A.; Toro-Cordova M.; Ibarra M. R.; Goya G. F. Simple sonochemical method to optimize the heating efficiency of magnetic nanoparticles for magnetic fluid hyperthermia. ACS Omega 2020, 41, 26357–26364. 10.1021/acsomega.0c02212. [DOI] [PMC free article] [PubMed] [Google Scholar]
- Ahamed J. I.; Priya M.; Vinothkumar P.; Sathyamoorthy K.; Murali-Manohar P.; Liu J.; Valan M. F. A combined experimental and DFT computations study of novel (E)-3-(benzofuran-2-yl)-2-(thiophen-2-yl)acrylonitrile(TACNBNF): Insight into the synthesis, single crystal XRD, NMR, vibrational spectral analysis, in vitro antioxidant and in silico molecular docking investigation with human peroxiredoxin 5 protein. J. Mol. Struct. 2020, 1202, 127241. 10.1016/j.molstruc.2019.127241. [DOI] [Google Scholar]
- Ahamed J. I.; Valan M. F.; Pandurengan K.; Agastian P.; Venkatadri B.; Rameshkumar M. R.; Narendran K. A novel method for the synthesis and characterization of 10-hexyl-3-(1-hexyl-4,5-diphenyl-1H-imidazole-2-yl)-10H-phenothiazine: DFT computational, in vitro anticancer and in silico molecular docking studies. Res. Chem. Intermed. 2021, 47, 759–794. 10.1007/s11164-020-04297-3. [DOI] [Google Scholar]
- Ahamed J. I.; Ramkumaar G. R.; Kamalarajan P.; Narendran K.; Valan M. F.; Sundareswaran T.; Sundaravadivel T. A.; Venkatadri B.; Bharathi S. Novel quinoxaline derivatives of 2, 3-diphenylquinoxaline-6-carbaldehyde and 4, 4′-(6-methylquinoxaline-2,3-diyl)bis(N,N-diphenylaniline): Synthesis, structural, DFT-computational, molecular docking, antibacterial, antioxidant, and anticancer studies. J. Mol. Struct. 2022, 1248, 131418. 10.1016/j.molstruc.2021.131418. [DOI] [Google Scholar]
- Arularasu M. V.; Harb M.; Vignesh R.; Rajendran T. V.; Sundaram R. PVDF/ZnO hybrid nanocomposite applied as a resistive humidity sensor. Surface. Interfac. 2020, 21, 100780. 10.1016/j.surfin.2020.100780. [DOI] [Google Scholar]
- Guo M.; Liu Q.; Wu M.; Lv T.; Jia L. Novel reduced graphene oxide wrapped-SrTiO3 flower-like nanostructure with Ti-C bond for free noble metal decomposition of formic acid to hydrogen. Chem. Eng. J. 2018, 334, 1886–1896. 10.1016/j.cej.2017.11.120. [DOI] [Google Scholar]
- Calisir M. D.; Gungor M.; Demir A.; Kilic A.; Khan M. M. Nitrogen-doped TiO2 fibers for visible-light-induced photocatalytic activities. Ceram. Int. 2020, 46, 16743–16753. 10.1016/j.ceramint.2020.03.250. [DOI] [Google Scholar]
- Wu Z.; Zhang Y.; Wang X.; Zou Z. Ag@SrTiO3 nanocomposite for super photocatalytic degradation of organic dye and catalytic reduction of 4-nitrophenol. New J. Chem. 2017, 41, 5678–5687. 10.1039/C7NJ00522A. [DOI] [Google Scholar]
- Xian T.; Yang H.; Di L.; Ma J.; Zhang H.; Dai J. Photocatalytic reduction synthesis of SrTiO3-graphene nanocomposites and their enhanced photocatalytic activity. Nanoscale Res. Lett. 2014, 9, 327. 10.1186/1556-276x-9-327. [DOI] [PMC free article] [PubMed] [Google Scholar]
- Guediri M. K.; Chebli D.; Bouguettoucha A.; Bourzami R.; Amrane A. Interfacial coupling effects on adsorptive and photocatalytic performances for photoresponsive graphene-wrapped SrTiO3@Ag under UV-visible light: experimental and DFT approach. Environ. Sci. Pollut. Res. 2022, 29, 28098–28114. 10.1007/s11356-021-17543-x. [DOI] [PubMed] [Google Scholar]
- Ahmadi M.; Seyed Dorraji M. S.; Rasoulifard M. H.; Amani-Ghadim A. R. The effective role of reduced-graphene oxide in visible light photocatalytic activity of wide band gap SrTiO3 semiconductor. Sep. Purif. Technol. 2019, 228, 115771. 10.1016/j.seppur.2019.115771. [DOI] [Google Scholar]
- Gu L.; Wei H.; Peng Z.; Wu H. Defects enhanced photocatalytic performances in SrTiO3 using laser-melting treatment. J. Mater. Res. 2017, 32, 748–756. 10.1557/jmr.2016.461. [DOI] [Google Scholar]
- Živojinović J.; Pavlović V. P.; Kosanović D.; Marković S.; Krstić J.; Blagojević V. A.; Pavlović V. B. The influence of mechanical activation on structural evolution of nanocrystalline SrTiO3 powders. J. Alloys Compd. 2017, 695, 863–870. 10.1016/j.jallcom.2016.10.159. [DOI] [Google Scholar]
- Ashok kumar M.; Muthu kumaran S. Tuning of energy gap, microstructure, optical and structural properties of Cr doped Zn0.96Cu0.04O nanoparticles. Powder Technol. 2014, 258, 157–164. 10.1016/j.powtec.2014.03.013. [DOI] [Google Scholar]
- Akilarasan M.; Tamilalagan E.; Chen S. M.; Maheshwaran S.; Chen T. W.; Al-Mohaimeed A. M.; Al-Onazi W. A.; Elshikh M. S. An eco-friendly low-temperature synthetic approach towards micro-pebble-structured GO@SrTiO3 nanocomposites for the detection of 2,4,6-trichlorophenol in environmental samples. Microchim. Acta 2021, 188, 72. 10.1007/s00604-021-04729-w. [DOI] [PubMed] [Google Scholar]
- Abid P.; Sehrawat P.; Islam S. S.; Mishra P.; Ahmad S. Reduced graphene oxide (rGO) based wideband optical sensor and the role of Temperature, Defect States and Quantum Efficiency. Sci. Rep. 2018, 8, 3537. 10.1038/s41598-018-21686-2. [DOI] [PMC free article] [PubMed] [Google Scholar]
- Zhang C.; Govindaraju S.; Giribabu K.; Huh Y. S.; Yun K. Ag NWs-PANI nanocomposite based electrochemical sensor for detection of 4-nitrophenol. Sens. Actuators, B 2017, 252, 616–623. 10.1016/j.snb.2017.06.039. [DOI] [Google Scholar]
- Zhou Y.; Zhao J.; Li S.; Guo M.; Fan Z. An electrochemical sensor for the detection of p-nitrophenol based on a cyclodextrin-decorated gold nanoparticle-mesoporous carbon hybrid. Analyst 2019, 144, 4400–4406. 10.1039/C9AN00722A. [DOI] [PubMed] [Google Scholar]
- Subash V. S.; Alagumalai K.; Chen S. M.; Shanmugam R.; Shiuan H. J. Ultrasonication assisted synthesis of NiO nanoparticles anchored on graphene oxide: an enzyme-free glucose sensor with ultrahigh sensitivity. New J. Chem. 2020, 44, 15071–15080. 10.1039/d0nj02127j. [DOI] [Google Scholar]
- Yang X.; Meng J.; Wang Y.; Meng Q.; Hu Y.; Di A.; Wu Y.; Chen G. Novel formation of Bi@BiFe-glycolate hollow spheres and their conversion into Bi2O3/BiFeO3 composite hollow spheres with enhanced activity and durability in visible photocatalysis. New J. Chem. 2018, 42, 10697–10703. 10.1039/c8nj00949j. [DOI] [Google Scholar]
- Abdel-Aziz A. M.; Hassan H. H.; Badr I. H. A.; Ibrahim H. A. Activated Glassy Carbon Electrode as an Electrochemical Sensing Platform for the Determination of 4-Nitrophenol and Dopamine in Real Samples. ACS Omega 2022, 7, 34127–34135. 10.1021/acsomega.2c03427. [DOI] [PMC free article] [PubMed] [Google Scholar]
- Thirumalraj B.; Rajkumar C.; Chen S. M.; Lin K. Y. Determination of 4-nitrophenol in water by use of a screen-printed carbon electrode modified with chitosan-crafted ZnO nanoneedles. J. Colloid Interface Sci. 2017, 499, 83–92. 10.1016/j.jcis.2017.03.088. [DOI] [PubMed] [Google Scholar]
- Zhang T.; Lang Q.; Yang D.; Li L.; Zeng L.; Zheng C.; Li T.; Wei M.; Liu A. Simultaneous voltammetric determination of nitrophenol isomers at ordered mesoporous carbon modified electrode. Electrochim. Acta 2013, 106, 127–134. 10.1016/j.electacta.2013.05.055. [DOI] [Google Scholar]
- Hwa K. Y.; Sharma T. S. K.; Ganguly A. Design strategy of rGO-HNT-AgNPs based hybrid nanocomposite with enhanced performance for electrochemical detection of 4-nitrophenol. Inorg. Chem. Front. 2020, 7 (10), 1981–1994. 10.1039/D0QI00006J. [DOI] [Google Scholar]
- Wang M. H.; Liu Y. K.; Yang L. Y.; Tian K.; He L. H.; Zhang Z. H.; Jia Q. J.; Song Y. P.; Fang S. M. Bimetallic metal-organic framework derived FeOX/TiO2 embedded in mesoporous carbon nanocomposite for the sensitive electrochemical detection of 4-nitrophenol. Sens. Actuators, B 2019, 281, 1063–1072. 10.1016/j.snb.2018.11.083. [DOI] [Google Scholar]
- Wiench P.; Grzyb B.; González Z.; Menéndez R.; Handke B.; Gryglewicz G. pH robust electrochemical detection of 4-nitrophenol on a reduced graphene oxide modified glassy carbon electrode. J. Electroanal. Chem. 2017, 787, 80–87. 10.1016/j.jelechem.2017.01.040. [DOI] [Google Scholar]
- Chinnapaiyan S.; Chen T. W.; Chen S. M.; Abdullah Alothman Z.; Ajmal Ali M.; Wabaidur S.; Al-Hemaid F.; Lee S. Y.; Chang W. H. Ultrasonic-assisted preparation and characterization of magnetic ZnFe2O4/g-C3N4 nanomaterial and their applications towards electrocatalytic reduction of 4-nitrophenol. Ultrason. Sonochem. 2020, 68, 105071. 10.1016/j.ultsonch.2020.105071. [DOI] [PubMed] [Google Scholar]
- Ramu A. G.; Salla S.; Gopi S.; Silambarasan P.; Yang D. J.; Song M. J.; Ali H. M.; Salem M. Z. M.; Choi D. Surface-tuned hierarchical γ-Fe2O3-N-rGO nanohydrogel for efficient catalytic removal and electrochemical sensing of toxic nitro compounds. Chemosphere 2021, 268, 128853. 10.1016/j.chemosphere.2020.128853. [DOI] [PubMed] [Google Scholar]
- Huang W.; Yang C.; Zhang S. Simultaneous determination of 2-nitrophenol and 4- nitrophenol based on the multi-wall carbon nanotubes Nafion-modified electrode. Anal. Bioanal. Chem. 2003, 375, 703–707. 10.1007/s00216-002-1745-5. [DOI] [PubMed] [Google Scholar]
- Vinoth S.; Sampathkumar P.; Giribabu K.; Pandikumar A. Ultrasonically assisted synthesis of barium stannate incorporated graphitic carbon nitride nanocomposite and its analytical performance in electrochemical sensing of 4-nitrophenol. Ultrason. Sonochem. 2020, 62, 104855. 10.1016/j.ultsonch.2019.104855. [DOI] [PubMed] [Google Scholar]
Associated Data
This section collects any data citations, data availability statements, or supplementary materials included in this article.