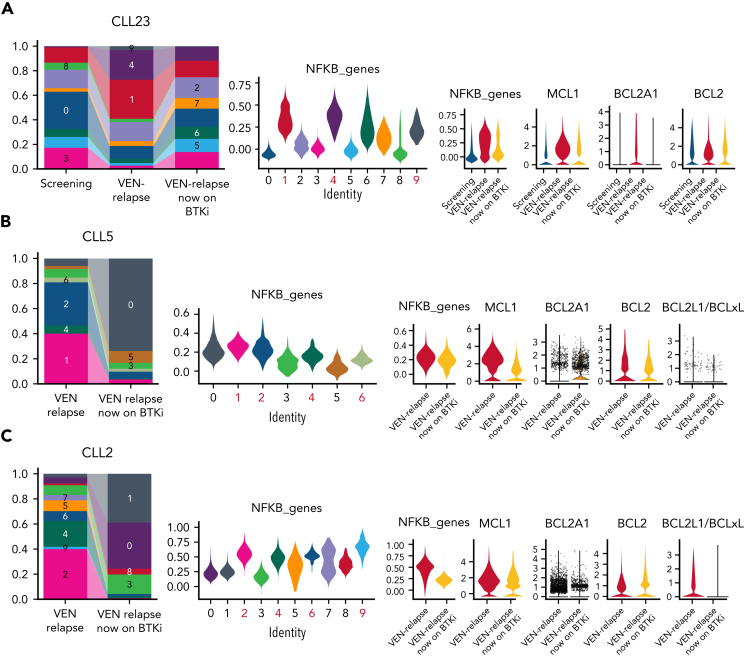
Figure 6.
Altered transcriptional profiles at relapse dissipate after cessation of VEN therapy. (A) Bar plots (left) showing the proportion of CLL cells for each cluster (supplemental Figure 9A) from CLL23 samples collected at screening, after relapse while on VEN, and after subsequently switching to BTKi. Violin plots (middle; NF-κB high clusters marked in red) showing the expression of NF-κB genes for each cluster are shown on the left. Violin plots (right) showing NFKB genes, MCL1, BCL2A1, or BCL2 expression at different treatment stages for CLL23. (B-C) Bar plots (left) showing the proportion of CLL cells for each cluster (supplemental Figure 9B-C) from (B) CLL5 or (C) CLL2 samples collected at relapse while on VEN and after subsequently switching to BTKi. Violin plots (middle) showing the expression of NF-κB genes for each cluster are shown on the left. Violin plots (right) showing NFKB genes, MCL1, BCL2A1, BCL2, or BCLxL expression at different treatment stages for (B) CLL5 or (C) CLL2.

