

Abstract
The evolution of microbes in response to conventional antimicrobials leads to antimicrobial resistance (AMR) and multidrug resistance (MDR), and it is a global threat to public health. Natural products are possible solutions to this massive challenge. In this study, the potential of Acanthus polystachyus extracts was investigated for phytochemical composition and biological properties as antimicrobials. Gas chromatography-mass spectra (GC-MS) analysis of methanol extract (ME) and essential oil (EO) detected 79 and 20 compounds, respectively. The major compounds identified in ME and their abundance were β-sitosterol acetate (16.06%), cholest-5-en-3-yl (9Z)-9-octadecenoate (9.54%), 1-dodecanol (7.57%), (S)-(E)-(−)-4-acetoxy-1-phenyl-2-dodecen-1-one (6.03%), neophytadiene (5.7%), (E)-2-nonadecene (3.9%), hexanol-4-D2 (2.92%), and decane (2.4%). Most compounds have known bioactive functions. In EO, the major compounds were stearyl alcohol (25.38%); cis-9-tetradecenoic acid, isobutyl ester (22.95%); butyl 9-tetradecenoate (10.62%); 11,13-dimethyl-12-tetradecen-1-ol acetate (10.14%); ginsenol (3.48%); and diisooctyl phthalate (2.54%). All compounds are known to be bioactive. The antioxidant activity of ME and EO ranged from 48.3 to 84.2% radical scavenging activity (RSA) and 45.6 to 82% RSA, respectively, with dose dependency. The disc diffusion assay for the antimicrobial activity of ME revealed high inhibition against Acenetobacter baumannii (130.2%), Pseudomonas aeruginosa (100.3%), and Staphylococcus aureus (87.7%). The MIC, MBC/MFC, and MBIC values for ME were 0.5–1.0, 2–4, and 0.5–1.0 mg/mL and for EO were 0.31–0.62, 1.25–2.5, and 0.31–0.62 μL/mL, respectively, indicating inhibition potential as well as inhibition of biofilm formation. The tolerance test values indicated bactericidal activity against most strains and bacteriostatic/fungistatic activity against A. baumannii, E. faecalis, and C. albicans. The antiquorum sensing activity of ME achieved by pyocyanin inhibition assay on P. aeruginosa showed a 51.6% inhibition at 500 μg/mL. These results suggest that ME and EO derived from A. polystachyus leaves are potent, valuable, cost-effective antioxidants and antimicrobials. Both extracts may effectively combat pathogenic and resistant microbes.
1. Introduction
In modern medicine, antimicrobial treatment is one of the main approaches, which is used to combat infectious diseases caused by pathogenic microorganisms.1 However, the massive emergence and re-emergence of resistance against conventional antimicrobials pose a serious global threat to treating infections, which is of growing concern to human, animal, and environmental health.2 In 2017, the World Health Organization (WHO) recognized antimicrobial resistance (AMR) as a major threat to global health in response to the massive increase in populations of multidrug-resistant strains.3,4 The plausible causes of AMR include the excessive use of antibiotics in animals and humans, easy accessibility to antibiotics (over-the-counter), increased international travel, poor sanitation, and release of nonmetabolized antibiotics or their residues into the environment through manure or feces.3 These factors contribute to genetic selection pressure for the emergence of multidrug resistance (MDR) microbes.2 MDR and ADR give rise to infections such as hospital-acquired, urinary tract infections (UTIs), ulcerative skin, lungs, ears, eyes, and catheters leading to increased medical costs, morbidity, and mortality. Several clinically relevant bacteria such as Escherichia coli, Klebsiella pneumoniae, Staphylococcus aureus, Pseudomonas aeruginosa, methicillin-resistant Staphylococcus aureus (MRSA), Acinetobacter spp., Enterobacter spp., Proteus spp., and others cause infections, AMR, and MDR.5,6S. aureus is considered the most notorious “superbug” (e.g., MRSA, CA-MRSA). It is a nasal commensal of humans and can cause skin infections.7A. baumannii and P. aeruginosa are MDR opportunistic pathogens that may grow in niches with high antibiotic pressure where several other bacteria may not survive.8 AMR and MDR patterns in Gram-negative and Gram-positive bacteria give rise to infections that are either difficult to treat or impossible to cure with conventional antimicrobials.2,5
The formation of biofilm and quorum sensing are the significant factors contributing to AMR and MDR.9,10 A biofilm is a collection of microorganisms that adhere to a surface and create a matrix of extracellular macromolecular substances composed of microorganisms and extracellular polymeric substances (EPS).10,11 EPS are organic polymers involved in bacterial interaction with their environment and mainly comprised of polysaccharides, proteins, extracellular DNA (eDNA), and lipids.12 Both Gram-positive and Gram-negative bacteria are able to form biofilms. The formation of biofilms occurs in two stages: the planktonic stage and the adherent stage. Biofilms are highly resistant to the immune system of the host and antibacterial agents. Microbes inside biofilms can withstand 10–1000 times higher concentrations of antibiotics than cells in their plankton form.13 Antibiotic treatment can eliminate planktonic cells; however, it is difficult to treat biofilms.14 The increased dosage required to treat biofilm-forming microbes directly translates into an increased cost of treatment. Biofilm-related MDR significantly impacts hospital settings and the emergence of MDR. Biofilms are currently estimated to be responsible for more than 65% of nosocomial infections and 80% of all microbial infections.15 Various mechanisms have been recognized for antimicrobial resistance, by the formation of biofilms. Most notably, reduced permeability to antibiotics by the formation of barrier, detoxification mechanism that produces enzymes to render the antibiotic inactive by disrupting or altering the antibiotic structure, reduction of intracellular concentration of antibiotics by drug efflux pumps, and drug sequestration by specific proteins that prevent the binding of antibiotics to their targets have been well documented.10,16−18 Quorum sensing (QS), an important cell–cell communication system, plays essential roles in regulating biofilm formation, virulence gene expression, drug efflux pumps, and plasmid transfer.9,16 The communication between cells in QS-regulated systems is carried out by the production of QS signals in the form of diffusible autoinducers (molecules), such as N-acylhomoserine lactone (AHL) in Gram-negative bacteria and autoinducing peptide (AIP) in Gram-positive bacteria.9 These signal molecules function via interaction with specific enzymes and receptor–activator proteins. For example, many Gram-negative bacteria use similar LuxI-type synthases and LuxR-type activator proteins.17,19 Therefore, developing antibiofilm agents and anti-QS inhibitors is crucial for developing antimicrobials.
The discovery and development of antibiotics during the “golden period” (1930–1960s) have saved millions of lives;1 however, the difficulty to maintain the pace of antibiotic discovery with the emerging and re-emerging resistant pathogens has mounted the current massive challenge to contain and treat infections.6,17 Therefore, there is an urgent need to search for and discover novel alternate treatment strategies to combat AMR and MDR. Several approaches have been developed including antibodies, vaccines, antimicrobial peptides (AMPs), probiotics, plant natural products, and nanobiotechnology.2,20 Natural products derived from plants and microbes have received particular attention.21 The natural products in different parts of plants are comprised of phenols, tannins, flavonoids, saponins, terpenoids, essential oils, alkaloids, steroids, lectins, polypeptides, etc. These molecules are medicinally bioactive and exert antimicrobial action via different mechanisms that target various cellular processes. Tannins are involved in the inhibition of cell wall synthesis,22 flavonoids complex with extracellular and soluble proteins and cell wall leading to antimicrobial activity,23 saponins are responsible for leakage of proteins and enzymes from the cell,24 terpenoids weaken the membranous tissue leading to dissolution of the cell walls,25 fatty acid esters in essential oils possess antibacterial properties,26 steroids associate with membrane lipids and cause leakage from liposomes to show bactericidal action,27 and several peptides are also known to be efficient antimicrobials.21 Therefore, plant-derived natural products provide a wide array of compounds that may facilitate reducing and eradicating the load of pathogenic bacterial populations for treating infections.21
In this study, we focused on Acanthus polystachyus Delile to prepare leaf extracts and evaluate their biological properties. A. polystachyus Delile is a shrub belonging to the family Acanthaceae and native to Burundi, Ethiopia, Kenya, Rwanda, Sudan, Tanzania, and Uganda. This species grows at medium to high altitudes (1000–3200 m) in different parts of Ethiopia and is characterized by pink flowers and soft, hairy leaves.28 The Acanthaceae family is pharmacologically important for antifungal, anti-inflammatory, antipyretic, antioxidant, antiviral, antimalarial, insecticidal, hepatoprotective, immunomodulatory, and antiplatelet activities.29,30A. polystachyus Delile has been investigated for antimalarial and wound healing activities;28,31 however, there is only one report regarding its antimicrobial potential.32 To the best of our knowledge, the inhibition of biofilm formation and quorum sensing by this plant species has yet to be investigated. Furthermore, a detailed analysis of the composition of extracts of this important medicinal plant has yet to be elucidated. The knowledge and understanding of the constituents of extracts are essential to elucidating the mechanisms of action. In most reported studies, solvents such as methanol, water, and acetone have been used for extraction from leaves and roots. Essential oils (EOs) have excellent therapeutic potential; however, the EO of this flowering plant species has yet to be explored. Therefore, in the present study, we prepared methanol extract (ME) and EO from the leaves of A. polystachyus Delile and investigated the qualitative (biochemical methods) and quantitative (gas chromatography-mass spectra (GC-MS)) phytochemical composition and evaluated the potential of the extracts for antioxidant, antibacterial, antibiofilm, and antiquorum sensing properties. We expect that the results presented here will appreciate the medicinal potential of A. polystachyus Delile and contribute toward combating pathogenic and resistant bacteria responsible for causing fatal diseases.
2. Results and Discussion
A. polystachyus is traditionally used for various medicinal purposes and has recently been shown to be effective in treating malaria and wounds.28,31 It also possesses antibacterial properties.32 It has been observed and reported that the chemical constituents of plant species may vary depending on the environmental conditions, places where it grows, soil structure, and so on.33 Therefore, the identification and analysis of phytochemical components aid in understanding of the involvement of natural chemical constituents and their mechanisms.34 In this study, we performed GC-MS analysis of ME and EO’s phytochemical composition and various biological properties, such as antioxidation, antibacterial, antibiofilm, and antiquorum sensing.
2.1. Phytochemical Analysis (Qualitative and Quantitative)
The ME yield was found to be 20.5%, and the yield from EO was recorded at 0.4%, which agrees with the yields observed from several different plant leaves. The qualitative analysis of ME based on biochemical assays indicated the presence of alkaloids, flavonoids, saponins, tannins, phenols, steroids, and terpenoids; however, glycosides were absent (Table S1). The UV spectra recorded in the range of 200–400 nm for EO indicated the presence of terpenes, phenols, flavonoids, coumarins, and alkaloids. Terpenes have a UV absorption maximum in the 210–220 nm range because of the conjugated pi systems; phenols have a UV absorption maximum in the 270–280 nm range due to the presence of aromatic rings; flavonoids have a UV absorption maximum in the 290–300 nm range due to the hydroxyl groups; coumarins have a UV absorption maximum in the 310–320 nm range due to the presence of a coumarin ring; and alkaloids have a UV absorption maximum in the 330–340 nm range due to the presence of nitrogen atoms.35
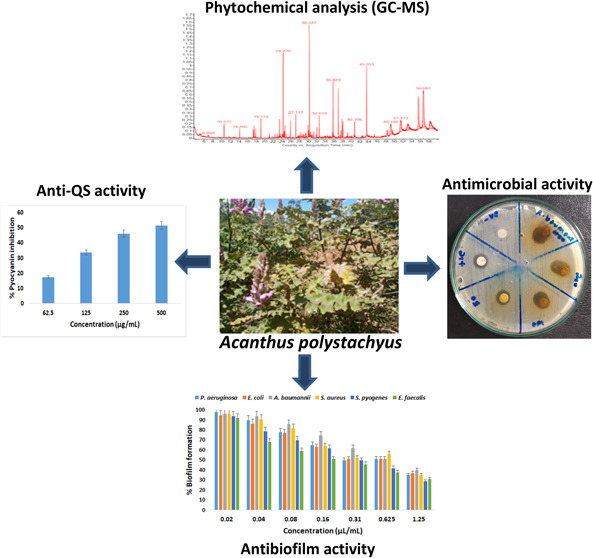
GC-MS is a helpful technique for the compositional analysis of phytochemicals in extracts. In the case of ME, GC-MS analysis was performed for 60 min that detected 79 compounds, while the runtime for EO was 33 min, and a total of 20 compounds was obtained. Some of the compounds appeared twice or more as multiple peaks in ME and EO, while a stationary phase was observed after 29 min in the case of EO. The chromatographic profiles for the extracts are shown in Figure 1.
Figure 1.

GC-MS chromatographic profile of ME (red) and EO (black) of A. polystachyus. The peaks indicate the major compounds, and the numbers above the peaks depict the retention time. The y-axis is for “intensity”.
The major compounds were identified based on the intensity of peaks that were generated in GC-MS chromatograms (Figure 1) and are summarized in Tables 1 (ME) and 2 (EO) (for the complete list of compounds, please see Tables S2 and S3). The peak areas were used to calculate the percent occurrence (amount) of the individual compounds. The major compounds found in ME were β-sitosterol acetate (16.06%), cholest-5-en-3-yl (9Z)-9-octadecenoate (9.54%), 1-dodecanol (7.57%), (S)-(E)-(−)-4-acetoxy-1-phenyl-2-dodecen-1-one (6.03%), neophytadiene (5.7%), (E)-2-nonadecene (3.9%), hexanol-4-D2 (2.92%), and decane (2.4%). Several of these compounds are potentially bioactive. β-Sitosterol, a phytosterol present naturally in the cells and membranes of plants, has been shown to have antibacterial and antioxidant activities with various applications;34,36−38 cholest-5-en-3-yl (9Z)-9-octadecenoate was found in the extracts that showed anticancer and antibacterial activities;26 1-dodecanol is a long-chain fatty acid with high potential as antibacterial (MIC, 8 μg/mL) and antimycobacterial agents;39,40 neophytadiene is a diterpenoid compound that possesses antimicrobial, anti-inflammatory, antibiofilm, and antioxidant properties;41,42 nonadecene, hexanol, and decane exhibit antibacterial activities.43−45 Most of the major compounds were identified from ME of A. polystachyus (seven out of eight), which has known bioactive functions. Thus, it may be expected that ME likely has the potential to exhibit bioactivity.
Table 1. Major Compounds Identified from the ME of A. polystachyus by GC-MS Analysisa.
| no. | formula | RT | compound name | amount (%) | chemical class |
|---|---|---|---|---|---|
| 1 | C31H52O2 | 56.697 | β-sitosterol acetate | 16.06 | sterol lipid |
| 2 | C45H78O2 | 55.564 | cholest-5-en-3-yl (9Z)-9-octadecenoate | 9.54 | ester |
| 3 | C12H26O | 30.347 | 1-dodecanol | 7.57 | alcohol |
| 4 | C20H28O3 | 51.473 | (S)-(E)-(−)-4-Acetoxy-1-phenyl-2-dodecen-1-one | 6.03 | ketone |
| 5 | C20H38 | 43.553 | neophytadiene | 5.70 | sesquiterpenoid |
| 6 | C19H38 | 35.823 | (E)-2-nonadecene | 3.90 | alkene |
| 7 | C6H12D2O | 3.167 | hexanol-4-D2 | 2.92 | alcohol |
| 8 | C10H22 | 10.577 | decane | 2.40 | alkane |
RT, retention time; percent amount was calculated from the peak area.
Table 2. Major Compounds Identified from the EO of A. polystachyus by GC-MS Analysisa.
| no. | formula | RT | compound name | amount (%) | chemical class |
|---|---|---|---|---|---|
| 1 | C18H38O | 25.201 | stearyl alcohol P721 | 25.38 | saturated fatty acid |
| 2 | C18H34O2 | 28.863 | cis-9-tetradecenoic acid, isobutyl ester | 22.95 | fatty acid ester |
| 3 | C18H34O2 | 28.511 | butyl 9-tetradecenoate | 10.62 | ester |
| 4 | C18H34O2 | 26.893 | 11,13-dimethyl-12-tetradecen-1-ol acetate | 10.14 | alcohol |
| 5 | C15H26O | 27.991 | ginsenol | 3.48 | sesquiterpenoid |
| 6 | C24H38O4 | 23.671 | diisooctyl phthalate @P1404 | 2.54 | benzoic acid ester |
RT, retention time; percent amount was calculated from the peak area.
The major compounds detected by GC-MS in EO were stearyl alcohol P721 (25.38%); cis-9-tetradecenoic acid, isobutyl ester (22.95%); butyl 9-tetradecenoate (10.62%); 11,13-dimethyl-12-tetradecen-1-ol acetate (10.14%); ginsenol (3.48%); and diisooctyl phthalate @P1404 (2.54%). Stearyl alcohol has varied uses such as pharmaceutical dispensing, cosmetic creams, perfumery, antifoam agents, resins, surface active agents, and lubricants. Stearyl alcohol possesses antioxidant and antibacterial activities.26,40
Cis-9-tetradecenoic acid has been reported for antibacterial, anti-inflammatory, and analgesic properties;46 butyl 9-tetradecenoate is reported for antibacterial activity;47 11,13-dimethyl-12-tetradecen-1-ol acetate is reported for the antimicrobial formulation of toothpaste;48 ginsenol is a sesquiterpenoid that shows fungistatic action;49 and diisooctyl phthalate is reported for antimicrobial and antioxidant activities.46,50 It is noteworthy that the chemical composition of A. polystachyus EO is different from the other EOs. The monoterpenes were not detected, and one sesquiterpenoid (ginsenol) was present along with saturated fatty acids, fatty acid esters, alcohols, phenols, and benzoic acid ester (Tables 2 and S3). In a previous study, the EO of Acanthus ilicifolius (Acanthaceae) was reported to contain alkanes, fatty acids, benzoic acid esters, alcohols, and alkenes.51 Our result agrees with these results. However, further characterizations are required to determine the components of the EO and ME of A. polystachyus using techniques such as high-performance liquid chromatography (HPLC) and nuclear magnetic resonance (NMR).
2.2. Antioxidant Activity
The antioxidation potential of ME and EO was tested by using the 2,2-diphenyl-1-picrylhydrazyl (DPPH) free-radical scavenging assay that is based on the principle of reduction of DPPH by hydrogen donors to diphenyl picrylhydrazine. Both ME and EO were found to show an effective range of radical scavenging at varying concentrations (125–1000 μg/mL; μL/mL for EO). The activities of ME and EO ranged from 48.3 to 84.2% radical scavenging activity (RSA) and 45.6 to 82%RSA, respectively (Table 3) with dose dependency. Ascorbic acid was used as a standard reference with the same concentrations and generated values of 90.3–96.7%RSA. The activity of ME and EO was found to be comparable with the standard ascorbic acid at higher concentrations. This may be attributed to the presence of compounds found in this study possessing antioxidation properties such as neophytadiene, β-sitosterol (ME) and diisooctyl phthalate (EO).36,41,46 Several studies have reported the antioxidant property of natural products of plants.52 The antioxidation property is beneficial in scavenging free radicals involved in several diseases and metabolic pathways and imparts immunoprotective, hepatoprotective, and neuroprotective effects.53
Table 3. Antioxidant Activity of ME and EO of A. polystachyusa.
| concentration (μg/mL) | ME (%RSA) | EO (%RSA) | standard (%RSA) |
|---|---|---|---|
| 125 | 48.3 | 45.6 | 90.5 |
| 250 | 65.7 | 61.3 | 91 |
| 500 | 76.5 | 71.6 | 92.4 |
| 1000 | 84.2 | 82 | 94.7 |
Standard, ascorbic acid. For EO, the concentration is in μL/mL.
2.3. Antimicrobial Activity
The antimicrobial potential of ME and EO was evaluated by using a Kirby–Bauer agar disc diffusion assay on six bacterial and one fungal species at various concentrations (50–400 mg/mL). The microorganisms were chosen based on their pathogenic relevance and AMR potential, including three Gram-negative bacteria, P. aeruginosa (ATCC 27853), E. coli (ATCC 25922), and A. baumannii (ATCC 19606); three Gram-positive bacteria, S. aureus (ATCC 25923), E. faecalis (ATCC 29212), and S. pyogenes (ATCC 12204); and one fungal strain, C. albicans (ATCC 10231). At the tested concentrations, both ME and EO inhibited all of the microbes with varying degrees of inhibition (Figure 2 and Tables 4 and 5). The antimicrobial assay with ME shown in Figure 2 indicates that both Gram-positive and Gram-negative bacteria were inhibited with dose dependency. Similarly, inhibition increased with increasing concentration in the case of C. albicans. The zone of inhibition (ZOI) was measured and is presented in Tables 4 (ME) and 5 (EO). Due to the differential behavior of microorganisms toward antibiotics, inhibition zones were normalized with control (%RI, relative inhibition). There was no apparent difference in the inhibition patterns between the Gram-positive and Gram-positive bacteria, indicating broad-spectrum inhibitory activity of the extracts. In Gram-positive representative bacteria, inhibition was observed in the 32.72–87.75% range, while in Gram-negative representative strains, a wide range of inhibition (39.2–130.2%) was observed (Table 4). Among the Gram-positive strains, at 400 mg/mL, S. aureus showed higher inhibitory values (87.7%) than E. faecalis (63.16%) and S. pyogenes (67.7%). S. aureus is known to exhibit greater resistance to antimicrobials;2 however, it showed higher susceptibility against ME here. An inhibition of 49% was observed in E. coli at 400 mg/mL; however, notably, higher inhibitory values were observed in the case of P. aeruginosa (100.3%) and A. baumannii (130.2%), which increased the inhibitory range. Gram-negative bacteria in general and P. aeruginosa and A. baumannii, in particular, have been known to exhibit higher resistance to antimicrobials and are categorized in the pathogen priority list (PPL) as “critical priority” by WHO.54 This is also evident from the lower ZOI of PC (gentamycin) in the case of P. aeruginosa (12.6 ± 0.33 mm) and A. baumannii (9.47 ± 0.56 mm), indicating higher resistance against commercial antibiotics compared with ZOI of E. coli (17.0 ± 0.57 mm) and other bacteria (19.0 ± 0.57–21.67 ± 1.20 mm) (Figure 2 and Table 4). However, interestingly, we found higher inhibition (susceptibility) values for ME in A. baumannii (130.2%) and P. aeruginosa (100.3%) (Table 4). This may be due to decreased resistance or higher susceptibility against ME. Thus, it emphasizes the antibacterial potency of ME as a new, valuable, yet cost-effective measure to deal with antimicrobial-resistant bacteria, thereby eliminating infections. A moderate range of inhibition (34.2–59%) was observed in the case of C. albicans, indicating antifungal activity of ME. The compounds listed in Table 1 from ME such as β-sitosterol, cholest-5-en-3-yl (9Z)-9-octadecenoate, 1-dodecanol, neophytadiene, (E)-2-nonadecene, hexanol-4-D2, and decane possess antimicrobial properties36−45 that appear to be responsible for the observed inhibition of the bacterial and fungal species.
Figure 2.

Antimicrobial activity of ME by the disk diffusion assay. Bacteria and fungi were treated with varying concentrations of ME (50–400 mg/mL) on discs. Gentamycin (10 μg/mL) was the positive control for bacteria and ketoconazole (30 μg/mL) for C. albicans. Negative control was 10% DMSO.
Table 4. Antimicrobial Activity of ME by Disc Diffusion Assaya.
| mean
inhibition zone (mm) ± SD and
% inhibition | |||||
|---|---|---|---|---|---|
| concentration(mg/mL) | |||||
| bacteria | +ve control | 50 (% RI) | 100 (% RI) | 200 (% RI) | 400 (% RI) |
| P. aeruginosa | 12.6 ± 0.33 | 8.0 ± 1.00 (63.5%) | 8.5 ± 1.33 (67.46%) | 9.3 ± 0.50 (74.05%) | 12.8 ± 0.33 (100.6%) |
| E. coli | 17.0 ± 0.57 | 6.6 ± 0.33 (39.2%) | 7.3 ± 0.33 (43.12%) | 7.3 ± 0.33 (43.12%) | 8.3 ± 0.33 (49%) |
| A. baumannii | 9.4 ± 0.56 | 7.3 ± 0.33 (77.4%) | 10.3 ± 0.66 (106.3%) | 10.7 ± 0.57 (111.93%) | 12.3 ± 0.33 (130.20%) |
| S. aureus | 19.3 ± 0.66 | 6.6 ± 0.33 (32.72%) | 9.0 ± 0.57 (43.10%) | 13.3 ± 0.88 (60.40%) | 18.6 ± 1.20 (87.75%) |
| S. pyogenes | 21.6 ± 1.20 | 8.3 ± 0.88 (38.4%) | 10.6 ± 0.88 (49.24%) | 13.6 ± 2.40 (63.08%) | 14.6 ± 2.33 (67.7%) |
| E. faecalis | 19.0 ± 0.57 | 7.6 ± 0.33 (40.3%) | 8.6 ± 0.66 (45.63%) | 10.0 ± 1.15 (52.63%) | 12.0 ± 1.15 (63.16%) |
| C. albicans | 25.3 ± 0.33 | 8.7 ± 0.33 (34.2%) | 10.3 ± 0.33 (40.78%) | 12.3 ± 0.33 (48.68%) | 15.0 ± 0.57 (59%) |
% RI, % relative inhibition; + ve control, positive control.
Table 5. Antimicrobial Activity of EO by Disc Diffusion Assaya.
| mean
inhibition zone (mm) ± SD and % inhibition | ||||
|---|---|---|---|---|
| concentration(μL/mL) | ||||
| bacteria | +ve control | 10 (%RI) | 20 (%RI) | 40 (%RI) |
| P. aeruginosa | 13.2 ± 0.50 | 6.9 ± 1.2 (52.2%) | 7.3 ± 1.1 (55.3%) | 9.6 ± 0.20 (72.7%) |
| E. coli | 16.4.0 ± 0.57 | 6.6 ± 0.66 (40.2%) | 7.5 ± 0.33 (45.7%) | 8.2 ± 0.50 (50.0%) |
| A. baumannii | 9.9 ± 0.85 | 6.8 ± 0.33 (68.7%) | 8.1 ± 0.26 (81.8%) | 8.9 ± 0.33 (89.8%) |
| S. aureus | 18.5 ± 0.33 | 6.3 ± 0.40 (34.0%) | 9.2 ± 0.60 (49.70%) | 13.7 ± 0.38 (74.0%) |
| S. pyogenes | 22.0 ± 1.35 | 8.5 ± 0.70 (38.6%) | 10.0 ± 0.33 (45.4%) | 13.9 ± 2.60 (63.18%) |
| E. faecalis | 19.6 ± 0.75 | 7.6 ± 0.20 (38.7%) | 8.7 ± 0.33 (44.38%) | 11.3 ± 1.00 (57.65%) |
| C. albicans | 22.7 ± 0.46 | 7.5 ± 0.50 (33.0%) | 9.4 ± 0.85 (41.4%) | 12.2 ± 0.20 (53.7%) |
% RI, % relative inhibition; + ve control, positive control.
The antimicrobial activity results of EO at different concentrations (10–40 μL/mL) are presented in Table 5. The EO inhibited Gram-positive (34–74%) and Gram-negative (40.2–89.8%) representative bacteria in general without any apparent difference. However, the inhibition intensity was less than that of ME (mentioned above). Among Gram-negative strains, E. coli was found to be the least susceptible (40.2–50%) and among Gram-positive, S. aureus showed the highest susceptibility (34–74%). The “critical priority” and “high priority” resistant strains, A. baumannii, P. aeruginosa, and S. aureus showed lesser resistance (or higher susceptibility) in the ranges of 34–74, 68.7–89.8, and 52.2–72.7%, respectively, than other strains. These results are similar to ME and emphasizes the importance of EO as an effective antimicrobial. The major compounds detected by GC-MS in EO summarized in Table 2 indicate the presence of bioactive compounds such as stearyl alcohol, cis-9-tetradecenoic acid, isobutyl ester, butyl 9-tetradecenoate, 11,13-dimethyl-12-tetradecen-1-ol acetate, and diisooctyl phthalate that demonstrated antibacterial activity and may be responsible for the achieved inhibition by EO.26,46−52C. albicans exhibited an inhibition range of 33–53.7%. Ginsenol is reported for the fungistatic property.51 Thus, ME and EO of A. polystachyus may be regarded as valuable for their potency against stringent and MDR bacterial strains, S. aureus, A. baumannii, and P. aeruginosa, in particular, and other pathogenic bacteria and fungus, in general, used in this study. In a previous report, an acetone extract of the capsule from Eucalyptus camaldulensis exhibited excellent antibacterial properties (140%) compared with controls against A. baumannii and E. coli and antifungal activity (96%) against Rhizopus stolonifer.(55)
2.4. Minimum Inhibitory Concentration (MIC) and Minimum Bactericidal or Fungicidal Concentration (MBC/MFC) of ME and EO
Determining the MIC, MBC, and MFC is necessary for evaluating the extracts for their cytotoxicity. The MIC is the lowest concentration of a substance needed to prevent the visible growth of a bacterium. At the same time, MBC/MFC is the lowest concentration required to kill the bacterium/fungus. Thus, the material’s effectiveness at low concentrations is important to determine its potential as antimicrobials. A tolerance test provides information about the potency of the test extracts, where lower values indicate bactericidal potential and higher values indicate bacteriostatic activity. The MIC/MBC/MFC assays were carried out for ME and EO; the results are presented in Table 6. The MIC values of ME against the tested microbes varied from 0.5 to 1.0 mg/mL and MBCs/MFCs from 2 to 4 mg/mL. E. coli recorded an MIC of 1 mg/mL, which was higher than other bacteria, indicating higher resistance. Similar resistance patterns were observed in the antibacterial assay for E. coli (Figure 2 and Table 4). There was no other apparent difference observed among the strains, and it indicated the broad-spectrum activity of the extracts. Tolerance test values calculated as MBC/MIC (for bacteria) and MFC/MIC (for fungi) were between 4 and 8. The values of <4 indicate bactericidal activity, while a value of 8 indicates bacteriostatic action. The strains A. baumannii, E. faecalis, and C. albicans recorded a value of 8, indicating bacteriostatic/fungistatic activity, while all others scored 4 indicating bactericidal potential of ME and EO. In a previous report that tested ME of A. polystachyus, MICs ranged from 100 to 200 mg/mL (for bacteria and C. albicans) and MBCs from 200 to 400 mg/mL for bacteria.32 These values are 100–400 times higher than those found in this study. This may be attributable to the cultivation, environmental, and geographical factors, including soil structure.33 In another study that used the acetone extract of E. camaldulensis, MIC values of 18–20 mg/mL were reported for A. baumannii and E. coli that showed a 140% inhibitory activity in the antibacterial assay. The values obtained in our study are lower than in this report.55 Several other plant species‘ ME have been used to explore the antibacterial activity.56 The values observed here are either comparable to or better than those reported.
Table 6. MIC, MBC, MFC, MBC/MIC, MFC/MIC, and MBIC of ME and EO of A. polystachyusa.
| Bacteria | MIC (mg/mL) | MBC (mg/mL) | MFC (mg/mL) | MBC/MIC | MFC/MIC | MBIC (mg/mL) | |
|---|---|---|---|---|---|---|---|
| ME | P. aeruginosa | 0.5 | 2 | 4 | 0.5 | ||
| E. coli | 1 | 4 | 4 | 1 | |||
| A. baumannii | 0.5 | 4 | 8 | 0.5 | |||
| S. aureus | 0.5 | 2 | 4 | 0.5 | |||
| S. pyogenes | 0.5 | 2 | 4 | 0.5 | |||
| E. faecalis | 0.5 | 4 | 8 | 0.5 | |||
| C. albicans | 0.5 | 4 | 8 | ||||
| EO | P. aeruginosa | 0.62 | 2.5 | 4 | 0.62 | ||
| E. coli | 0.31 | 1.25 | 4 | 0.31 | |||
| A. baumannii | 0.31 | 1.25 | 4 | 0.31 | |||
| S. aureus | 0.31 | 1.25 | 4 | 0.31 | |||
| S. pyogenes | 0.31 | 1.25 | 4 | 0.31 | |||
| E. faecalis | 0.31 | 1.25 | 4 | 0.31 | |||
| C. albicans | 0.62 | 2.5 | 4 |
ME, methanol extract; EO, essential oil; EO values are in μL/mL; MIC, minimum inhibitory concentration; MBC, minimum bactericidal concentration; MFC, minimum fungicidal concentration; MBC/MIC, tolerance values for bacteria; MFC/MIC, tolerance values for fungi; MBIC, minimum biofilm inhibitory concentration (MBIC). The values are from three independent experiments (P < 0.05).
The MIC values of EO for the tested microbes varied from 0.31 to 0.62 μL/mL and MBCs/MFCs from 1.25 to 2.5 μL/mL. P. aeruginosa and C. albicans showed higher values (MIC of 0.62 μL/mL and MBC/MFC of 2.5 μL/mL), indicating higher resistance. All strains scored tolerance test values of 4, indicating EO‘s bactericidal/fungicidal activity. EO of several plant species have been investigated, and a wide range of MIC/MBC/MFC have been reported.57,58 A recent report observed MICs of 50–100 μL/mL for some similar bacterial species used in this study and 6.25 μL/mL for C. albicans, which are much higher than found here.57 In another study, a wide range of MICs were reported from 0.2 to 12.5 μL/mL against bacterial and fungal strains.58 Our results are comparable to the lower range of this report. These results confirm the antimicrobial potential of the EO of A. polystachyus and may prove valuable against pathogenic and resistant microbial species.
2.5. Antibiofilm Activity and Minimum Biofilm Inhibition Concentration (MBIC) of ME and EO
Microbes develop resistance when challenged by conventional antimicrobials, leading to the impaired treatment of diseases. The resistance is most commonly associated with forming biofilms that protect microbes from surrounding environmental stresses, impede phagocytosis, and confer the capacity for colonization and long-term persistence. Such an ability is promoted by effective cell-to-cell communications (quorum sensing) within the microbial communities. As a result, highly structured biofilms can be formed and often identified in patients with chronic infections, such as chronic lung and wound infections. Therefore, exploring new sources with pharmaceutical properties that can interfere with, reduce, and eradicate biofilms for the effective treatment of such diseases is essential. The ME and EO of A. polystachyus were investigated for their ability to reduce biofilm formation. The results are shown in Figure 3 and Table 6. Both ME and EO were effective and showed dose-dependent inhibition of biofilm formation, with MBIC values in the range of 0.5–1 mg/mL (ME) and 0.31–0.62 μL/mL, respectively. The Gram-negative representative bacteria were more resistant to the biofilm inhibitory effect of ME and EO than Gram-positive strains. At the highest concentration, 1 mg/mL of ME, the biofilm inhibitory effect was in the following order: E. faecalis > S. pyogenes > S. aureus > A. baumannii > E. coli > P. aeruginosa. In the case of EO, the following order was observed: S. pyogenes > E. faecalis > S. aureus > P. aeruginosa > E. coli > A. baumannii. The reduction of the biofilm formation ability of microbes has been reported to vary across an extensive range (0.125–100 mg/mL). Our results agree with the reported MBIC values of ME of different plant species in the 0.25–1.0 mg/mL range.59,60 Similarly, a wide range of MBICs for EO have been reported in the range of 2–861 and 50–100 μL/mL.57 Our results show better efficacy of EO with lower MBIC values.
Figure 3.

Antibiofilm assay of ME and EO. The biofilm formation ability of bacteria was tested by using different concentrations of ME (left) and EO (right). The %biofilm formation was inhibited by increasing the extract concentrations in a dose-dependent manner. Values are from three independent experiments (P < 0.05).
The biofilm-forming microbes are difficult to treat with conventional antimicrobials and can resist up to 1000-folds, thus increasing the cost of treatment. These microbial populations may further aggravate the AMR problem by the transfer of resistance genes to other populations.4,5 Therefore, targeting the inhibition of biofilm formation is a plausible direction to reduce and possibly eradicate biofilm-forming pathogens. Therefore, further extensive investigations are required to establish the effectiveness of antibiofilm extracts or compounds. Possible directions would be to isolate individual components of extracts and rigorously assess the potential of single compounds or synergy combinations.
2.6. Antiquorum Sensing Activity of ME and EO
Pyocyanin is a pigment distinctive to P. aeruginosa and plays a crucial role in infection and virulence. There is also a favorable relationship between pyocyanin and antibiotic resistance, thus empowering P. aeruginosa for AMR.62 Pyocyanin inhibition assay (PIA) is commonly employed to evaluate quorum sensing (QS) in the model bacteria, P. aeruginosa.63 In this study, we evaluated the anti-QS potential of ME on P. aeruginosa by using PIA. The inhibition of pyocyanin production was in the range of 17.4–51.6%, indicating the effective inhibition of pyocyanin (Figure 4). The highest inhibition (51.6%) was at 500 μg/mL. Pejin et al. reported that at 0.5MIC (MIC, 19 μg/mL), phytol inhibited pyocyanin production by 51.94%.63 Phytol was used as a purified single compound, and the 0.5MIC value (9.5 μg/mL) is much lower than our result (500 μg/mL), which contains a mixture of several compounds. However, in future studies, purification and identification of the individual compounds responsible for pyocyanin inhibition may be pursued. In another study, at 750 μg/mL, four different extracts of Camellia nitidissima inhibited pyocyanin production in the 51.25–67.5% range.62 Our results agree with those in this report. Thus, ME demonstrated pyocyanin inhibitory potential and showed promise to be further investigated.
Figure 4.

Pyocyanin inhibition assay of ME. P. aeruginosa was treated with various concentrations of ME (62.5–500 μg/mL). A dose-dependent inhibitory activity of ME was observed in the inhibition of pyocyanin production. Values are from three independent experiments (P < 0.05).
3. Conclusions
Plant natural products rich in phytochemicals are unfolding as possible solutions to combat pathogenic and resistant microbes. In this study, we explored A. polystachyus for its potential as an antioxidant and antimicrobial against selected bacterial and fungal species. The phytochemical composition of extracts by GC-MS revealed bioactive compounds. The antioxidant property was found in both ME and EO by the DPPH assay. The ME exhibited high inhibition for the “critical priority” and “high priority” strains, A. baumannii, P. aeruginosa, and S. aureus (87.75–130.20% inhibition). The EO also showed potential inhibition for the same strains in the range of 72.7–89.8%. The MIC (0.5–1 mg/mL; 0.31–0.62 μL/mL), MBC/MFC (2–4 mg/mL; 1.25–2.5 μL/mL), and MBIC (0.5–1 mg/mL; 0.31–0.62 μL/mL) values of ME and EO confirmed the inhibition potential as well as the inhibition of biofilm formation. Pyocyanin, an important factor in antibiotic resistance, virulence, and QS, was also inhibited by ME in the anti-QS assay using P. aeruginosa (51.6%, 0.5 mg/mL). Thus, ME and EO extracted from A. polystachyus leaves have high potency and are valuable as antioxidants and antimicrobials. This study explored and established the phytochemical composition of A. polystachyus extracts and unveiled the potential antimicrobial properties that may prove useful to reduce the microbial population load and combat pathogenic and resistant microbes.
4. Experimental Section
4.1. Chemicals, Reagents, and Instruments
A UV spectrophotometer (Optizen 2120UV, Mecasys Co. Ltd., Daegeon, South Korea), an incubator (ThermoStable SIR-250, Daihan Scientific Co. Ltd., Gangwon-do, South Korea), a rotary evaporator (RE-501, Henan Lanphan Technology Co. Ltd., Henan, China), and a microplate reader (PLATE READER, 8 Channel ELISA Photometer, DAS Italy SRL, Rome, Italy) were used for experiments.
All chemicals and reagents were of analytical grade. Muller–Hinton, potato dextrose, agar, and ketoconazole were from HiMedia Laboratories Pvt. Ltd., Mumbai, India; LB media (Bio Basic Inc., Ontario, Canada), gentamycin (Merck, Darmstadt, Germany); anhydrous sodium sulfate, 99% methanol, chloroform, Molisch’s reagent, and ferric chloride (Loba Chemie Pvt. Ltd., Mumbai, India); hydrochloric acid and sulfuric acid (CARLO ERBA Reagents S.A.S, Milano, Italy); ascorbic acid, DMSO, crystal violet (Sisco Research Laboratories Pvt. Ltd., Mumbai, India); and DPPH and Wagner reagent (Otto Chemie Pvt. Ltd., Mumbai, India).
4.2. Plant Material and Preparation of Extracts
The plant leaves of A. polystachyus were collected in early February (2023) from the Dilla University Botanical and Ecotourism Garden, which is located in the Southern Nations, Nationalities, and People’s Region (SNNPR), Gedio Zone, Ethiopia. Dilla has a longitude and latitude of 6°24′30″N and 38°18′30″E, with an elevation of 1570 m above sea level, respectively. The plant material was authenticated by a Botanist, Mr. Ato Melaku Wondafrash, and a voucher specimen (Voucher No: HG001) was deposited at the National Herbarium, Department of Botany, Addis Ababa University, Addis Ababa, Ethiopia.
The leaves of A. polystachyus were washed with distilled water to remove the dirt and dried at room temperature without sunlight. The dried leaves were coarsely ground into powder by the electrical mill. Then, the powder of the plant material was mixed with 99% methanol at 1:5 (w/v) and macerated for 72 h with occasional shaking. The macerated mixture was filtered by Whatman filter paper No. 1. The residue was macerated for the second time with a fresh solvent for a total of 6 d to obtain a better yield. The filtrate of the plant material was concentrated in a rotary evaporator at 40 °C. The dried extract was stored in a refrigerator. The yield was 20.5%.
The percentage yield was calculated by
| 1 |
W1 is the plant extract obtained, and W2 is the weight of the plant sample before extraction.
The EO from leaves of A. polystachyus was extracted by hydrodistillation in a Clevenger apparatus. A 316 g amount of powder from leaves was extracted in 1000 mL of distilled water using hydrodistillation for 3 h. The water layer at the bottom was drained to separate the oil. The oil layer was treated with anhydrous sodium sulfate (Na2SO4) to remove the remaining trace water. The obtained EO was protected from light and stored at 4 °C throughout the experiments.64 The final yield was 0.4% (0.2 mL/100 g of dry matter).
4.3. Phytochemical Analysis
4.3.1. Test for Alkaloids
1 mL of plant extract filtrate was treated with 2–3 drops of Wagner reagent, and a yellow color formation was observed.65
4.3.2. Test for Flavonoids
The plant extract (2 mL) was mixed with a few fragments of magnesium ribbon, followed by the dropwise addition of 5% concentrated HCl. The appearance of pink scarlet was observed after 2 min to indicate the presence and absence of flavonoids.66
4.3.3. Test for Phenols
1 mL of the plant extract filtrate was taken in a test tube, and 1–2 drops of iron III chloride (FeCl3) was added. The color change of the mixture was observed after a few min.67
4.3.4. Test for Saponins
The filtrate of the plant extract (1 mL) was diluted with 5 mL of distilled water in a test tube. It was shaken by hand for 15 min. A foam layer on top of the test tube indicated the presence of saponins.66
4.3.5. Test for Steroids
The plant extract filtrate (1 mL) was dissolved in 1 mL of chloroform in a test tube. Then, 1 mL of acetic anhydride and two drops of concentrated sulfuric acid were added to the test tube by the sides. The upper layer in the test tube turned red, indicating the presence of steroids.68
4.3.6. Test for Tannins
The plant extract filtrate (2 mL) was taken, and then a few drops of 10% ferric chloride solution were added to the filtrate. The blue-green color appearance indicates the presence of tannins in the sample.67
4.3.7. Test for Terpenoids
The plant extract filtrate (1 mL) was placed in a test tube and dissolved in chloroform (1 mL). The concentrated sulfuric acid (2 drops) was placed in the test tube and shaken. The lower yellow color indicates the presence of terpenoids.69
4.3.8. Test for Glycosides
To 2 mL of extract were added two drops of Molisch’s reagent and shaken well. Then, 2 mL of concentrated H2SO4 was added to the sides of the test tube. A reddish-violet ring immediately appeared at the junction of two layers, indicating the presence of carbohydrates.67
4.4. Phytochemical Screening of A. polystachyus EO
The phytochemical screening of A. polystachyus EO was performed by UV spectrophotometry. 100 μL of oil was diluted with 3 mL of chloroform, and UV spectra were recorded in the range of 200 nm −400 nm for determining natural compounds.70 Terpenes have a UV absorption maximum in the 210–220 nm range. Phenols have a UV absorption maximum in the 270–280 nm range. Flavonoids have a UV absorption maximum in the 290–300 nm range. Coumarins have a UV absorption maximum in the 310–320 nm range. Alkaloids have a UV absorption maximum in the 330–340 nm range.35
4.5. Gas Chromatography-Mass Spectra (GC-MS) Analysis
GC-MS analysis of plant extracts was performed by a GC (7890B, Agilent Technologies) coupled with an MS (5977A Network, Agilent Technologies). The GC had an HP-5MS column (30 m × 0.25 mm internal diameter (i.d.) and 0.25 μm film thickness). Helium was used as a carrier gas with a 4 min solvent delay and a splitless injection/purge time of 1.0 min with different flow rates and runtime. In the case of methanol extract, the temperature increase was 110–330 °C, the flow rate was 1.2 mL/min, and the runtime was 60 min. For EO, the temperature increase was 100–280 °C, the flow rate was 1 mL/min, and the runtime was 33 min.
Mass spectra were recorded in an electron-impact mode, with an ionization energy of mode at 70 eV, scanning the 33–550 m/z range.71 The volatile compounds in the oil were identified by comparing the mass spectra of the compounds in oils with those in the database of the NIST11 GC-MS libraries.72
4.6. Antioxidant Activities
The antioxidant activity test was performed by using the DPPH free-radical scavenging assay.73 A 0.1 mM DPPH solution was prepared in methanol and kept in the dark for 30 min to complete the reaction. The ME dilutions were prepared at 1000, 500, 250, and 125 μg/mL. The same concentrations of ascorbic acid were used as a standard, and the sample-free DPPH solution was used as a negative control. After mixing 1 mL of DPPH solution with 3 mL of prepared samples, the mixture was incubated at room temperature in a dark place for 30 min, and the absorbance was measured at 517 nm. The assay for EO was similarly performed in microtiter plates except that the volumes were reduced. The %RSA was calculated according to the following formula
| 2 |
where %RSA is the percent radical scavenging activity, A0 is the absorbance of the blank DPPH, and A1 is the absorbance of sample.20,73
4.7. Antibacterial Activity
The antibacterial activity of the extracts was tested using the standard Kirby–Bauer agar disc diffusion assay and various concentrations of the extracts. The test microorganisms included six pathogenic bacterial strains (three Gram-positive and three Gram-negative) and one fungal strain known to possess antimicrobial resistance: P. aeruginosa (ATCC 27853), E. coli (ATCC 25922), A. baumannii (ATCC 19606), S. aureus (ATCC 25923), E. faecalis (ATCC 29212), S. pyogenes (ATCC 12204), and C. albicans (ATCC 10231). The ME dilutions were prepared at 400, 200, 100, and 50 mg/mL by dissolving in 10% DMSO. The EO was prepared in three dilutions of 40, 20, and 10 μL/mL by dissolving in 10% DMSO. First, all of the stock-cultured bacteria were activated on Muller–Hinton (MH) and C. albicans on potato dextrose (PD) agar plates. After activation, the cultures were subjected to inocula development by inoculating a loop full of cells from a single colony into MH/PD broth and incubated for 24 h at 37 and 48 h at 30 °C for C. albicans. The active pure bacterial/fungal cultures and subcultures were maintained according to the 0.5 McFarland standards to obtain 1.5 × 10⁸ colony-forming units (CFUs/mL) for bacteria and 1 × 10⁶ (CFU/mL) for C. albicans. This process was repeated every time before a new experiment. The fresh overnight cultures of each strain were swabbed uniformly over sterilized and cooled MH/PD agar medium Petri dishes. Then, 6 mm diameter sterile discs impregnated with different concentrations of ME and EO were placed onto these plates, soaked for 30 min, and incubated for 24 h at 37 °C for bacteria and 48 h at 30 °C for C. albicans. Discs impregnated with gentamycin solution (10 μg/mL), ketoconazole (30 μg/mL), and 10% DMSO were used as positive and negative controls. After incubation, the antimicrobial activity was determined by measuring the diameter of the zone of inhibition. The antibacterial/antifungal activity was normalized and calculated in terms of percentage relative inhibition (%RI) by the following formula: %RI = diameter of sample/diameter of control ×100.
4.8. MIC, MBC, and MFC
The bacterial/fungal growth was assessed by a broth dilution method. The ME was diluted in 10% DMSO, and the diluted extracts (100 μL) were introduced into 10 mL of LB broth (PD for C. albicans) to achieve the concentrations of 1 mg/mL, 500 μg/mL, 250 μg/mL, and 125 μg/mL. Inoculum (100 μL) was added from the McFarland standard calibrated broth (5 × 10⁶ CFU/mL for bacteria and 1 × 10⁴ for C. albicans) to each test tube and grown for 24 h at 37 °C and 48 h at 30 °C for C. albicans. Due to the presence of colored pigments, it was difficult to measure the absorbance of the culture. So, we adopted a plate assay, where 20 μL of the above mixture was spread on MH/PD agar plates and incubated overnight at 37 °C and 48 h at 30 °C for C. albicans. The gradual disappearance of colonies with increasing concentrations was observed visually and recorded. MIC was determined as the lowest concentration of extract that inhibited the visible growth of colonies of the organism.42 MBCs and MFCs of the extract for different microorganisms were deduced from the lowest concentration of the total inhibition of bacteria/C. albicans on the respective media agar.74
For EO, the growth assay was performed using the broth microdilution method in a 96-well microtiter plate. A 20 μL/mL stock solution was prepared in an LB/PD broth. The concentrations were varied from 0.02 to 2.5 μL/mL in a final volume of 200 μL. Ten μL of the McFarland-calibrated (5 × 10⁶ CFU/mL for bacteria and 1 × 10⁴ for C. albicans) inoculum was added to each well and grown for 24 h at 37 °C for bacteria and 48 h at 30 °C for C. albicans. The plate assay for the determination of the MIC was performed as mentioned above. The determination of MBC and MFC was also as above.
4.9. Antibiofilm Assay
The antibiofilm assay was performed only for bacteria according to Raut et al. with minor modifications.75 The varying concentrations starting from MIC to sub-MIC (500–62.5 μg/mL for methanol extract and 0.02–1.25 μg/mL for EO) were mixed with bacterial culture media at an initial turbidity of 0.05 (5 × 10⁵ CFU/mL). The assays were performed in a 96-well microtiter plate for EO and 10 mL test tubes for ME as mentioned above. The mixtures were incubated for 48 h at 37 °C. The planktonic cells were removed by gentle washing with sterile phosphate-buffered saline (PBS), and then the adherent cells were stained with 1% crystal violet (CV) for 10 min and washed with PBS to remove the excess stain. After air drying, CV bound to biofilm was solubilized with 33% glacial acetic acid.75 Using similar procedures, a control without any treatment was set for comparison to quantify the adherent cells, and the CV solution’s absorbance was measured by a UV spectrophotometer at OD590.
The percent biofilm formation was calculated by
| 3 |
Minimum biofilm inhibitory concentration (MBIC) was determined by the inhibition of a minimum of 50% biofilm formation.75
4.10. Anti-QS Assay: Pyocyanin Inhibition Assay
Varying dilutions (sub-MIC) of plant extracts were added to the planktonic cultures (6 mL) of P. aeruginosa and incubated for 24 h at 37 °C. Then, 2 mL of chloroform was added and centrifuged at 5,000 g for 5 min. The organic layer was separated and solubilized in 2 mL of 0.2 M HCl. The absorbance of each supernatant was measured at 520 nm. Control without treatment was set as 100%, and distilled water with HCl was used as a blank.76
The inhibition percentage was calculated as follows
| 4 |
4.11. Statistical Analysis
Three replicates’ means ± standard deviation (SD) represented the experimental results. Statistical significance was determined by P values less than 0.05. Microsoft Excel 2010 SPSS statistical software was utilized for all analyses.
Acknowledgments
The authors acknowledge the Departments of Applied Biology, Chemistry, and Institute of Pharmaceutical Science for support and Adama Science and Technology University for providing funds.
Glossary
List of Abbreviations
- AMR
antimicrobial resistance
- MDR
multidrug resistance
- GC-MS
gas chromatography-mass spectroscopy
- ME
methanol extract
- EO
essential oil
- RI
relative inhibition
- MIC
minimum inhibitory concentration
- MBC
minimum bactericidal concentration
- MFC
minimum fungicidal concentration
- MBIC
minimum biofilm inhibitory concentration
- QS
quorum sensing
- EPS
extracellular polymeric substances
- eDNA
extracellular DNA
- AHL
N-acylhomoserine lactone
- AIP
autoinducing peptide
- AMPs
antimicrobial peptides
- DPPH
diphenyl picrylhydrazine
- RSA
radical scavenging activity
- ZOI
zone of inhibition
- PPL
pathogen priority list
- PIA
pyocyanin inhibition assay
- MH
Muller–Hinton
- PD
potato dextrose
- CFUs
colony-forming units
- CV
crystal violet
Supporting Information Available
The Supporting Information is available free of charge at https://pubs.acs.org/doi/10.1021/acsomega.3c06246
Phytochemical screening of methanol extract of A. polystachyus (Table S1); methanol extract constituents of A. polystachyus by GC-MS (Table S2); and essential oil constituents of A. polystachyus by GC-MS (Table S3) (PDF)
Author Contributions
⊥ M.G. and Y.N. contributed equally. Writing—original draft and laboratory work were carried out by M.G., Y.N., and M.A. GC-MS experiments were performed by K.S. Writing—review and editing was done by S.S., N.G., and M.N. Advising was done by M.N. All authors read the final manuscript in detail and approved it.
The authors declare no competing financial interest.
Supplementary Material
References
- Hugo W. B.; Russell A. D.. Types of Antibiotics and Synthetic Antimicrobial Agents. In Pharmaceutical Microbiology, 6th ed.; Blackwell Science: Oxford, UK, 1998, ISBN 0-632-06467-6. [Google Scholar]
- Walesch S.; Birkelbach J.; Jézéquel G.; Haeckl F. P. J.; Hegemann J. D.; Hesterkamp T.; Hirsch A. K. H.; Hammann P.; Müller R. Fighting Antibiotic Resistance-Strategies and (Pre)clinical Developments to Find New Antibacterials. EMBO Rep. 2023, 24 (1), 56033 10.15252/embr.202256033. [DOI] [PMC free article] [PubMed] [Google Scholar]
- Jones K. E.; Patel N. G.; Levy M. A.; Storeygard A.; Balk D.; Gittleman J. L.; Daszak P. Global Trends in Emerging Infectious Diseases. Nature 2008, 451, 990–993. 10.1038/nature06536. [DOI] [PMC free article] [PubMed] [Google Scholar]
- Bengtsson-Palme J.; Kristiansson E.; Larsson D. J. Environmental Factors Influencing the Development and Spread of Antibiotic Resistance. FEMS Microbiol. Rev. 2018, 42, fux053 10.1093/femsre/fux053. [DOI] [PMC free article] [PubMed] [Google Scholar]
- De Oliveira D. M. P.; Forde B. M.; Kidd T. J.; Harris P. N. A.; Schembri M. A.; Beatson S. A.; Paterson D. L.; W M. Antimicrobial Resistance in ESKAPE Pathogens. Clin Microbiol Rev. 2020, 33, e0018 10.1128/CMR.00181-19. [DOI] [PMC free article] [PubMed] [Google Scholar]
- Mulani M. S.; Kamble E. E.; Kumkar S. N.; Tawre M. S.; P K. Emerging Strategies to Combat ESKAPE Pathogens in the Era of Antimicrobial Resistance: A Review. Front. Microbiol. 2019, 10, 539 10.3389/fmicb.2019.00539. [DOI] [PMC free article] [PubMed] [Google Scholar]
- Deleo F. R.; Chambers H. F. Reemergence of Antibiotic-Resistant Staphylococcus aureus in the Genomics Era. J. Clin. Invest. 2009, 119 (9), 2464–2474. 10.1172/JCI38226. [DOI] [PMC free article] [PubMed] [Google Scholar]
- Lye D. C.; Earnest A.; Ling M. L.; Lee T.-E.; Yong H.-C.; Fisher D. A.; Krishnan P.; Hsu L.-Y. The Impact of Multidrug Resistance in Healthcare-Associated and Nosocomial Gram-Negative Bacteraemia on Mortality and Length of Stay: Cohort Study. Clin. Microbiol. Infect. 2012, 18 (5), 502–508. 10.1111/j.1469-0691.2011.03606.x. [DOI] [PubMed] [Google Scholar]
- Mukherjee S.; Bassler B. B. Bacterial Quorum Sensing in Complex and Dynamically Changing Environments. Nat. Rev. Microbiol 2019, 17 (6), 371–382. 10.1038/s41579-019-0186-5. [DOI] [PMC free article] [PubMed] [Google Scholar]
- Branda S. S.; Vik S.; Friedman L.; Kolter R. Biofilms: The Matrix Revisited. Trends Microbiol. 2005, 13 (3), 20–26. 10.1016/j.tim.2004.11.006. [DOI] [PubMed] [Google Scholar]
- Zhou L.; Zhang Y.; Ge Y.; Z X.; P J. Regulatory Mechanisms and Promising Applications of Quorum Sensing-Inhibiting Agents in Control of Bacterial Biofilm Formation. Front. Microbiol. 2020, 11, 589–640. 10.3389/fmicb.2020.589640. [DOI] [PMC free article] [PubMed] [Google Scholar]
- Di Martino P. Extracellular Polymeric Substances, a Key Element in Understanding Biofilm Phenotype. AIMS Microbiol. 2018, 4, 274–288. 10.3934/microbiol.2018.2.274. [DOI] [PMC free article] [PubMed] [Google Scholar]
- Høiby N.; Bjarnsholt T.; Givskov M.; Molin S.; Ciofu O. Antibiotic Resistance of Bacterial Biofilms. Int. J. Antimicrob. Agents 2010, 35 (4), 322–332. 10.1016/j.ijantimicag.2009.12.011. [DOI] [PubMed] [Google Scholar]
- Khan F.; Lee J. W.; Javaid A.; Park S. K.; Kim Y. M. Inhibition of Biofilm and Virulence Properties of Pseudomonas aeruginosa by Sub-inhibitory Concentrations of Aminoglycosides. Microb. Pathog. 2020, 146, 104249 10.1016/j.micpath.2020.104249. [DOI] [PubMed] [Google Scholar]
- Magana M.; Sereti C.; Ioannidis A.; Mitchell C. A.; Ball A. R.; Magiorkinis E.; Tegos G. P.; et al. Options and Limitations in Clinical Investigation of Bacterial Biofilms. Clin. Microbiol. Rev. 2018, 31 (3), e00084-16 10.1128/cmr.00084-16. [DOI] [PMC free article] [PubMed] [Google Scholar]
- Simoes M. Antimicrobial Strategies Effective against Infectious Bacterial Biofilms. Curr. Med. Chem. 2011, 18 (14), 2129–2145. 10.2174/092986711795656216. [DOI] [PubMed] [Google Scholar]
- Rutherford S. T.; Bassler B. L. Bacterial Quorum Sensing: Its Role in Virulence and Possibilities for Its Control. Cold Spring Harbor Perspect. Med. 2012, 2 (11), a012427 10.1101/cshperspect.a012427. [DOI] [PMC free article] [PubMed] [Google Scholar]
- Hamde F.; Dinka H.; Naimuddin M. In Silico Analysis of Promoter Regions to Identify Regulatory Elements in TetR Family Transcriptional Regulatory Genes of Mycobacterium colombiense CECT 3035. J. Genet. Eng. Biotechnol. 2022, 20 (1), 53 10.1186/s43141-022-00331-6. [DOI] [PMC free article] [PubMed] [Google Scholar]
- Deryabin D.; Galadzhieva A.; Kosyan D.; Duskaev G. Plant-Derived Inhibitors of AHL-Mediated Quorum Sensing in Bacteria: Modes of Action. Int. J. Mol. Sci. 2019, 20 (22), 5588. 10.3390/ijms20225588. [DOI] [PMC free article] [PubMed] [Google Scholar]
- Mengistu A.; Naimuddin M.; Abebe B. Optically Amended Biosynthesized Crystalline Copper-Doped ZnO for Enhanced Antibacterial Activity. RSC Adv. 2023, 13, 24835. 10.1039/d3ra04488b. [DOI] [PMC free article] [PubMed] [Google Scholar]
- Atanasov A. G.; Zotchev S. B.; Dirsch V. M.; Supuran C. T. Natural Products in Drug Discovery: Advances and Opportunities. Nat. Rev. Drug Discovery 2021, 20 (3), 200–216. 10.1038/s41573-020-00114-z. [DOI] [PMC free article] [PubMed] [Google Scholar]
- Trentin D. S.; Silva D. B.; Amaral M. W.; Zimmer K. R.; Silva M. V.; Lopes N. P.; Giordani R. B.; Macedo A. J. Tannins Possessing Bacteriostatic Effect Impair Pseudomonas aeruginosa Adhesion and Biofilm Formation. PLoS One 2013, 8 (6), e66257 10.1371/journal.pone.0066257. [DOI] [PMC free article] [PubMed] [Google Scholar]
- Hernández N. E.; Tereschuk M. L.; Abdala L. R. Antimicrobial Activity of Flavonoids in Medicinal Plants from Tafí del Valle (Tucumán, Argentina). J. Ethnopharmacol. 2000, 73 (1–2), 317–322. 10.1016/S0378-8741(00)00295-6. [DOI] [PubMed] [Google Scholar]
- Zablotowicz R. M.; Hoagland R. E.; Wagner S. C. Effect of Saponins on the Growth and Activity of Rhizosphere Bacteria. Adv. Exp. Med. Biol. 1996, 405, 83–95. 10.1007/978-1-4613-0413-5_8. [DOI] [PubMed] [Google Scholar]
- Cowan M. M. Plant Products as Antimicrobial Agents. Clin. Microbiol. Rev. 1999, 12 (4), 564–582. 10.1128/CMR.12.4.564. [DOI] [PMC free article] [PubMed] [Google Scholar]
- Casillas-Vargas G.; Ocasio-Malavé C.; Medina S.; Morales-Guzmán C.; Del Valle R. G.; Carballeira N. M.; Sanabria-Ríos D. J. Antibacterial Fatty Acids: An Update of Possible Mechanisms of Action and Implications in the Development of the Next-Generation of Antibacterial Agents. Prog. Lipid Res. 2021, 82, 101093 10.1016/j.plipres.2021.101093. [DOI] [PMC free article] [PubMed] [Google Scholar]
- Epand R. F.; Savage P. B.; Epand R. M. Bacterial Lipid Composition and the Antimicrobial Efficacy of Cationic Steroid Compounds (Ceragenins). Biochim. Biophys. Acta, Biomembr. 2007, 1768 (10), 2500–2509. 10.1016/j.bbamem.2007.05.023. [DOI] [PubMed] [Google Scholar]
- Demilew W.; Adinew G. M.; Asrade S. Evaluation of the Wound Healing Activity of the Crude Extract of Leaves of Acanthus polystachyus Delile (Acanthaceae). Evidence-Based Complementary Altern. Med. 2018, 2018, 1–9. 10.1155/2018/2047896. [DOI] [PMC free article] [PubMed] [Google Scholar]
- Olatunji O. J.; Olatunde O. O.; Jayeoye T. J.; Singh S.; Nalinbenjapun S.; Sripetthong S.; Chunglok W.; Ovatlarnporn C. New Insights on Acanthus ebracteatus Vahl: UPLC-ESI-QTOF-MS Profile, Antioxidant, Antimicrobial and Anticancer Activities. Molecules 2022, 27, 1981 10.3390/molecules27061981. [DOI] [PMC free article] [PubMed] [Google Scholar]
- Okoli C. O.; Akah P. A.; Onuoha N. J.; Okoye T. C.; Nwoye A. C.; Nworu C. S. Acanthus montanus: An Experimental Evaluation of the Antimicrobial, Anti-inflammatory, and Immunological Properties of a Traditional Remedy for Furuncles. BMC Complement. Altern. Med. 2008, 8, 27 10.1186/1472-6882-8-27. [DOI] [PMC free article] [PubMed] [Google Scholar]
- Kifle Z. D.; Atnafie S. A. Anti-Oxidant Potential and Antimalarial Effects of Acanthus polystachyus Delile (Acanthaceae) Against Plasmodium berghei: Evidence for In Vivo Antimalarial Activity. J. Exp. Pharmacol. 2020, 12, 575–587. 10.2147/JEP.S282407. [DOI] [PMC free article] [PubMed] [Google Scholar]
- Mailu J. K.; Nguta J. M.; Mbaria J. M.; Okumu M. O. Qualitative and Quantitative Phytochemical Composition, Antimicrobial Activity, and Brine Shrimp Cytotoxicity of Different Solvent Extracts of Acanthus polystachyus, Keetia gueinzii, and Rhynchosia elegans. Future J. Pharm. Sci. 2021, 7, 195 10.1186/s43094-021-00342-z. [DOI] [Google Scholar]
- Moisa C.; Lupitu A.; Pop G.; Chambre D. R.; Copolovici L.; Cioca G.; Bungau S.; Copolovici D. M. Variation of the Chemical Composition of Thymus vulgaris Essential Oils by Phenological Stages. Rev. Chim. 2019, 70, 633–637. 10.37358/RC.19.2.6973. [DOI] [Google Scholar]
- Alawode T. T.; Lajide L.; Olaleye M.; Owolabi B. Stigmasterol and β-Sitosterol: Antimicrobial Compounds in the Leaves of Icacina trichantha Identified by GC–MS. Beni-Suef Univ. J. Basic Appl. Sci. 2021, 10, 80. 10.1186/s43088-021-00170-3. [DOI] [Google Scholar]
- Anouar E. H.; Gierschner J.; Gierschner J.; Duroux J.-L.; Duroux J. L.; Trouillas P. UV/Visible Spectra of Natural Polyphenols: A Time-Dependent Density Functional Theory Study. Food Chem. 2012, 131 (1), 79–89. 10.1016/j.foodchem.2011.08.034. [DOI] [Google Scholar]
- Ododo M. M.; Choudhury M. K.; Dekebo A. H. Structure Elucidation of β-Sitosterol with Antibacterial Activity from the Root Bark of Malva parviflora. SpringerPlus 2016, 5, 1210 10.1186/s40064-016-2894-x. [DOI] [PMC free article] [PubMed] [Google Scholar]
- Pierre Luhata L.; Usuki T. Antibacterial Activity of β-Sitosterol Isolated from the Leaves of Odontonema strictum (Acanthaceae). Bioorg. Med. Chem. Lett. 2021, 48, 128248 10.1016/j.bmcl.2021.128248. [DOI] [PubMed] [Google Scholar]
- Ravi L.; Girish S.; Harshini M.; Sreenivas B. K. A. β-Sitosterol: An Antibacterial Agent in Aquaculture Management of Vibrio Infections. J. Pure Appl. Microbiol. 2020, 14 (4), 2699–2714. 10.22207/JPAM.14.4.48. [DOI] [Google Scholar]
- Togashi N.; Shiraishi A.; Nishizaka M.; Matsuoka K.; Endo K.; Hamashima H.; Inoue Y. Antibacterial Activity of Long-Chain Fatty Alcohols against Staphylococcus aureus. Molecules 2007, 12 (2), 139–148. 10.3390/12020139. [DOI] [PMC free article] [PubMed] [Google Scholar]
- Mukherjee K.; Tribedi P.; Mukhopadhyay B.; Sil A. K. Antibacterial Activity of Long-Chain Fatty Alcohols against Mycobacteria. FEMS Microbiol. Lett. 2013, 338 (2), 177–183. 10.1111/1574-6968.12043. [DOI] [PubMed] [Google Scholar]
- Raman B. V.; Samuel L. A.; Saradhi M. P.; Rao B. N.; Krishna N. V.; Sudhakar M.; Radhakrishnan T. M. Antibacterial, Antioxidant Activity and GC-MS Analysis of Eupatorium odoratum. Asian J. Pharm. Clin. Res. 2012, 5 (2), 99–106. [Google Scholar]
- Mashamba T. G.; Adeosun I. J.; Baloyi I. T.; Tshikalange E. T.; Cosa S. Quorum Sensing Modulation and Inhibition in Biofilm Forming Foot Ulcer Pathogens by Selected Medicinal Plants. Heliyon 2022, 8 (4), e09303 10.1016/j.heliyon.2022.e09303. [DOI] [PMC free article] [PubMed] [Google Scholar]
- Ghavam M.; Afzali A.; Manconi M.; et al. Variability in Chemical Composition and Antimicrobial Activity of Essential Oil of Rosa × damascena Herrm. from Mountainous Regions of Iran. Chem. Biol. Technol. Agric. 2021, 8, 22. 10.1186/s40538-021-00219-6. [DOI] [Google Scholar]
- Ingram L. O.; Vreeland N. S. Differential Effects of Ethanol and Hexanol on the Escherichia coli Cell Envelope. J. Bacteriol. 1980, 144 (2), 481–488. 10.1128/jb.144.2.481-488.1980. [DOI] [PMC free article] [PubMed] [Google Scholar]
- Wang J.; Liu H.; Gao H.; Zhao J.; Zhou L.; Han J.; Yu Z.; Yang F. Antimicrobial and Antioxidant Activities of the Flower Essential Oil of Halimodendron halodendron. Nat. Prod. Commun. 2011, 6 (11), 1749–1753. 10.1177/1934578X1100601144. [DOI] [PubMed] [Google Scholar]
- Al-Marzoqi A. H.; Hadi M. Y.; Hameed I. H. Determination of Metabolites Products by Cassia angustifolia and Evaluate Antimicrobial Activity. J. Pharmacogn. Phytother. 2016, 8 (2), 25–48. 10.5897/JPP2015.0367. [DOI] [Google Scholar]
- Ubaid J. M.; Kadhim M. J.; Hameed I. H. Study of Bioactive Methanolic Extract of Camponotus fellah Using Gas Chromatography–Mass Spectrum. Int. J. Toxicol. Pharmacol. Res. 2016, 8 (6), 434–439. [Google Scholar]
- Oluwasina O. O.; Idris S. O.; Ogidi C. O.; Igbe F. O. Production of Herbal Toothpaste: Physical, Organoleptic, Phyto-Compound, and Antimicrobial Properties. Heliyon 2023, 9 (3), e13892 10.1016/j.heliyon.2023.e13892. [DOI] [PMC free article] [PubMed] [Google Scholar]
- Aleu J.; Hanson J. R.; Galán R. H.; Collado I. G. Biotransformation of the fungistatic sesquiterpenoids patchoulol, ginsenol, cedrol and globulol by Botrytis cinerea. J. Mol. Catal. B: Enzym. 2001, 11, 329–334. 10.1016/S1381-1177(00)00014-X. [DOI] [Google Scholar]
- Abou El-Enain I.; Zeatar A.; Zayed A.; Elkhawaga M.; Mahmoud Y. Diisooctyl Phthalate as a Secondary Metabolite from Actinomycete Inhabit Animal’s Dung with Promising Antimicrobial Activity. Egypt. J. Chem. 2023, (7), 261–277. 10.21608/ejchem.2023.172600.7412. [DOI] [Google Scholar]
- Satyavani K.; Gurudeeban S.; Manigandan V.; Rajamanickam E.; Ramanathan T. Chemical composition of medicinal mangrove species Acanthus ilicifolius, Excoecaria agallocha, Rhizophora apiculata and Rhizophora mucronata. Current Res. Chem. 2015, 7 (1), 1–8. 10.3923/crc.2015.1.8. [DOI] [Google Scholar]
- Mollova S.; Dzhurmanski A.; Fidan H.; Bojilov D.; Manolov S.; Dincheva I.; Stankov S.; Stoyanova A.; Ercisli S.; Assouguem A.; Marc R. A.; Ullah R.; Bari A. Chemical Composition of Essential Oils from Nepeta transcaucasica Grossh. and Nepeta cataria L. Cultivated in Bulgaria and Their Antimicrobial and Antioxidant Activity. ACS Omega 2023, 8, 15441–15449. 10.1021/acsomega.3c00704. [DOI] [PMC free article] [PubMed] [Google Scholar]
- Ilyas U.; Katare D. P.; Aeri V.; Naseef P. P. A Review on Hepatoprotective and Immunomodulatory Herbal Plants. Pharmacogn. Rev. 2016, 10 (19), 66–70. 10.4103/0973-7847.176544. [DOI] [PMC free article] [PubMed] [Google Scholar]
- World Health Organization . Global Priority List of Antibiotic-Resistant Bacteria to Guide Research, Discovery, and Development of New Antibiotics – 2017; WHO: Geneva, Switzerland, 2017.
- Nasr A.; Zhou H.; Huang S.; Wang Y.; Li X.; Zhu G. Comparative Effects of Some Extraction Solvents on the Antimicrobial Activity of Eucalyptus camaldulensis Leaf, Bud, Capsule and Seed Crude Extracts. Nat. Prod. Res. 2019, 33 (17), 2560–2565. 10.1080/14786419.2018.1455049. [DOI] [PubMed] [Google Scholar]
- Kim G.; Gan R. Y.; Zhang D.; Farha A. K.; Habimana O.; Mavumengwana V.; Li H. B.; Wang X. H.; Corke H. Large-Scale Screening of 239 Traditional Chinese Medicinal Plant Extracts for Their Antibacterial Activities against Multidrug-Resistant Staphylococcus aureus and Cytotoxic Activities. Pathogens 2020, 9, 185. 10.3390/pathogens9030185. [DOI] [PMC free article] [PubMed] [Google Scholar]
- Mohammed H. A.; Qureshi K. A.; Ali H. M.; Al-Omar M. S.; Khan O.; Mohammed S. A. A. Bio-Evaluation of the Wound Healing Activity of Artemisia judaica L. as Part of the Plant’s Use in Traditional Medicine; Phytochemical, Antioxidant, Anti-Inflammatory, and Antibiofilm Properties of the Plant’s Essential Oils. Antioxidants 2022, 11, 332. 10.3390/antiox11020332. [DOI] [PMC free article] [PubMed] [Google Scholar]
- Galovičová L.; Borotová P.; Valková V.; Vukovic N. L.; Vukic M.; Terentjeva M.; Štefániková J.; Dúranová H.; Kowalczewski PŁ.; Kačániová M. Thymus serpyllum Essential Oil and Its Biological Activity as a Modern Food Preserver. Plants 2021, 10, 1416. 10.3390/plants10071416. [DOI] [PMC free article] [PubMed] [Google Scholar]
- Alenazy R. Antimicrobial Activities and Biofilm Inhibition Properties of Trigonella foenumgraecum Methanol Extracts against Multidrug-Resistant Staphylococcus aureus and Escherichia coli. Life 2023, 13, 703. 10.3390/life13030703. [DOI] [PMC free article] [PubMed] [Google Scholar]
- Perumal S.; Mahmud R. Chemical Analysis, Inhibition of Biofilm Formation and Biofilm Eradication Potential of Euphorbia hirta L. against Clinical Isolates and Standard Strains. BMC Complement. Altern. Med. 2013, 13, 346 10.1186/1472-6882-13-346. [DOI] [PMC free article] [PubMed] [Google Scholar]
- Wang L.; Zhang K.; Zhang K.; Zhang J.; Fu J.; Li J.; Wang G.; Qiu Z.; Wang X.; Li J. Antibacterial Activity of Cinnamomum camphora Essential Oil on Escherichia coli During Planktonic Growth and Biofilm Formation. Front. Microbiol. 2020, 11, 561002 10.3389/fmicb.2020.561002. [DOI] [PMC free article] [PubMed] [Google Scholar]
- Yang R.; Guan Y.; Zhou J.; Sun B.; Wang Z.; Chen H.; He Z.; Jia A. Phytochemicals from Camellia nitidissima Chi Flowers Reduce the Pyocyanin Production and Motility of Pseudomonas aeruginosa PAO1. Front. Micribiol. 2018, 8, 2640 10.3389/fmicb.2017.02640. [DOI] [PMC free article] [PubMed] [Google Scholar]
- Pejin B.; Ciric A.; Glamoclija J.; Nikolic M.; Sokovic M. In vitro anti-quorum sensing activity of phytol. Nat. Prod Res. 2015, 29, 374–7. 10.1080/14786419.2014.945088. [DOI] [PubMed] [Google Scholar]
- Goudjil M. B.; Zighmi S.; Hamada D.; Mahcene Z.; Bencheikh S. E.; Ladjel S. Biological Activities of Essential Oils Extracted from Thymus capitatus (Lamiaceae). S. Afr. J. Bot. 2020, 128, 274–282. 10.1016/j.sajb.2019.11.020. [DOI] [Google Scholar]
- Sbhatu D. B.; Abraha H. B. Preliminary Antimicrobial Profile of Solanum incanum L.: A Common Medicinal Plant. Evidence-Based Complementary Altern. Med. 2020, 2020, 3647065 10.1155/2020/3647065. [DOI] [PMC free article] [PubMed] [Google Scholar]
- Musyimi D. M.; Ashioya T. A.; Opande G.; Emitaro W. O. Antibacterial Activity of Crude Extracts of Solanum incanum against Escherichia coli and Staphylococcus aureus. Bact. Emp. 2021, 4 (2), e183 10.36547/be.183. [DOI] [Google Scholar]
- Agbafor K. N.; Nwachukwu N. Phytochemical Analysis and Antioxidant Property of Leaf Extracts of Vitex doniana and Mucuna pruriens. Biochem. Res. Int. 2011, 2011, 459839 10.1155/2011/459839. [DOI] [PMC free article] [PubMed] [Google Scholar]
- Oloya B.; Namukobe J.; Ssengooba W.; Afayoa M.; Byamukama R. Phytochemical Screening, Antimycobacterial Activity and Acute Toxicity of Crude Extracts of Selected Medicinal Plant Species Used Locally in the Treatment of Tuberculosis in Uganda. Trop. Med. Health 2022, 50 (1), 16 10.1186/s41182-022-00406-7. [DOI] [PMC free article] [PubMed] [Google Scholar]
- Agidew M. G. Phytochemical Analysis of Some Selected Traditional Medicinal Plants in Ethiopia. Bull. Natl. Res. Cent. 2022, 46 (1), 87 10.1186/s42269-022-00770-8. [DOI] [Google Scholar]
- Urbano M.; De Castro M. D. L.; Pérez P. M.; García-Olmo J.; Gomez-Nieto M. A. Ultraviolet–Visible Spectroscopy and Pattern Recognition Methods for Differentiation and Classification of Wines. Food Chem. 2006, 97 (1), 166–175. 10.1016/j.foodchem.2005.05.001. [DOI] [Google Scholar]
- Gülçin İ.; Küfrevioğlu Ö. İ.; Oktay M.; Büyükokuroğlu M. E. Antioxidant, Antimicrobial, Antiulcer and Analgesic Activities of Nettle (Urtica dioica L.). J. Ethnopharmacol. 2004, 90 (2–3), 205–215. 10.1016/j.jep.2003.09.028. [DOI] [PubMed] [Google Scholar]
- Hanuš L. O.; Rosenthal D.; Řezanka T.; Dembitsky V.; Moussaief A. Fast and Easy GC/MS Identification of Myrrh Resins. Pharm. Chem. J. 2008, 42, 719–720. 10.1007/s11094-009-0209-z. [DOI] [Google Scholar]
- Bondet V.; Brand-Williams W.; Berset C. Kinetics and mechanisms of antioxidant activity using the DPPH. free radical method. LWT--Food Sci. Technol. 1997, 30 (6), 609–615. 10.1006/fstl.1997.0240. [DOI] [Google Scholar]
- Agbor A. M.; Fotsing K. P.; Dountio S. H.; Fokunang N. C.; Naidoo S. Phytochemical Investigation and Antimicrobial Activity of Clausena anisata on Cariogenic and Periodontopathic Bacteria. Eur. J. Med. Plants 2021, 31 (19), 11–25. 10.9734/ejmp/2020/v31i1930345. [DOI] [Google Scholar]
- Ghasemi Pirbalouti A.; Hashemi M.; Ghahfarokhi F. T. Essential Oil and Chemical Compositions of Wild and Cultivated Thymus daenensis Celak and Thymus vulgaris L. Ind. Crops Prod. 2013, 48 (1), 43–48. 10.15421/011936. [DOI] [Google Scholar]
- Kachhadia R.; Kapadia C.; Singh S.; Gandhi K.; Jajda H.; Alfarraj S.; Datta R.; et al. Quorum Sensing Inhibitory and Quenching Activity of Bacillus cereus RC1 Extracts on Soft Rot-Causing Bacteria Lelliottia amnigena. ACS Omega 2022, 7 (29), 25291–25308. 10.1021/acsomega.2c02202. [DOI] [PMC free article] [PubMed] [Google Scholar]
Associated Data
This section collects any data citations, data availability statements, or supplementary materials included in this article.