Abstract
Cardiomyocyte proliferation and dedifferentiation have fueled the field of regenerative cardiology in recent years, whereas the reverse process of redifferentiation remains largely unexplored. Redifferentiation is characterized by the restoration of function lost during dedifferentiation. Previously, we showed that ERBB2-mediated heart regeneration has these two distinct phases: transient dedifferentiation and redifferentiation. Here we survey the temporal transcriptomic and proteomic landscape of dedifferentiation–redifferentiation in adult mouse hearts and reveal that well-characterized dedifferentiation features largely return to normal, although elements of residual dedifferentiation remain, even after the contractile function is restored. These hearts appear rejuvenated and show robust resistance to ischemic injury, even 5 months after redifferentiation initiation. Cardiomyocyte redifferentiation is driven by negative feedback signaling and requires LATS1/2 Hippo pathway activity. Our data reveal the importance of cardiomyocyte redifferentiation in functional restoration during regeneration but also protection against future insult, in what could lead to a potential prophylactic treatment against ischemic heart disease for at-risk patients.
In recent years, enormous strides have been made toward achieving cardiac regeneration via cardiomyocyte (CM) dedifferentiation and proliferation; however, few studies have considered the return journey: how, and to what extent, do dedifferentiated CMs redifferentiate1? The necessity for redifferentiation has been highlighted by several recent studies whereby irreversible interventions that cause persistent CM dedifferentiation and proliferation proved deleterious in zebrafish2 and fatal in mice3–5 and pigs6. This is consistent with the notion that dedifferentiation endows the adult heart with embryonic characteristics that promote regeneration but hinder mature function, such as contractility. Despite this, some studies have actually found that irreversible interventions to induce dedifferentiation are well tolerated by the heart7 and improve function after injury8–16. We postulate that negative feedback signaling may be the countering force that stabilizes or improves heart function in response to mitogenic signaling and, therefore, is important for redifferentiation. However, its significance has never been investigated, partially hampered by the lack of a suitable model. To address this, we took advantage of a previously established transgenic mouse line that can transiently overexpress an activated form of the tyrosine kinase receptor ERBB2 (caERBB2, or OE in short)3. Such mice show a distinct dedifferentiation phase when caERBB2 is upregulated, characterized by the decline in functional parameters, and a clear redifferentiation phase after caERBB2 expression is halted, characterized by functional recovery3. This allowed us not only to investigate the mechanism behind redifferentiation but also to shed light on the extent to which certain biological processes do or do not return to normal after dedifferentiation.
Here we show that the cycle of ERBB2-induced dedifferentiation and redifferentiation occurs independently of injury and that, despite functional recovery during redifferentiation, hundreds of genes and proteins remain or become differentially expressed 1 month after caERBB2 shut-off. The most striking example is GJA1, whose levels remain substantially suppressed for up to 1 year after the cessation of ERBB2 signaling. Bioinformatic analysis reveals a signature of residual dedifferentiation, whereby certain pathways that were activated or inactivated during dedifferentiation mostly but do not completely return to baseline (that is, pre ERBB2 activation). This confers robust and enduring cardioprotection to the heart against future ischemic injury. Mechanistically, redifferentiation in mice is driven by the Hippo pathway kinases LATS1/2, which, when knocked-out in the background of caERBB2 OE, leads to failed redifferentiation and sustained CM dedifferentiation. The current lack of knowledge around CM redifferentiation is a barrier to clinical translation of regenerative therapies that promote CM dedifferentiation. This study thoroughly characterizes the process of redifferentiation and shows that, despite the remarkable capacity the heart has to redifferentiate, the process is not as simple as a reversal of dedifferentiation and can have lasting effects. A more comprehensive understanding of redifferentiation will be critical in realizing the potential for cardiac regeneration.
Results
Hundreds of genes and proteins show differential expression after redifferentiation
To study CM redifferentiation after transient mitogenic signaling and its relation to successful cardiac regeneration, we employed the use of a previously established system to transiently or persistently express caERBB2 in CMs3,17. In this paradigm, caERBB2 is transiently overexpressed by temporarily removing doxycycline (Dox) food or persistently by permanently removing Dox food (Fig. 1a). Echocardiography of mice that received a myocardial infarction (MI) by left anterior descending (LAD) ligation revealed that persistent overexpression (pOE) led to a decline in relative stroke volume (rSV), similarly to that of a wild-type (WT) mouse, whereas transient overexpression (tOE) allowed for functional recovery (Fig. 1c). Although the ERBB2-induced hypertrophy was the main driver behind the low rSV, as evidenced by increased wall thickness (Extended Data Fig. 1a,b) and decreased left ventricular (LV) volume (Fig. 1d), CMs remained dedifferentiated with compromised function even after the hypertrophy subsided, 1 week after caERBB2 shut-off (4 weeks after MI). From this timepoint until 7 weeks after MI, functional improvement occurred without changes to ventricular dimensions in tOE hearts (Fig. 1c,d, blue shaded area, and Extended Data Fig. 1a–d). We also found that sham injured hearts showed a very similar functional trajectory, demonstrating the injury-independent nature of the dedifferentiation–redifferentiation (DR) cycle (Fig. 1e,f, Extended Data Fig. 1e–h and Supplementary Movie 1). We conclude that persistent CM dedifferentiation prevents functional recovery.
Fig. 1 |. Hundreds of genes and proteins show differential expression after redifferentiation.
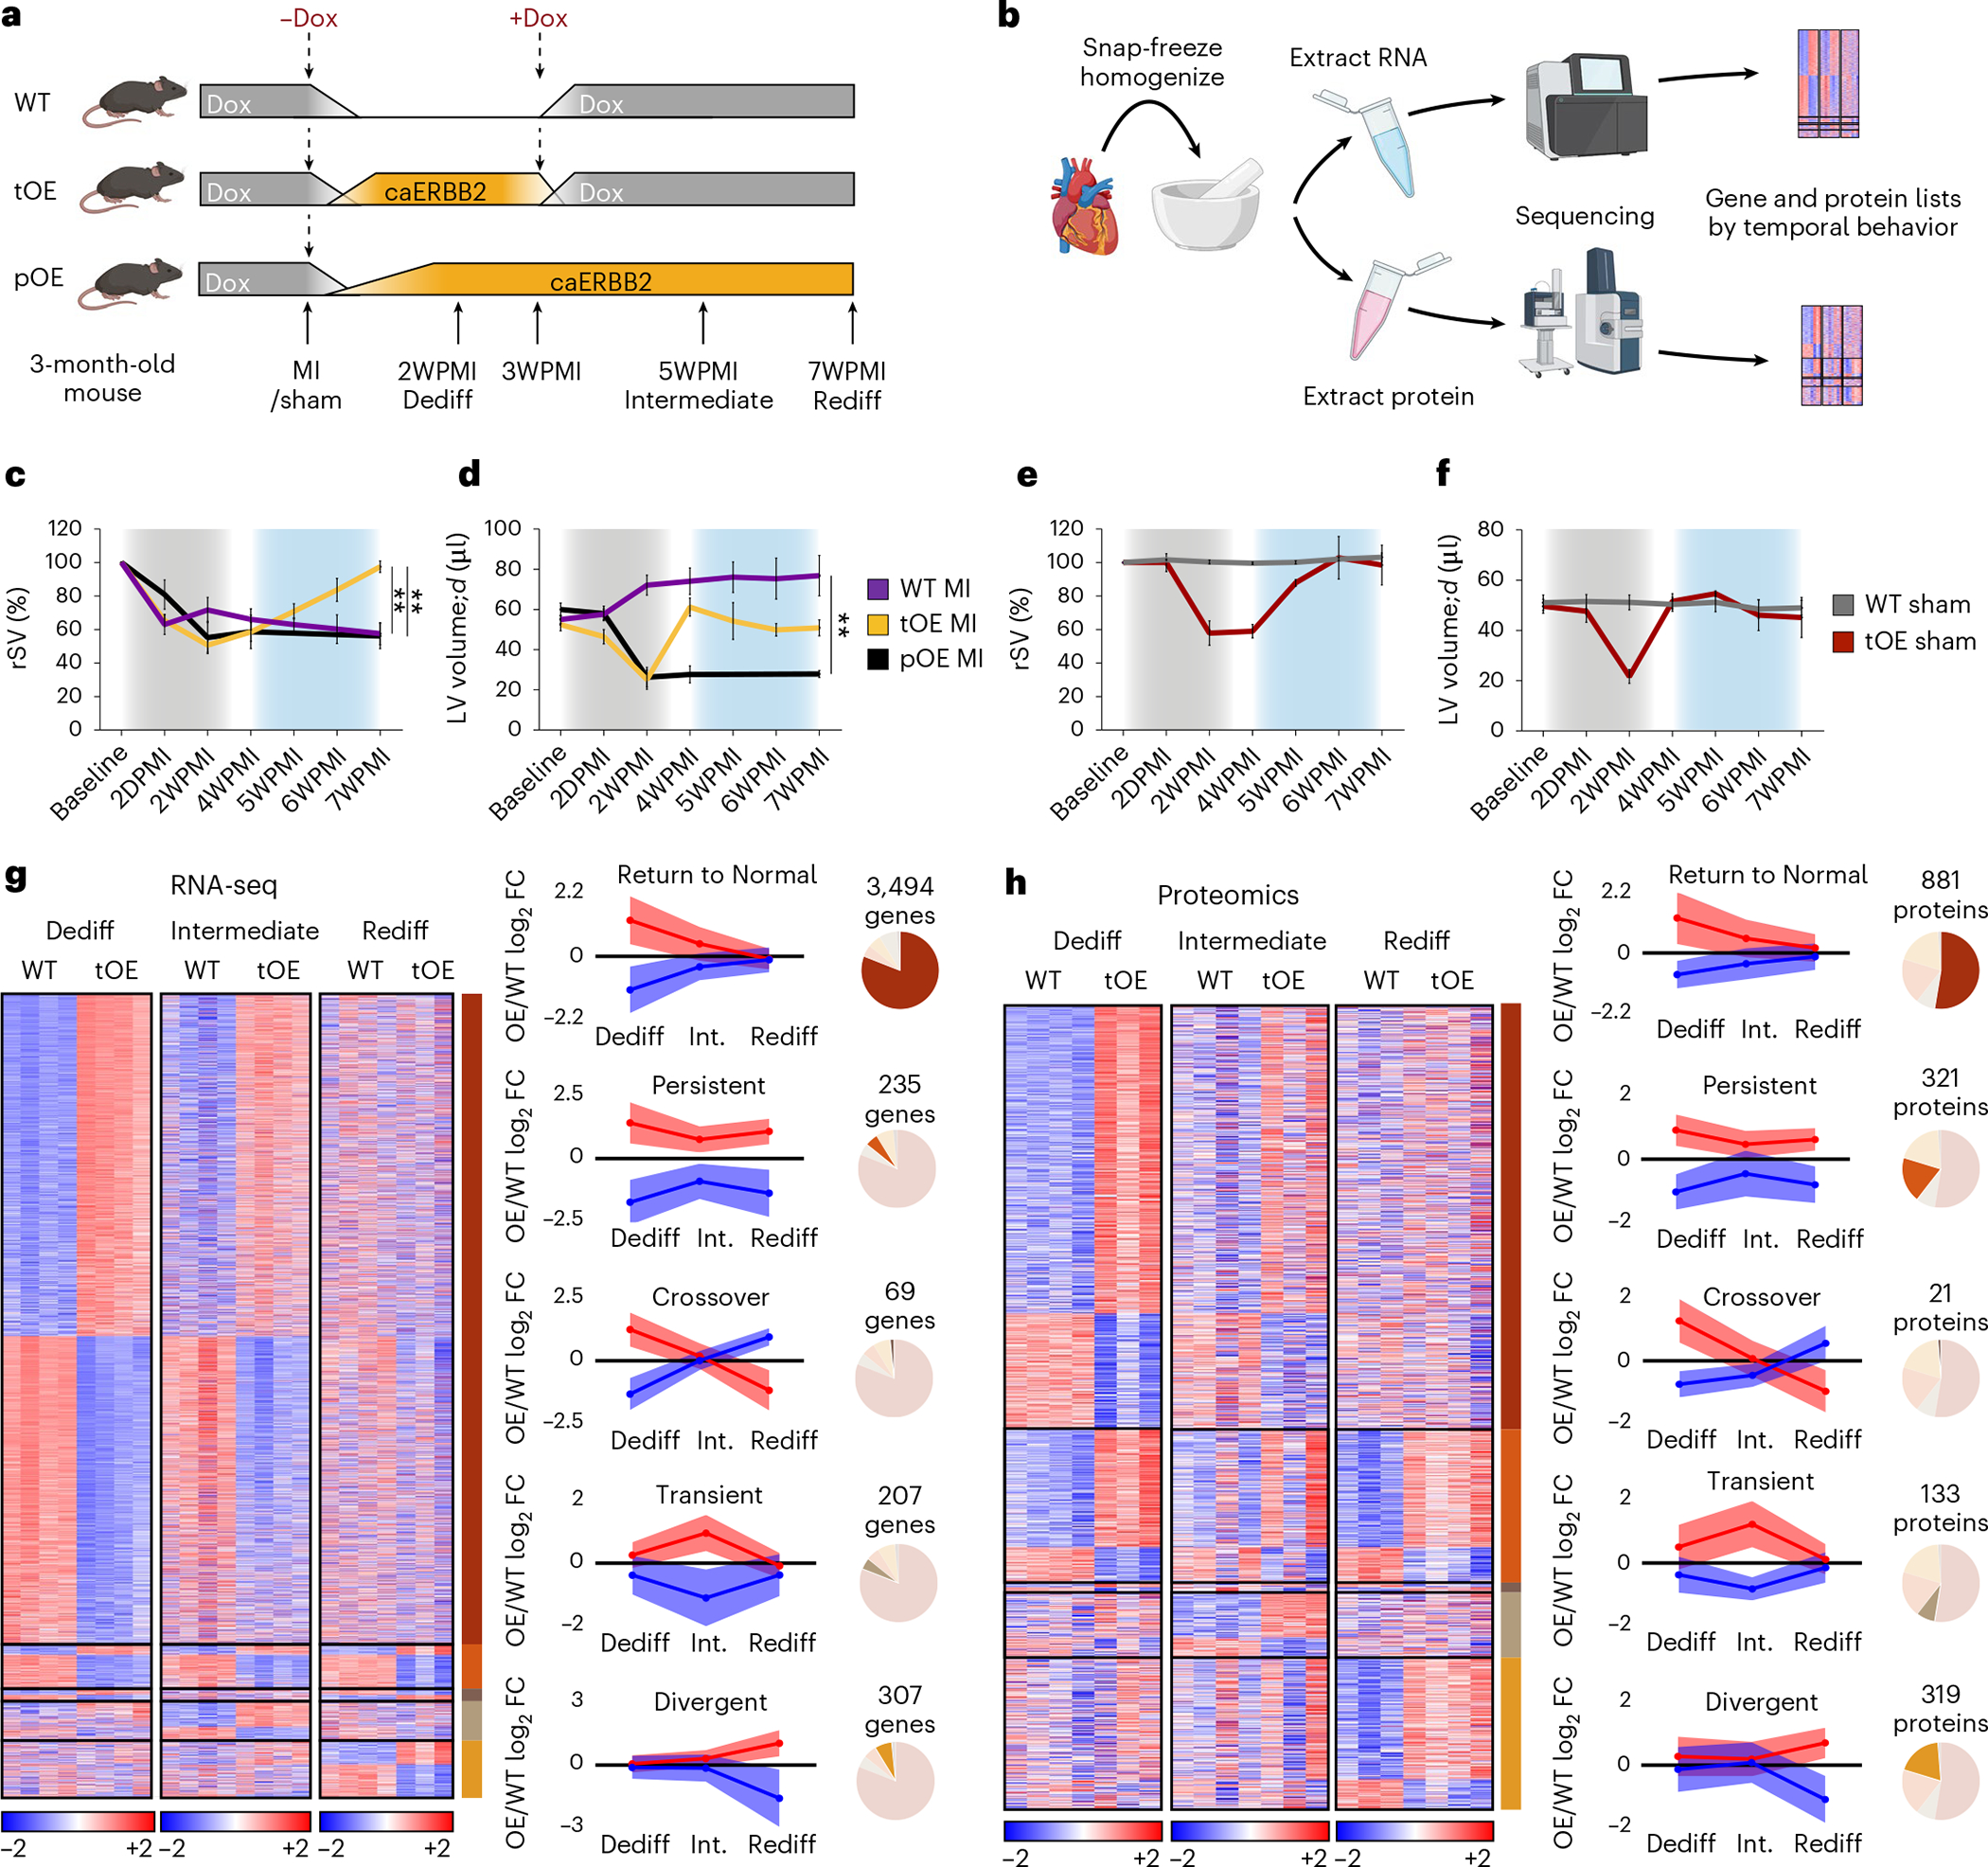
a, Schematic of inducible caERBB2 expression system in adult mouse CMs. ±Dox represents the respective removal and reintroduction of Dox to the diet to temporarily induce caERBB2 expression. b, Workflow of extracting RNA and protein from whole hearts before sequencing. c–f, rSV (c,e) and left ventricular diastolic volume (LV volume;d) (d,f) of hearts from the indicated mice measured by echocardiography. For c, WT MI versus tOE MI P = 0.0030, pOE MI versus tOE MI P = 0.0039; for d, WT MI versus pOE MI P = 0.0041. Gray shaded area represents the period of caERBB2 activation (dedifferentiation). Blue shaded area represents the redifferentiation phase. Overall, n = 3–8 per group. Data are represented as mean ± s.e.m. Statistical significance was calculated by one-way ANOVA with Sidak’s multiple comparison test at the 7WPMI (Rediff) timepoint. *P ≤ 0.05, **P < 0.01, ***P < 0.001, ****P < 0.0001. D/WPMI = days/weeks post MI. g,h, Heat maps based on log2-transformed normalized counts for sham RNA-seq and log10-transformed intensity values for sham proteomics. Rows represent genes/proteins. Columns represent each biological sample. Color bars represent z-score for each row within each timepoint. Temporal gene/protein expression pattern was defined as follows: ‘Return to Normal’: differentially expressed (DE) at Dediff, not DE at Rediff; ‘Persistent’: DE at Dediff, DE in the same direction at Rediff; ‘Crossover’: DE at Dediff, DE at Rediff in opposite direction; ‘Transient’: DE only at Intermediate; and ‘Divergent’: not DE at Dediff, DE at Rediff. Graphs show the average tOE/WT log2 fold change for genes (g) and proteins (h) for each group (represented as mean ± s.d. as error band). Genes/proteins that were downregulated when first DE are shown in blue, and those that were upregulated when first DE are shown in red. Pie charts show the relative proportion of genes/proteins in each temporal group (out of the total number of DE genes/proteins). FC, fold change.
Given the requirement of transient dedifferentiation in cardiac regeneration, we sought to survey the transcriptional and proteomic landscape over the course of redifferentiation. We isolated hearts from three key timepoints: peak of ERBB2 activity, termed ‘Dediff’, 2 weeks after ERBB2 signaling cessation, termed ‘Intermediate’ (Int.), and a point in time where regeneration was estimated to be complete, termed ‘Rediff’ (Fig. 1a). These timepoints corresponded to a return to baseline values of heart function (Fig. 1c–f) and ERBB2 levels (Extended Data Fig. 1i–k). We performed bulk RNA sequencing (RNA-seq) and proteomics on sham and injured, WT and tOE hearts from these three timepoints (Fig. 1b) and produced a set of user-friendly Excel-based tools to analyze differentially expressed genes and proteins among the groups (Supplementary Datasets 1–6). Using these tools, we procured a list of genes or proteins that were differentially expressed (tOE/WT) at at least one timepoint. We grouped the genes and proteins according to five different temporal patterns: Return to Normal, Persistent, Crossover, Transient and Divergent (Fig. 1g,h). Over the time period of functional restoration (for both sham and MI hearts), most of these genes and proteins showed a ‘Return to Normal/Baseline’ pattern; however, a substantial proportion remained or actually became differentially expressed—that is, ‘Persistent’ or ‘Divergent’, respectively (Fig. 1g,h and Extended Data Fig. 1l,m). This is reflected in the sham RNA-seq and proteomics principal component analysis (PCA) plots and corresponding dendrograms (Extended Data Fig. 1n–q). Hence, functional recovery after transient ERBB2 signaling occurs despite incomplete reversal (and the development) of differentially expressed genes and proteins.
Dedifferentiation phenotypes are largely reversed in functionally redifferentiated hearts
We next sought to understand whether the differentially expressed genes and proteins at the ‘Rediff’ timepoint were clustered into pathways that could reveal previously unknown phenotypic or functional differences between tOE and WT hearts. To do so, we performed Ingenuity Pathway Analysis on the sham RNA-seq data. Given the similarity of gene/protein expression patterns after transient ERBB2 signaling in both sham and MI-injured groups, we focused only on sham or uninjured animals, unless otherwise stated. By plotting the enrichment significance (tOE/WT) against the z-score for Gene Ontology (GO) terms at all three timepoints (Dediff, Int. and Rediff), we were able to visualize canonical pathway behavior over time. We grouped canonical pathways into broader categories that characterize dedifferentiation: cell growth and proliferation3,4, EMT-like features9,17 and lower oxphos metabolism18,19. EMT-like features refer to behaviors such as extracellular matrix deposition, degradation and cell migration, as detailed in our previous study17. We found that GO terms within these categories showed activation or inactivation predictions consistent with dedifferentiation at the Dediff timepoint and progressively returned to baseline (Fig. 2a and Extended Data Figs. 3 and 4). We validated this by RT–qPCR, also assaying for the glycolysis genes Slc16a3, Pfkp and Pdk3, indicating a complementary shift to glycolysis (Extended Data Fig. 2a), and noted that, when ERBB2 signaling was persistent, so too was the differential expression of these genes (Extended Data Fig. 2b). We also found, by western blot, that many proteins involved in these pathways, such as YAP, STAT3, VIMENTIN, NESTIN and NDUFB9, showed similar expression trajectories—that is, a gradual return to baseline (Fig. 2b and Extended Data Fig. 2c).
Fig. 2 |. Dedifferentiated phenotypes are largely reversed in functionally redifferentiated hearts.
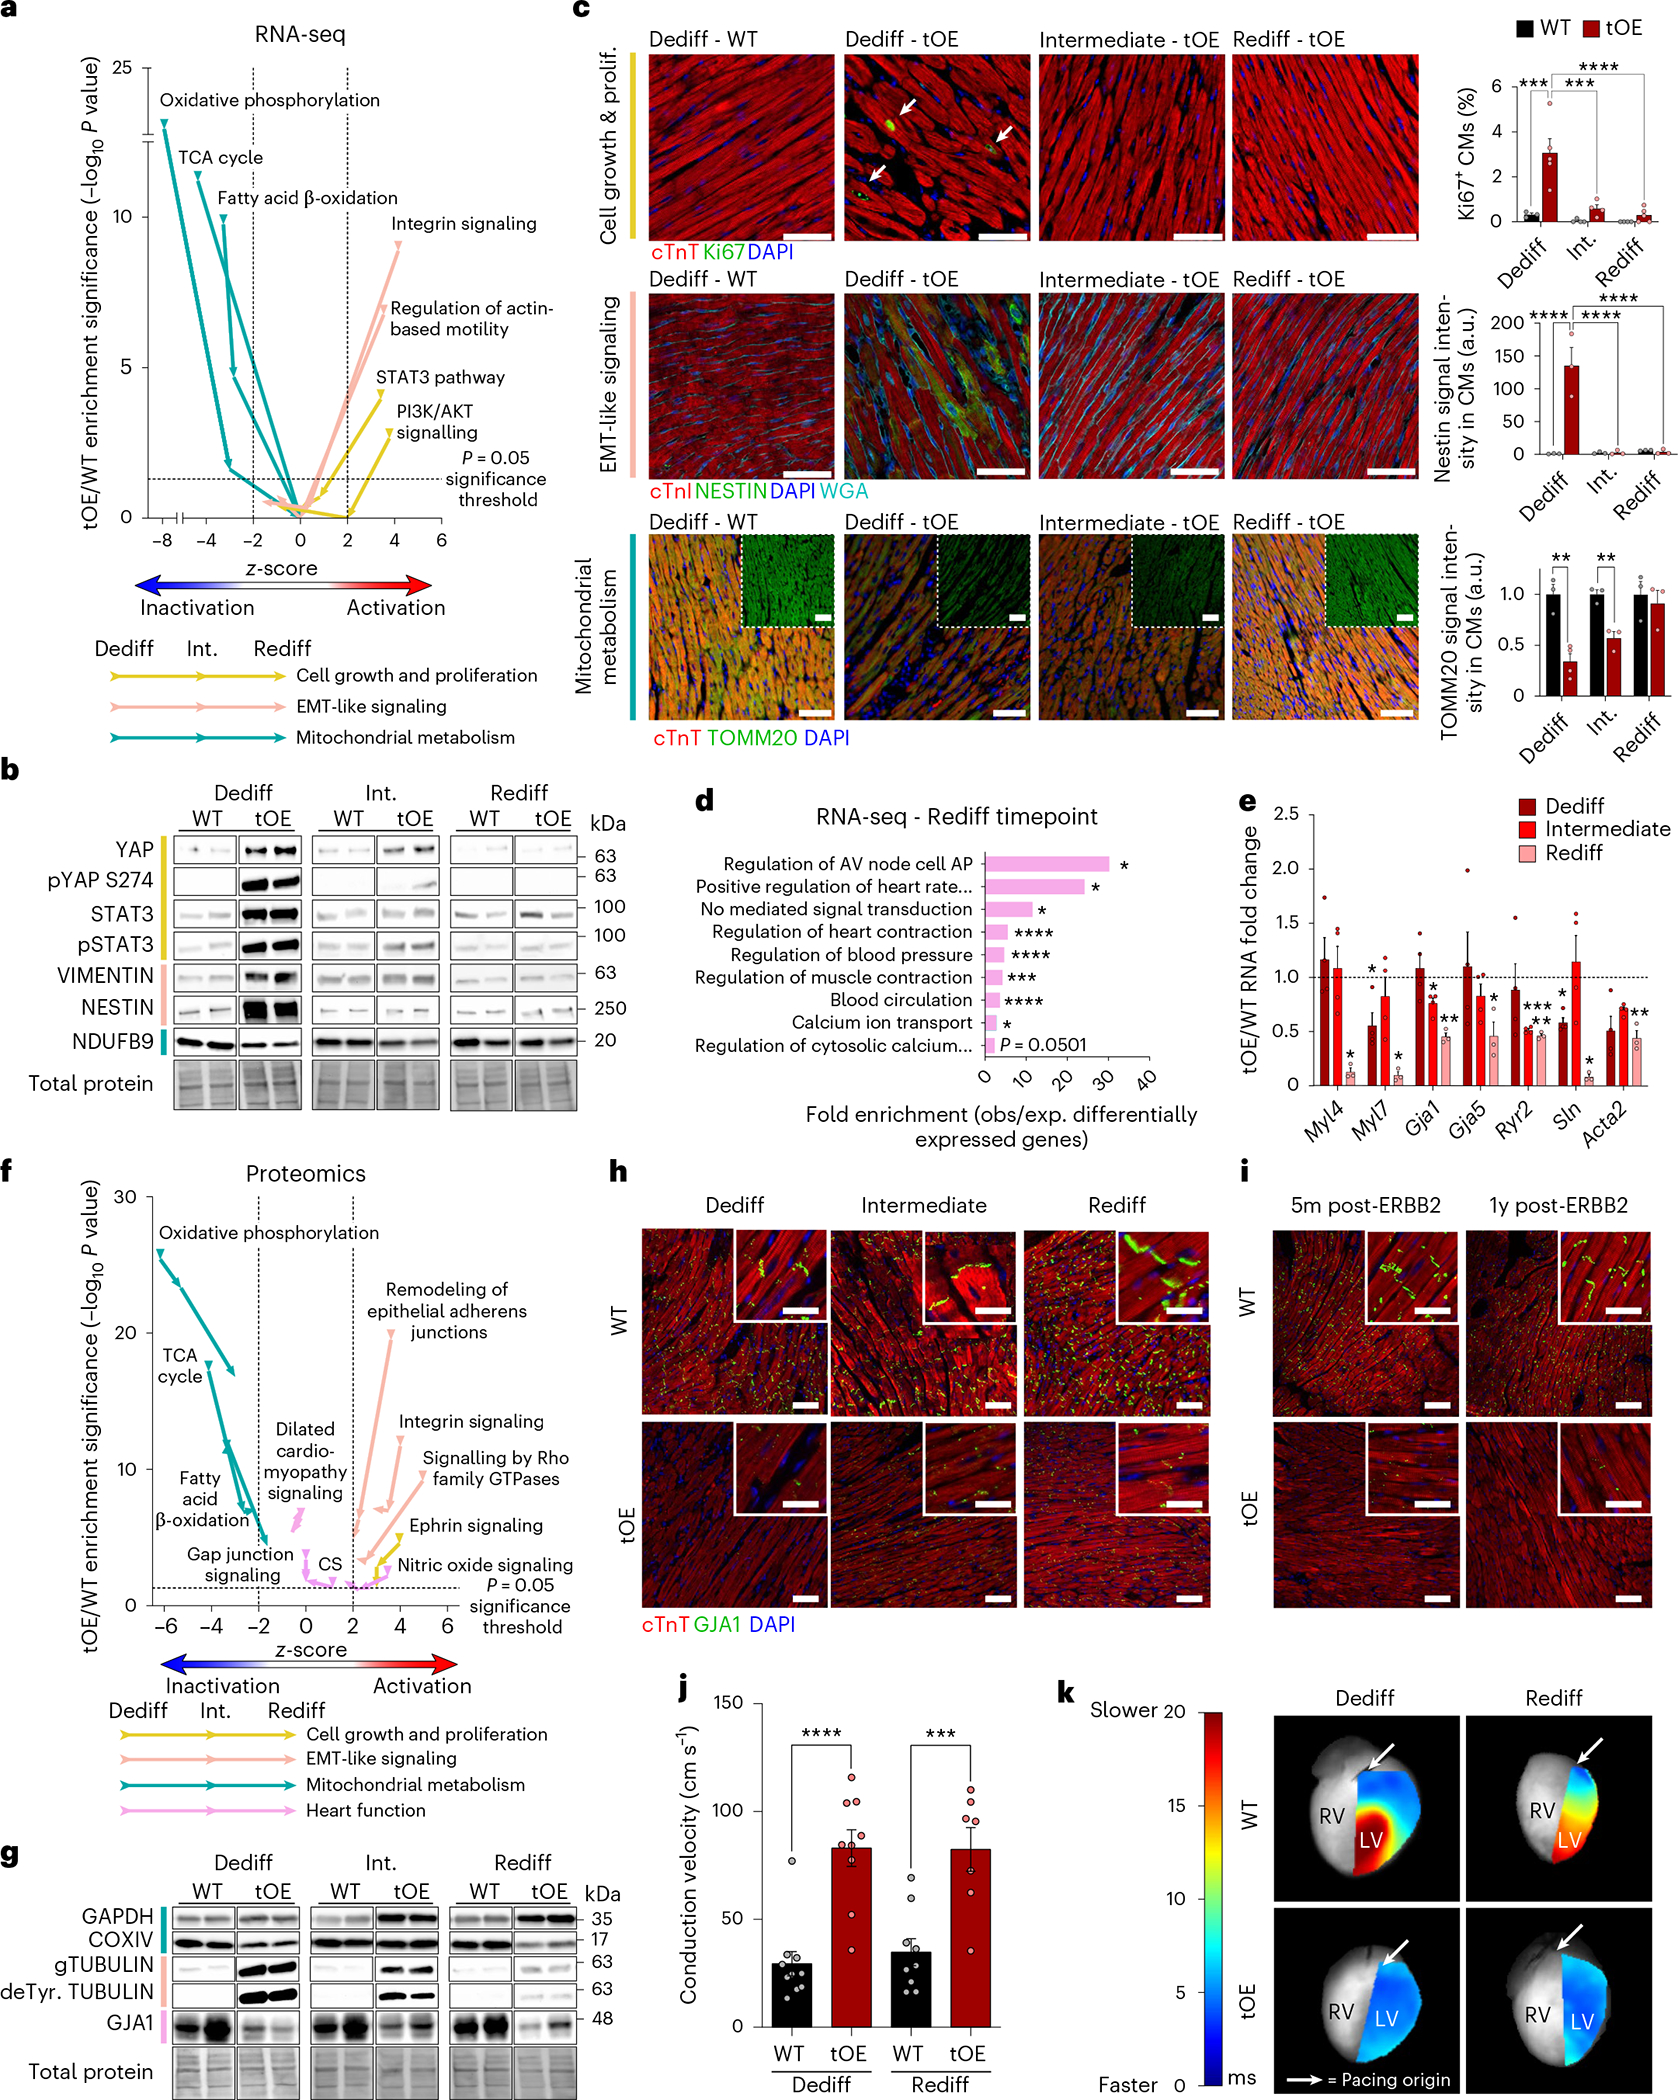
a, Scatter plot of GO term z-score against enrichment significance (log10 P value) for tOE/WT across all timepoints, based on Ingenuity Pathway Analysis of RNA-seq data using a threshold FC ≥ 1.5, adjusted P ≤ 0.05. Arrows on each line indicate the temporal direction of the GO term from Dediff to Rediff. z-scores below −2 are predictive of pathway inactivation and above +2 are predictive of pathway activation. Values above the horizontal dashed black line represent statistically significant enrichment. b, Representative western blot of ‘Return to Normal’ proteins from WT and tOE adult heart lysates. n = 4–7 per group. STAT3 samples were normalized based on total protein from a gel run in parallel. c, Representative immunofluorescence images with full quantification. Images were acquired in the remote zones of MI-injured hearts as a proxy for sham injury. White arrows highlight Ki67+ CMs. For Ki67+ CM quantification, Dediff: WT n = 1,922 (CMs) from 14 images across three hearts, OE n = 2,964 from 34 images across five hearts; Intermediate: WT n = 2,165 from 19 images across four hearts, OE n = 2,155 from 20 images across four hearts; Rediff: WT n = 2,241 from 19 images across four hearts, OE n = 2,953 from 29 images across five hearts. For NESTIN fluorescence intensity within CMs, Dediff: WT n = 3 (hearts) from 22 fields, OE n = 3 from 27 fields; Intermediate: WT n = 3 from 32 fields, OE n = 3 from 34 fields; Rediff: WT n = 3 from 32 fields, OE n = 3 from 26 fields. For TOMM20 fluorescence intensity within CMs, Dediff: WT n = 3 (hearts) from 24 fields, OE n = 4 from 63 fields; Intermediate: WT n = 3 from 18 fields, OE n = 3 from 27 fields; Rediff: WT n = 3 from 22 fields, OE n = 3 from 27 fields. All images from each biological repeat were taken from at least three sections. Scale bars, 50 μm for Ki67 and NESTIN, 100 μm for TOMM20. d, PANTHER overrepresentation results for tOE/WT differentially expressed (DE) genes at Rediff. e, RT–qPCR analysis of heart-function-related genes that are DE at Rediff from WT and tOE adult heart lysates for each timepoint. n = 3–4 per group. Each data point is normalized to the average WT value of its corresponding timepoint. f, Equivalent scatter plot to a, based on proteomic data, using a threshold FC ≥ 1.1, P ≤ 0.05. CS, calcium signaling. g, Representative western blot for WT and tOE adult heart lysates at each timepoint for proteins that were DE at Rediff. n = 3–8 per group. h,i, Representative immunofluorescence images of GJA1 in adult WT and tOE hearts (h) plus additional timepoints of 5 months and 1 year after ERBB2 shut-off (i), n = 3 per group. Main scale bar, 100 μm; inset, 10 μm. j, Conduction velocity across the left ventricle of Langendorff perfused hearts, paced from the base every 200 ms. n = 7–10 per group. Dediff WT versus tOE P < 0.0001, Rediff WT versus tOE P = 0.000986. k, Representative heat maps of conduction velocity. Each pixel is colored according to the amount of time taken (ms) for the action potential (originating at the pacing electrode) to reach it, overlaid onto a grayscale image of the heart. LV, left ventricle; RV, right ventricle. In all panels, numerical data are presented as mean ± s.e.m. Statistical significance was calculated using a right-tailed Fisher’s exact test with Benjamini–Hochberg false discovery rate correction for multiple testing in a, d and f; two-way ANOVA followed by Tukey’s test in c for Ki67 and NESTIN and in j; two-tailed unpaired Student’s t-test in c for TOMM20 and e for WT to tOE comparison within each timepoint. *P ≤ 0.05, **P < 0.01, ***P < 0.001, ****P < 0.0001. Uncropped blots for b and g are provided in Supplementary Source Data. 1yr, 1 year; 5m, 5 months; a.u., arbitrary units.
Because data from bulk sequencing methods can be influenced by various cell types in the heart, we sought to validate that these signatures were relevant for CMs by staining in vivo heart sections. Staining revealed a CM-specific increase of the cell cycle marker Ki67, the EMT-marker NESTIN and a corresponding decrease of the outer mitochondrial membrane protein TOMM20 (Fig. 2c and Extended Data Fig. 2d). To determine whether the Ingenuity Pathway Analysis prediction of oxphos metabolism inhibition at the Dediff timepoint (Fig. 2a) translated into a measurable change in metabolism, we cultured CMs from P7 WT and OE pups (as an in vitro proxy for the Dediff timepoint). Accordingly, we found that the OE CMs had diminished maximal oxygen consumption and showed a trend toward increased ECAR (proxy for glycolysis) (Extended Data Fig. 2e’–f”). We also noted a similar transient pattern for hypercellularity and gross tissue disarray (Extended Data Fig. 2g), immune system-related pathways (Extended Data Fig. 2h) and angiogenic signaling activation (Extended Data Fig. 2i–k).
Although the above data are consistent with the return to baseline (pre-ERBB2 activation) contractility during redifferentiation, further analysis reveals a more complex picture, whereby some canonical pathways remain significantly enriched (tOE/WT) at the Rediff timepoint. For example, PANTHER analysis of differentially expressed genes at Rediff revealed enrichment of several pathways relating to heart function (Fig. 2d). The gene expression changes driving this result (including Myl4, Gja1 and Ryr2) were validated by RT–qPCR (Fig. 2e). Ingenuity Pathway Analysis of the proteomic data complemented this, with persistent enrichment for the following GO terms: Dilated Cardiomyopathy Signaling, Nitric Oxide Signaling, Gap Junction Signaling and Calcium Signaling (Fig. 2f). This analysis also revealed that, at the Rediff timepoint, predicted activation/inactivation of pathways involved in proliferation, EMT-like signaling and mitochondrial metabolism remained so at Rediff (Fig. 2f). These predictions are driven by a concentration of differentially expressed proteins in these pathways at the Rediff timepoint (Extended Data Figs. 5–7), even if the expression fold change is less pronounced (COXIV, TUBULIN and deTyrosinated TUBULIN) (Fig. 2g and Extended Data Fig. 2l). We interpret these pathway trajectories as residual dedifferentiation that remains at the Rediff timepoint, in contrast to the heart-function-related pathways (marked in pink), which are more static. One such protein driving these predictions was the gap junction protein GJA1 (Cx43), which was persistently downregulated in response to transient ERBB2 signaling (Fig. 2g and Extended Data Fig. 2l). Given its important role in the heart20, we stained WT and tOE sections from all three timepoints and found that both its intensity and intercalated disc localization were markedly reduced (Fig. 2h). We posited that, if given more time to redifferentiate, GJA1 levels might recover. Therefore, we stained heart sections that were 5 months and 1 year after ERBB2 shut-off, and, remarkably, the levels were still substantially lower than the WT (Fig. 2i), indicating that there are some potentially irreversible consequences of CM dedifferentiation.
Although, by echocardiography, WT and tOE hearts at the Rediff timepoint are indistinguishable (Fig. 1e,f), we hypothesized that conduction velocity, partially mediated by GJA1, would reveal a difference between the two groups. To test this, we performed ex vivo high-resolution optical mapping of the action potential across the subepicardium in WT and tOE hearts at the Dediff and Rediff timepoints. We found that tOE hearts accommodated a significantly faster conduction velocity, revealing a previously unknown phenotype of Rediff hearts (Fig. 2j,k), that could not be detected by echocardiography. Although a reduction in GJA1 is commonly associated with a reduction in conduction velocity, this typically occurs only after a more than 90% reduction in total levels21, far beyond what we measured (Extended Data Fig. 2l), but also can be influenced by various other factors22. Taken together, we conclude that the molecular signatures of dedifferentiation are largely, but not completely, reversed after a period of redifferentiation.
DR cycle confers robust protection against ischemic injury
Given that redifferentiated hearts have normal echocardiographic function with remnant molecular features of embryonic or neonatal hearts (for example, proliferation, metabolism and EMT-like features), we sought to test whether a cycle of DR—3 weeks of caERBB2 ON followed by 1 month of caERBB2 OFF—rejuvenates the heart and, consequently, confers greater resilience to injury. We, therefore, performed LAD ligation (MI) on WT and tOE-DR adult mice—that is, those that had undergone a cycle of DR—and recorded their heart function for 4 weeks (Fig. 3a, left box). Although WT heart function parameters declined after injury, with a wide distribution of values, tOE-DR mice retained near-baseline values, with a tighter distribution (Fig. 3b,c, Extended Data Fig. 8a and Supplementary Movie 2). This effect was predominantly driven by a maintenance of anterior wall thickness (Extended Data Fig. 8b) and contractility (Fig. 3d), as opposed to a change in posterior wall thickness or ventricular diastolic volume (Extended Data Fig. 8c,d), which can also influence functional echocardiographic parameters. This effect was seen as early as the 2-day post-MI timepoint and persisted for 1 month, indicating a robust cardioprotective effect of a DR cycle before injury. These functional data were complemented by scar analysis, whereby scar area as a proportion of the left ventricle was lower among the tOE-DR group (Fig. 3e,f). Scar classification analysis also revealed that tOE-DR hearts had a higher proportion of sections per slide with ‘no scar’ and a lower proportion with a ‘transmural scar’ (which, in humans, correlates with an increased risk of acute mortality after MI23) (Extended Data Fig. 8e).
Fig. 3 |. DR cycle confers robust protection against ischemic injury.
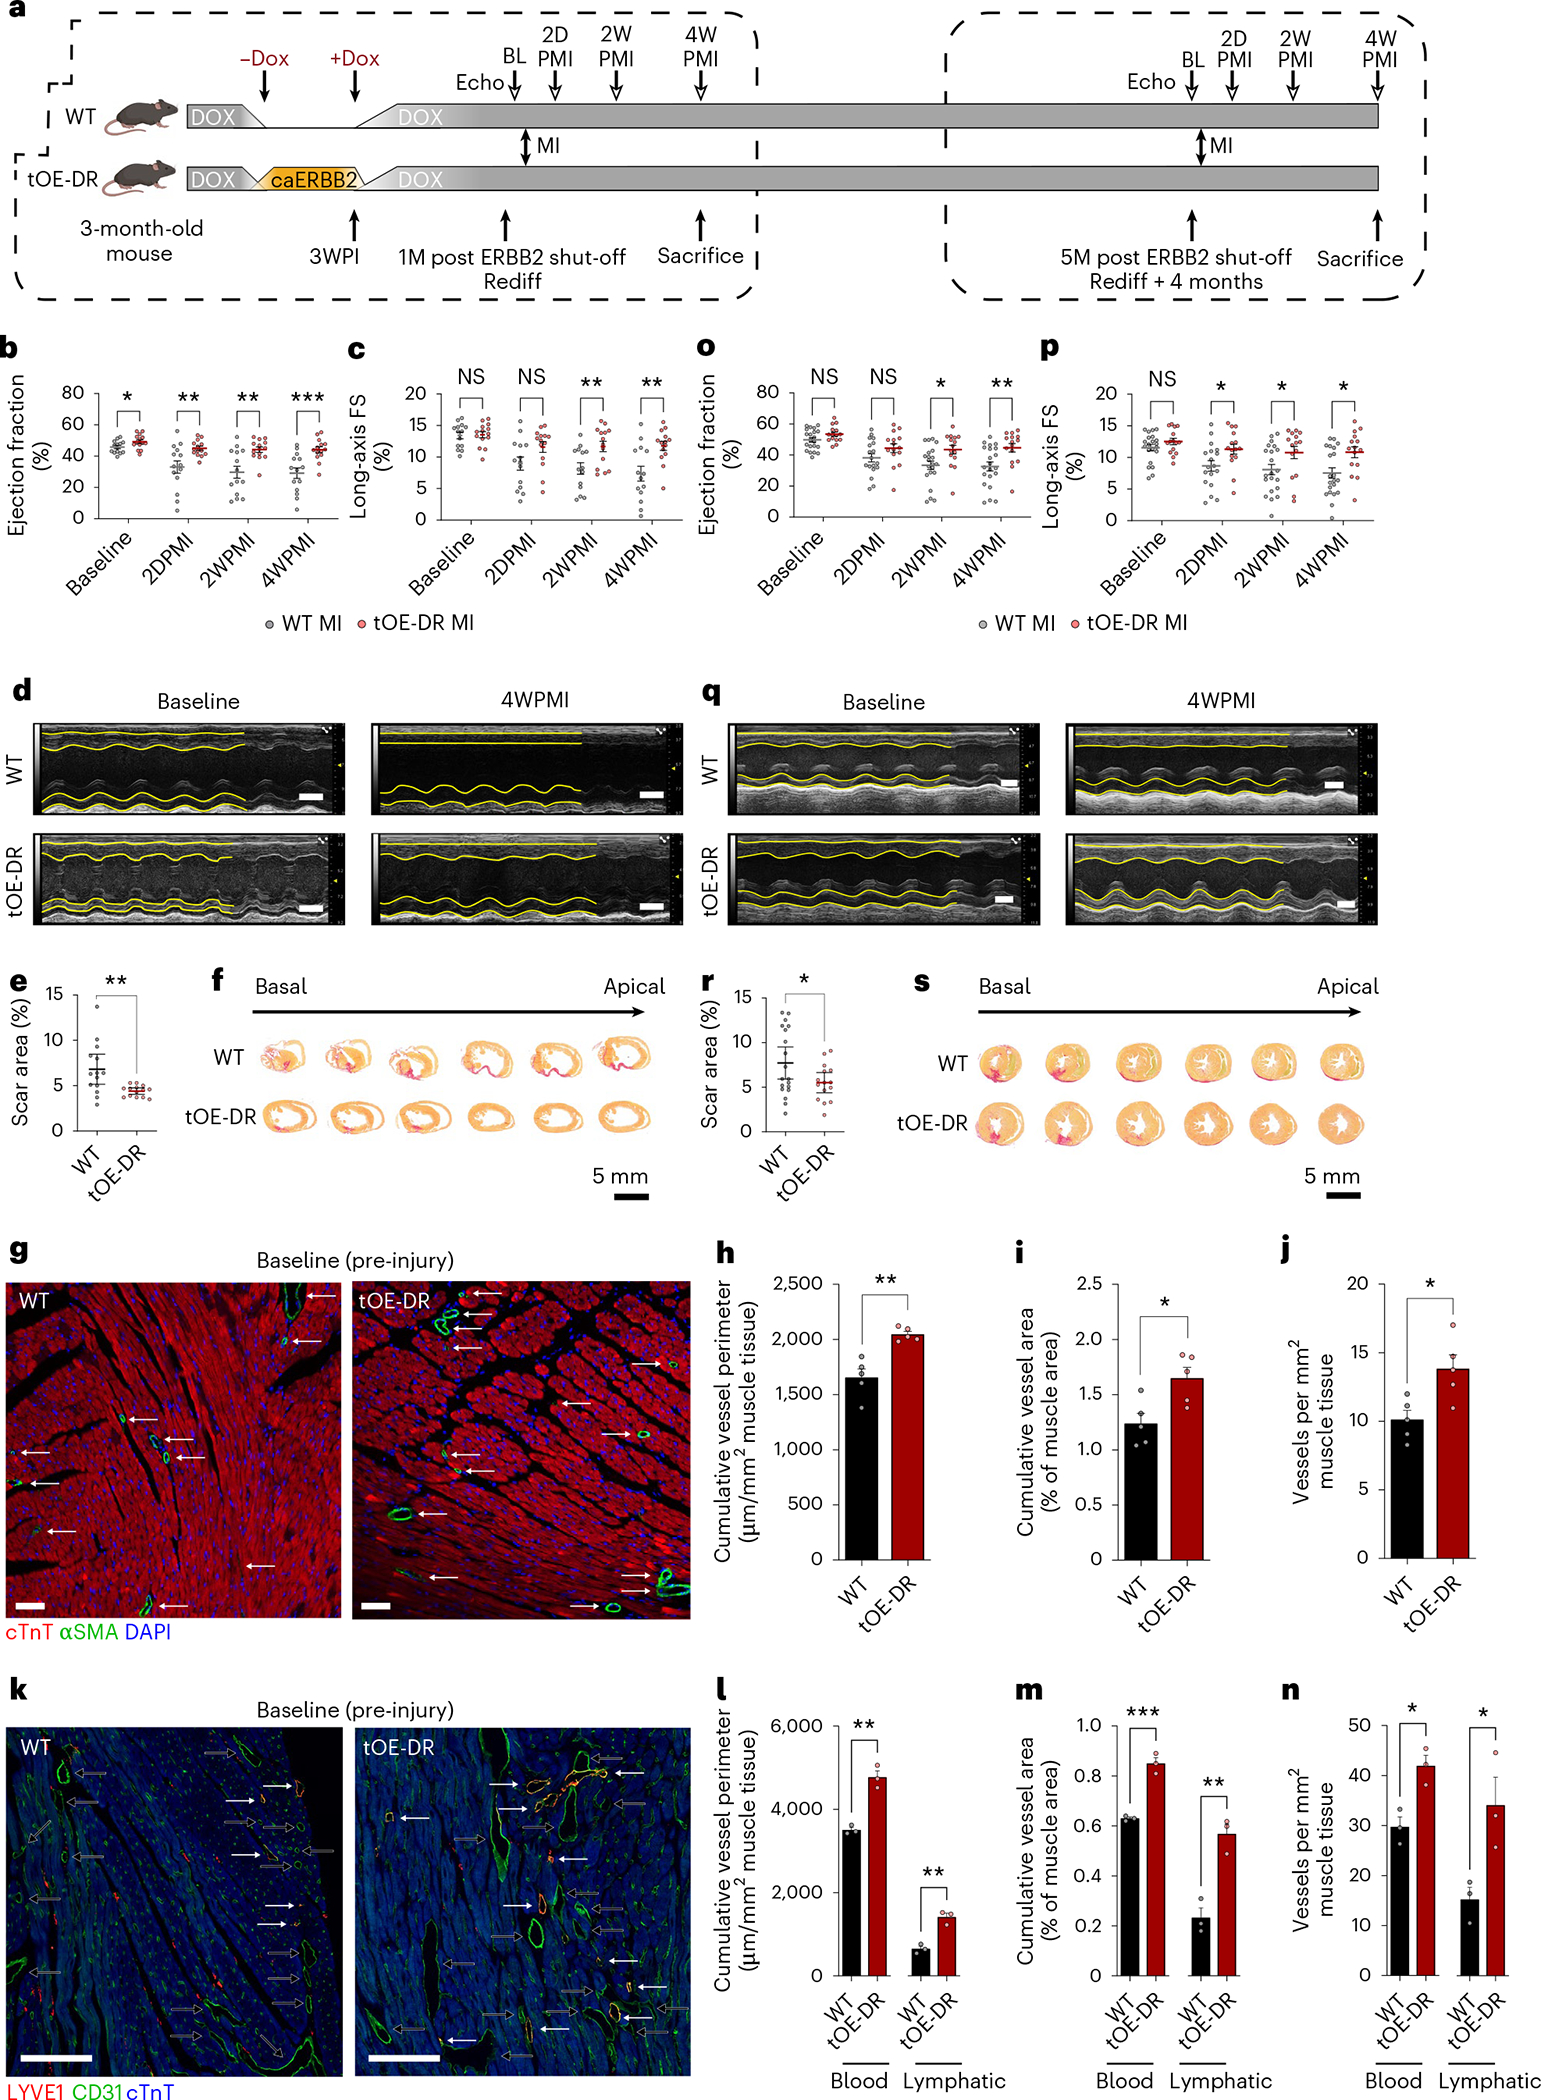
a, Schematic of experimental layout. MIs performed on WT and tOE-DR mice at the Rediff timepoint and Rediff + 4 months timepoint. 1M, 1 month; 2D, 2 days; 2W, 2 weeks; 4W, 4 weeks; 5M, 5 months; BL, baseline; PI, post induction (of caERBB2). White arrowheads represent timepoints for echocardiography. b,c, Ejection fraction (b) and long-axis FS (c) of WT and tOE-DR mice, measured by echocardiography. n = 14 mice for each group. For WT versus tOE-DR in b, baseline P = 0.044046, 2DPMI P = 0.00776, 2WPMI P = 0.001946, 4WPMI P = 0.000643. For WT versus tOE-DR in c, baseline P = 0.875220, 2DPMI P = 0.06279, 2WPMI P = 0.008703, 4WPMI P = 0.003645. d, Representative M-mode images. Yellow lines trace wall contractility. Top wall: anterior; bottom wall: posterior. Scale bars, 2 mm. e,f, Scar area quantification (e) and sequential Sirius Red-stained sections (f) from representative WT and tOE-DR hearts at 4WPMI. n = 14 mice for each group. For WT versus tOE-DR in e, P = 0.0050. g–j, Representative ɑSMA-stained sections highlighting vessel density and size (g), scale bars, 100 μm, cumulative vessel perimeter (h) and area (i) and vessel density (j) for WT (27.5 mm2 tissue quantified across n = 5 mice) and tOE-DR (29.3 mm2 tissue quantified across n = 5 mice). k–n, Representative CD31- and LYVE1-stained sections highlighting density and size, of blood (black arrows) and lymphatic vessels (white arrows) (k), scale bars, 100 μm, cumulative vessel perimeter (l) and area (m) and vessel density (n) for WT (blood vessels = 8.4 mm2 and lymphatic vessels = 47.0 mm2 tissue quantified across n = 3 mice) and tOE-DR (blood vessels = 10.6 mm2 and lymphatic vessels = 47.2 mm2 tissue quantified across n = 3 mice). o,p, Ejection fraction (o) and long-axis FS (p) of WT and tOE-DR mice 5 months after ERBB2 shut-off, measured by echocardiography. n = 21 mice for WT, n = 16 mice for tOE-DR. For WT versus tOE-DR in o, baseline P = 0.083128, 2DPMI P = 0.12091, 2WPMI P = 0.017416, 4WPMI P = 0.006137. For WT versus tOE-DR in p, baseline P = 0.191669, 2DPMI P = 0.029568, 2WPMI P = 0.040849, 4WPMI P = 0.010612. q, Representative M-mode images. Scale bars, 2 mm. r,s, Scar area quantification (r) and sequential Sirius Red sections (s) from representative WT and tOE-DR (5 months after ERBB2 shut-off) hearts at 4WPMI. n = 19 mice for WT, n = 15 mice for tOE-DR. In all panels, numerical data are presented as mean ± s.e.m. Statistical significance was calculated using two-tailed unpaired Student’s t-test in b, c, e, h–j, l–p and r between the in-timepoint WT and tOE values. *P ≤ 0.05, **P < 0.01, ***P < 0.001, ****P < 0.0001.
Given the aforementioned effects of ERBB2 signaling on angiogenesis (Extended Data Fig. 2i–k), we wondered whether tOE-DR hearts had enhanced vascularisation before injury. To that end, we stained WT and tOE-DR uninjured heart sections for ɑSMA and found increased cumulative vessel perimeter and area (Fig. 3g–i). This was driven by an increase in vessel density (Fig. 3j) rather than average vessel size (Extended Data Fig. 8f). We then sought to distinguish between blood and lymphatic vessels, because the role of the latter in cardioprotection was recently reported24, and we previously noted increased cellular infiltration and immune-related pathway activation during ERBB2 signaling (Extended Data Fig. 2g,h). We found a similar result for both lymphatic vessels (CD31+LYVE1+) and blood vessels (CD31+LYVE1−) (Fig. 3k–n and Extended Data Fig. 8g,h). The increased cardiac vasculature induced by the pre-injury DR cycle could be a contributing factor to the observed cardioprotection, which is covered further in the discussion.
Another possible factor is the lack of GJA1, whose inhibition has previously been shown to be cardioprotective25–27. Because we found that GJA1 levels remained low, even 5 months after ERBB2 shut-off (Fig. 2i), we posited that the cardioprotection of a DR cycle may last longer than initially investigated. Therefore, we performed MI on 9-month-old WT and tOE-DR mice, 5 months after ERBB2 shut-off (Fig. 3a, right box), and found that the functional cardioprotective effect and reduced scarring indeed persisted, albeit to a slightly lesser extent (Fig. 3o–s, Extended Data Fig. 8i–m and Supplementary Movie 3). These results indicate that the differences between tOE-DR and WT hearts at the Rediff timepoint and beyond are sufficient to confer a powerful and enduring cardioprotection against ischemic injury.
ERBB2 signaling promotes a multifaceted negative feedback response
Although we demonstrated how tOE-DR and WT hearts behave very differently after injury, the fact that they behave so similarly under basal conditions is a testament to the remarkable journey that they undergo from a state of dedifferentiation to redifferentiation. We next asked what could drive such a marked phenotypic change over the course of redifferentiation. We previously showed that CM-restricted ERBB2 activation could drive Yap nuclear entry, despite Hippo pathway upregulation17. This led us to hypothesize that the Hippo pathway is being activated as part of a negative feedback loop and drives the redifferentiation process. Accordingly, we found that the Hippo pathway was activated (upregulation of MST1, LATS1, pLATS1, MOB1, pMOB1 and pYAP 112) during the Dediff timepoint and gradually returned to baseline by the Rediff timepoint (Fig. 4a–c), reflecting an alleviation in negative feedback signaling by the Hippo pathway. Because we previously reported a key role of ERK and AKT in ERBB2-mediated CM dedifferentiation3,17, we expanded our search for signs of negative feedback signaling to these two pathways as well as several others. Analysis of our RNA-seq data revealed an activation and ‘Return to Normal’ behavior in many of these negative feedback regulators, which have reported tumor suppressor activity, including Ptprv28, Ptprf29, Ptpn9 (ref. 30), Ptpn23 (ref. 31), Phlda1 (ref. 32), Phlda3 (ref. 33), Dusp5 (ref. 34), Dusp6 (refs. 35,36), Spry4 (ref. 37), Numbl38 and Nab2 (ref. 39) (Fig. 4d–f). To determine whether or not this finding was unique to our transgenic system, or occurred naturally, we analyzed previously published RNA-seq datasets40,41. We found that, just as the expression of negative feedback regulators subside when caERBB2 signaling is halted in our transgenic system, so too does their expression subside in WT mouse hearts from P0 to adulthood, as ERBB2 expression declines (Extended Data Fig. 9a)40. A similar pattern is also seen when only the myocyte fraction of the heart is assayed (Extended Data Fig. 9b)41. Interestingly, we also found a similar pattern with anti-angiogenic genes, such as Thbs1 (ref. 42), and various collagen precursors43, suggesting that ERBB2 induces a broad negative feedback response (Fig. 4g).
Fig. 4 |. ERBB2 signaling promotes a multifaceted negative feedback response.
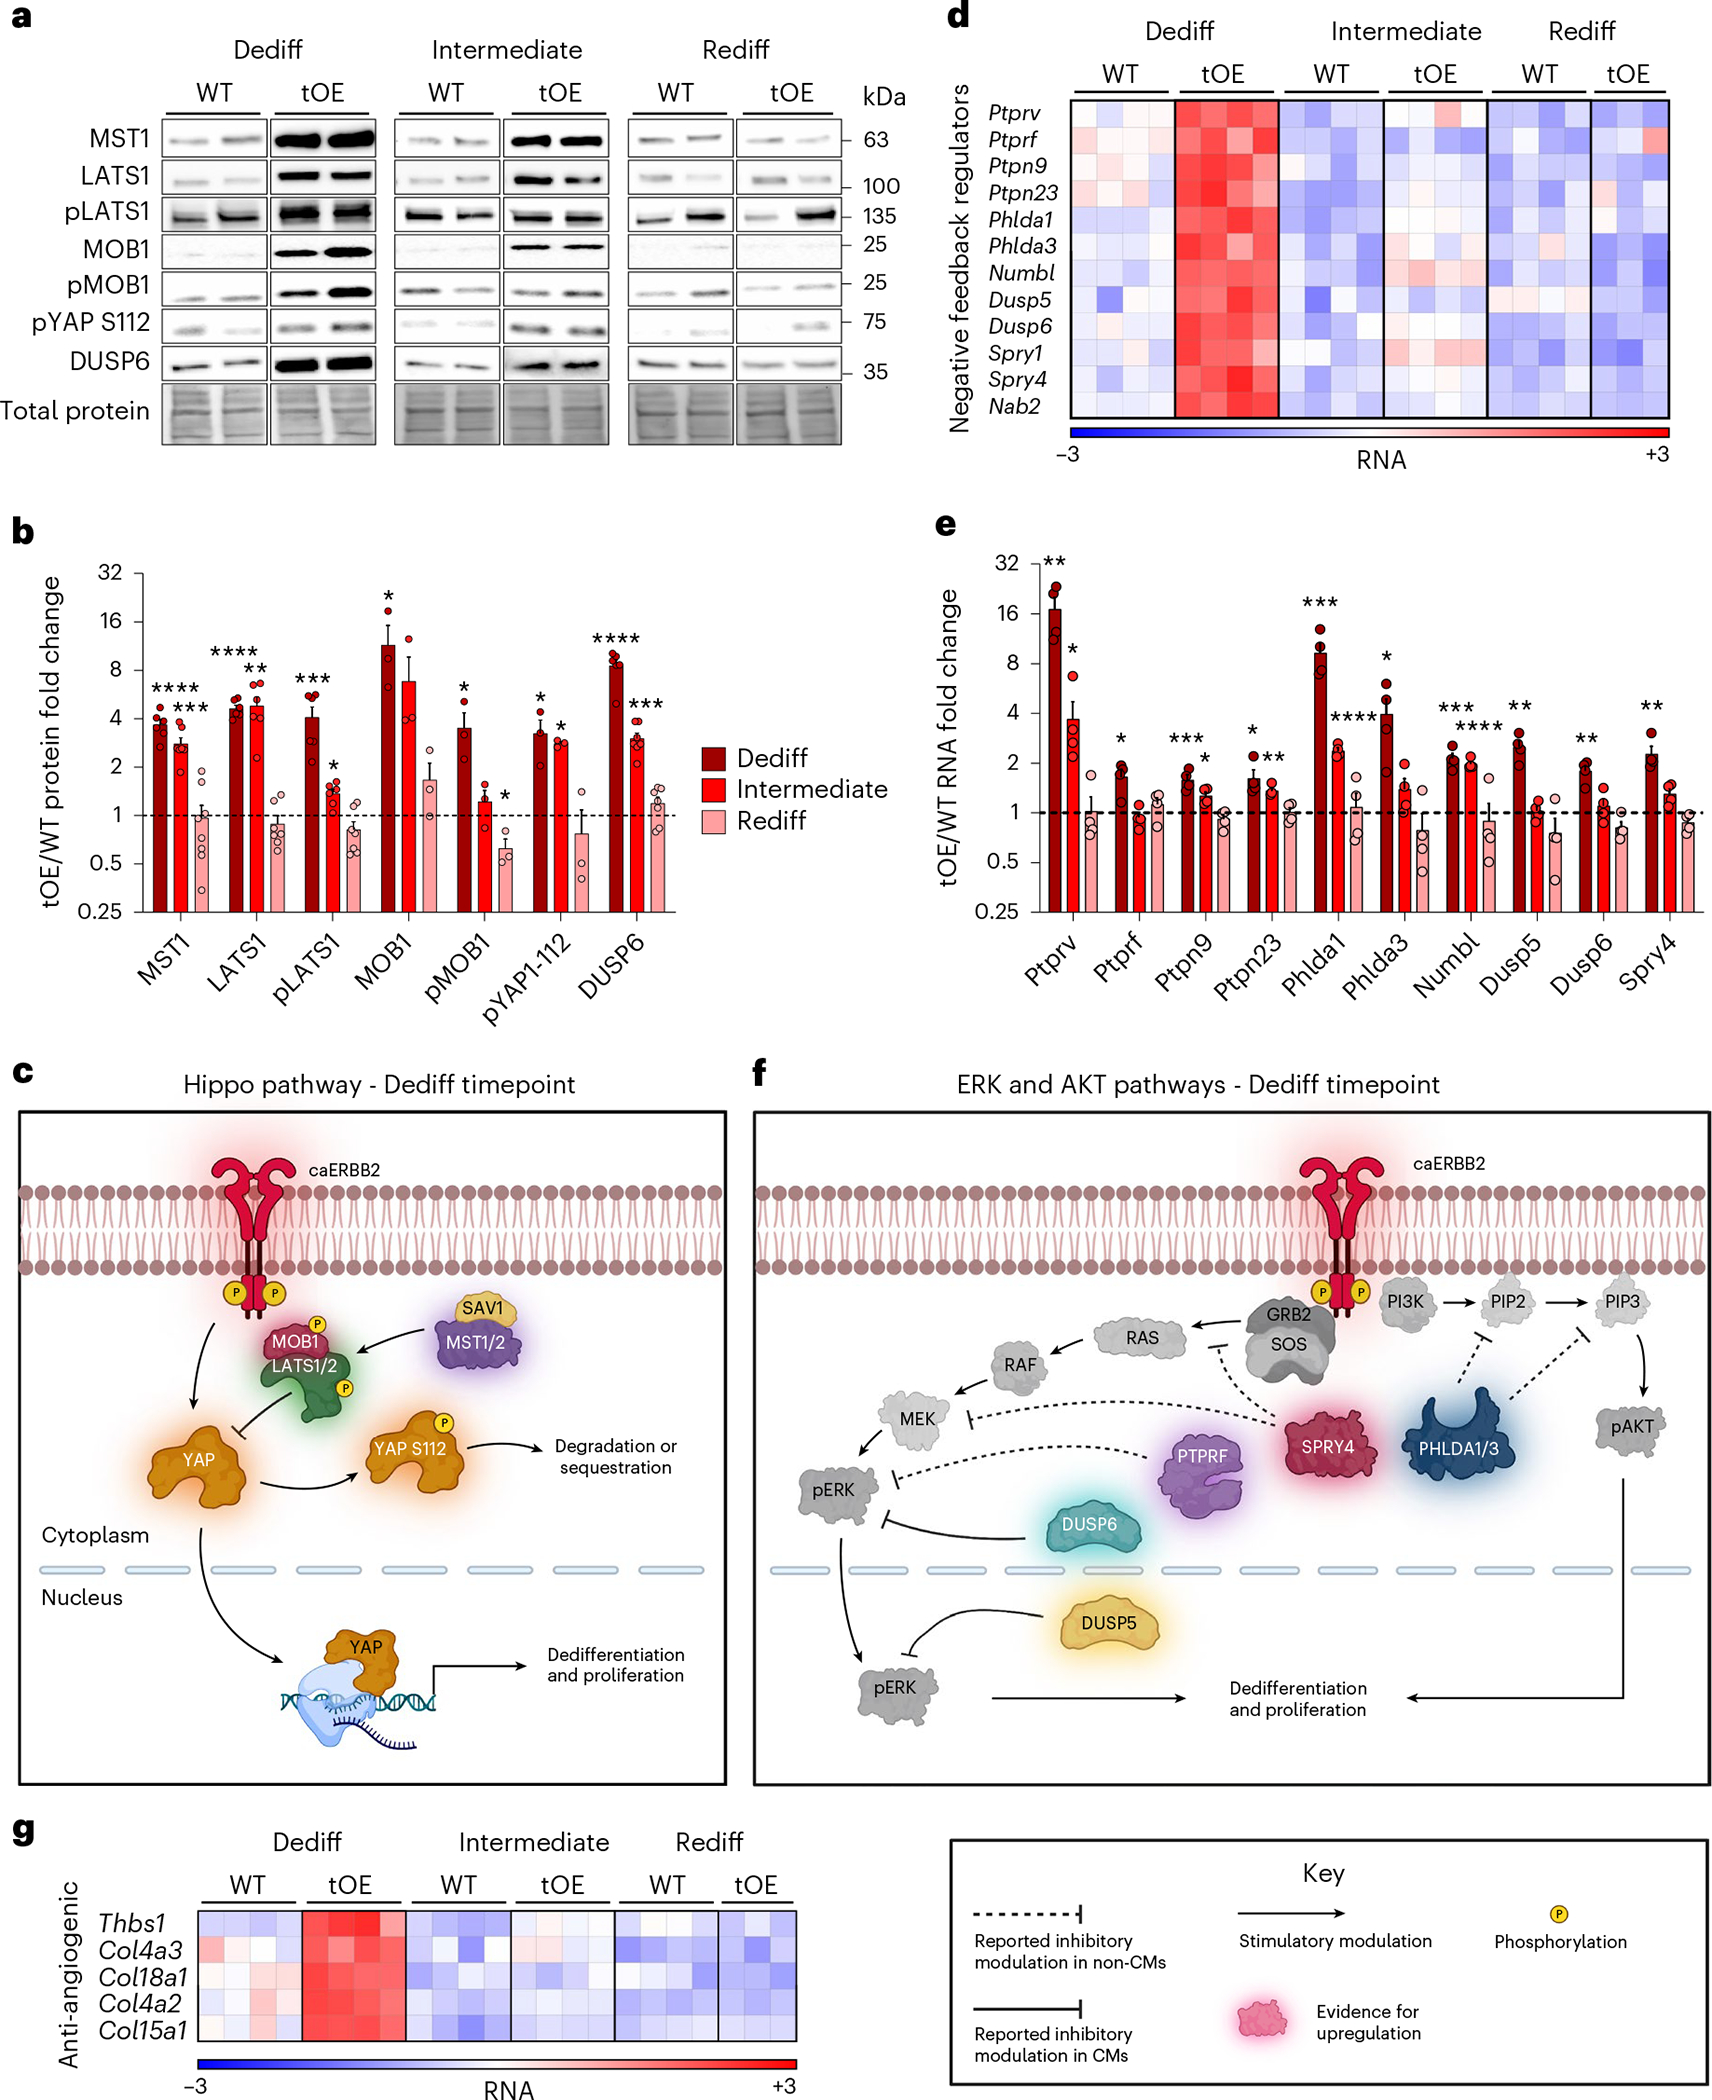
a,b, Representative western blot (a) and quantification (b) of whole heart lysates for Hippo pathway components and DUSP6 for WT and tOE adult heart lysates for each timepoint. n = 3–8 per group. c, Schematic of the Hippo pathway, incorporating western blot data from the Dediff timepoint. d, Heat map of negative feedback regulators, based on log2-transformed normalized counts from RNA-seq data. Rows represent genes. Columns represent each biological sample. Color bars represent z-score for each row across all timepoints. e, qRT–PCR from whole heart lysates for negative feedback regulators. Each value is normalized to the WT value of its corresponding timepoint. n = 4 per group. f, Schematic of ERK and AKT pathways, incorporating RNA-seq and RT–qPCR data from the Dediff timepoint. g, Heat map of anti-angiogenic regulators, generated in the same way as d. In all graph panels, numerical data are presented as mean ± s.e.m. Statistical significance was calculated using a two-tailed paired Student’s t-test in b and e between WT and tOE groups. *P ≤ 0.05, **P < 0.01, ***P < 0.001, ****P < 0.0001. Uncropped blots for a are provided in Supplementary Source Data.
Finally, we wondered whether this phenomenon was conserved in adult zebrafish, which readily regenerate their hearts after injury44. To answer this, we performed cryoinjury in adult zebrafish hearts and collected them for sectioning at 7 days after injury when CM proliferation peaks. A low-throughput screen using in situ hybridization (ISH) revealed that the Hippo pathway genes Lats1, Lats2 and Sav1 were not upregulated at the border zone, but the ERK1/2 negative feedback regulators Dusp6 and Spry4 were (Extended Data Fig. 9c,d), suggesting that the zebrafish may rely on different negative feedback mechanisms or that the Hippo pathway is activated post-translationally. To see whether or not this elevated expression was enriched in cycling CMs, we performed fluorescence in situ hybridization for both Dusp6 and Spry4 along with immunofluorescence for tropomyosin (CM marker) and PCNA (cell cycle activity marker). Every time either mRNA was detected, it was assigned to its nearest nucleus. By doing so, we scored CM nuclei for Dusp6 or Spry4 positivity as well as for PCNA. As expected, we found that both genes and PCNA were enriched in the border zone (Extended Data Fig. 9e–g). Crucially, however, we noted that the increase in Dusp6/Spry4 expression in the border zone occurred almost exclusively in PCNA+ CM nuclei (Extended Data Fig. 9e–g), indicating that their expression may be linked to an increase in cycling activity. Taken together, mitogenic signaling in mouse CMs promotes a potent negative feedback response, which may be conserved in zebrafish.
LATS1/2 negative feedback signaling is required for redifferentiation
To interrogate the biological function of negative feedback signaling in the context of redifferentiation, we treated WT and ERBB2-OE P7 cardiac cultures with the recently described LATS1/2 inhibitor TRULI45 (Fig. 5a). To capture true proliferation events (that is, with successful cytokinesis), we performed time-lapse microscopy of tdTomato-labeled CMs17 and validated with immunofluorescence. We found that, although TRULI had a negligible effect on the proliferation of WT CMs, it caused a substantial increase in the already proliferative OE CMs (Fig. 5b and Supplementary Movie 4). This pattern was consistent with staining for AurkB (Fig. 5c) and Ki67 (Extended Data Fig. 10a), suggesting that, in vitro, only when the Hippo pathway is activated in a negative feedback manner (in response to caERBB2) does its inhibition have any effect.
Fig. 5 |. LATS1/2 negative feedback signaling is required for redifferentiation.
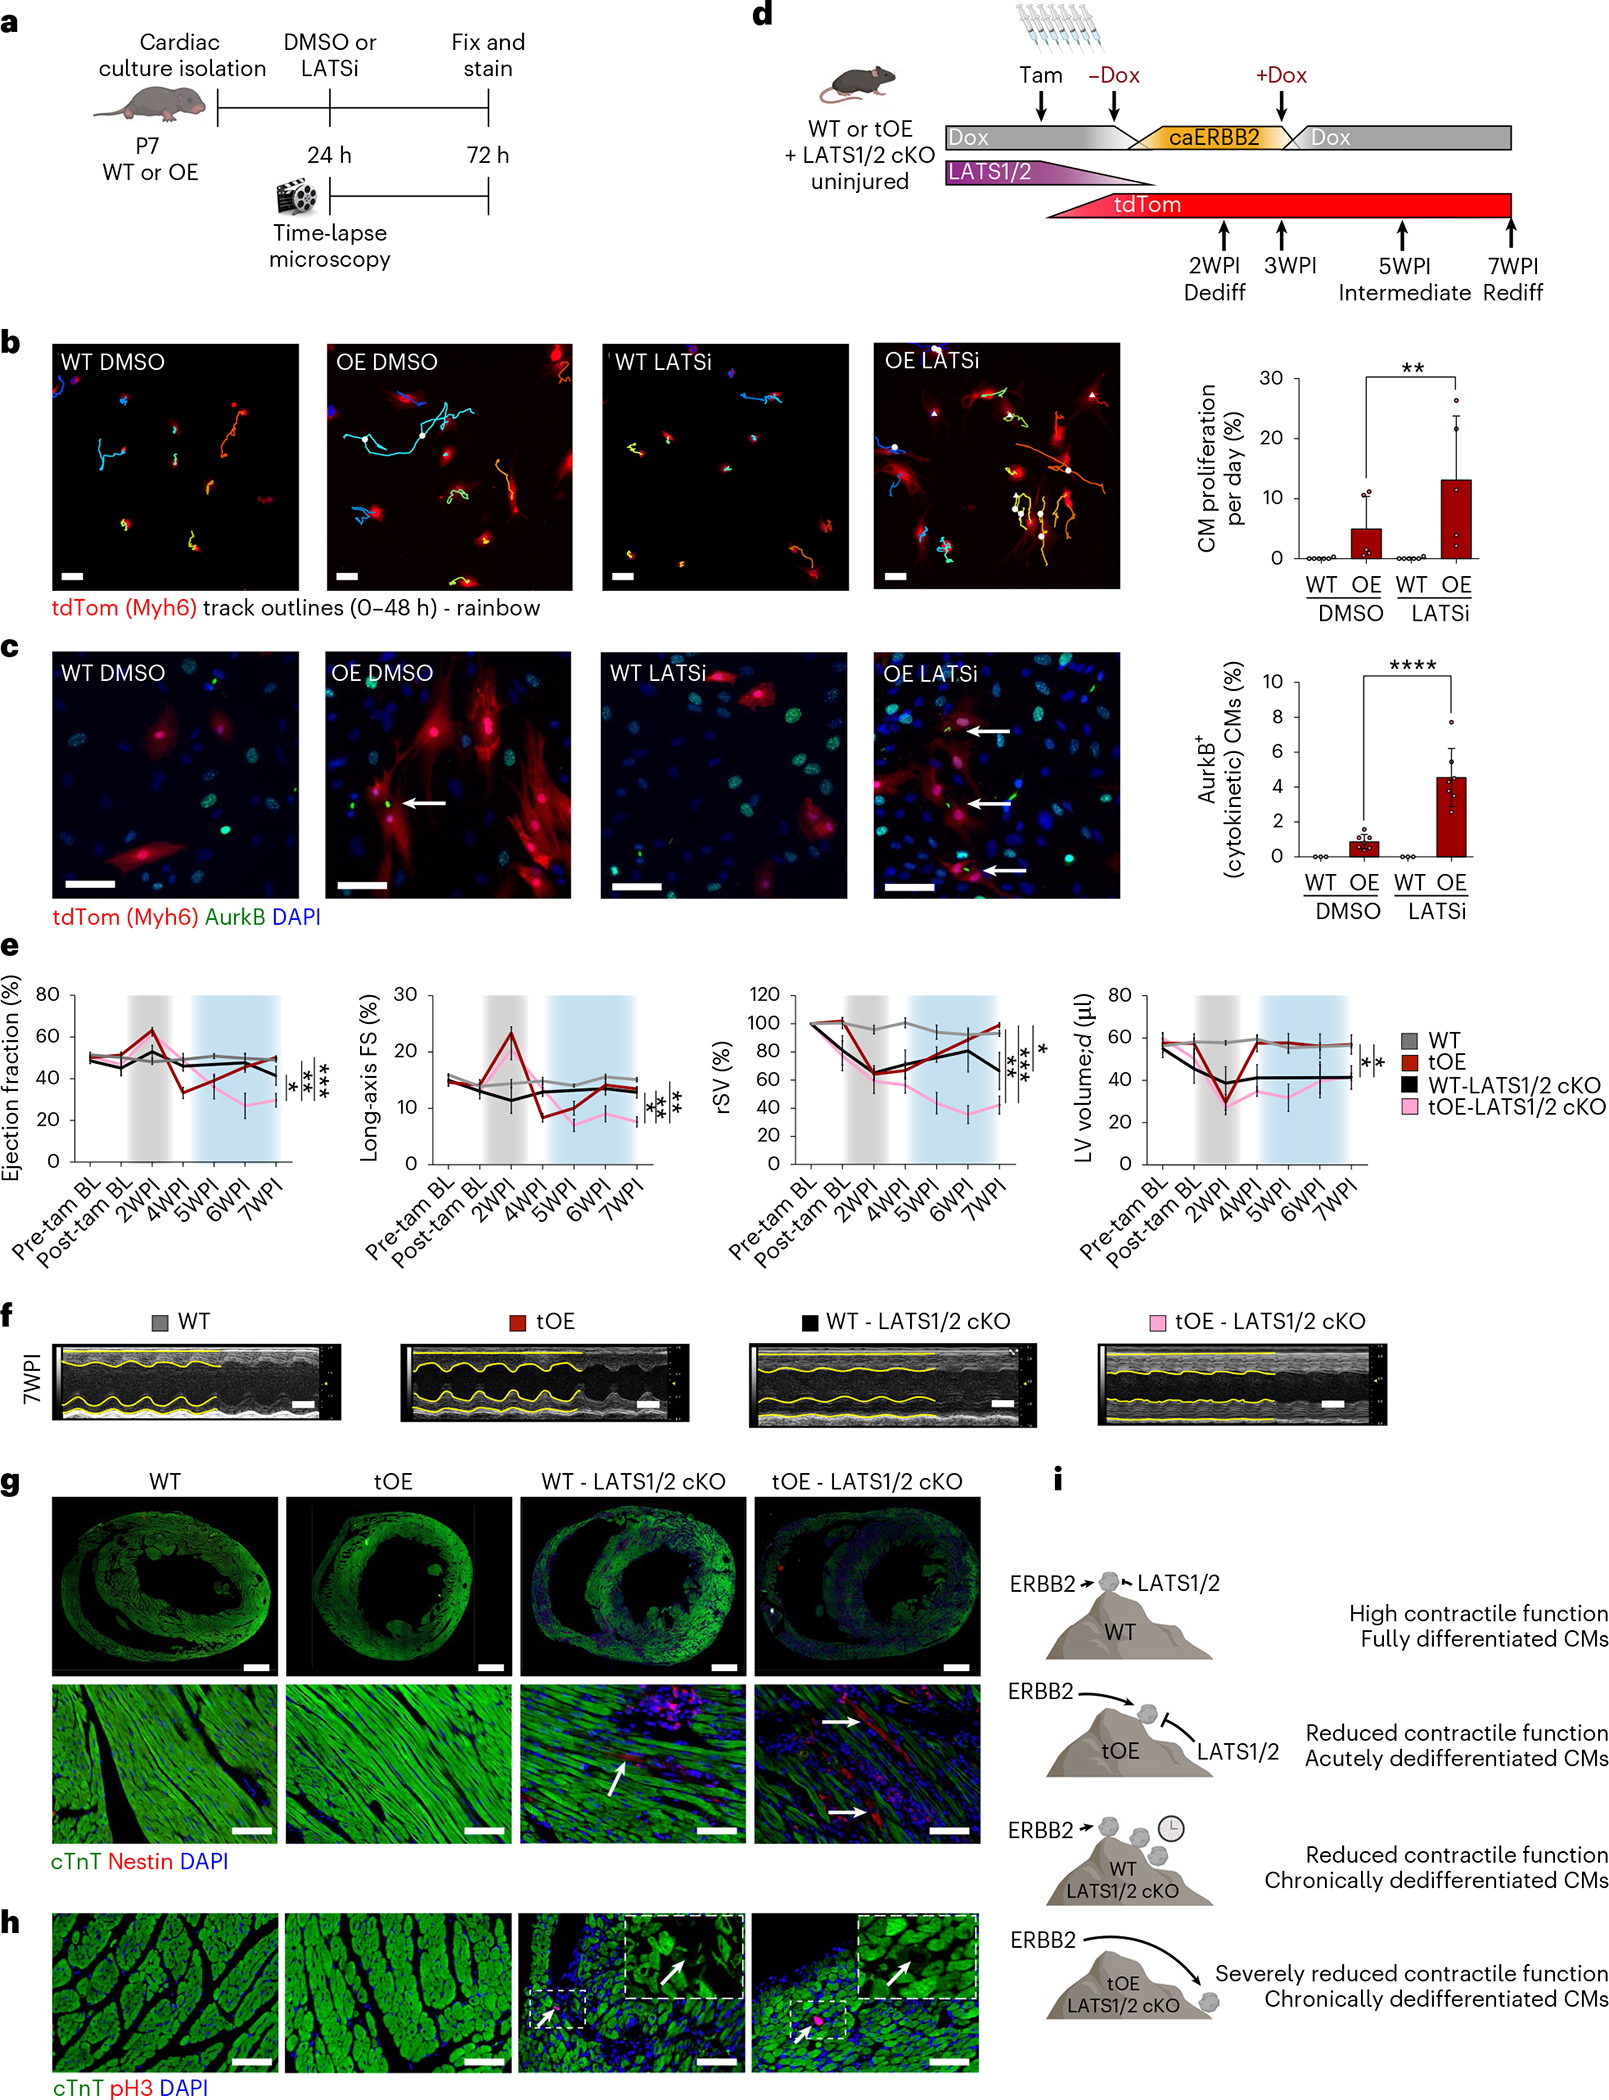
a, Schematic of experimental layout. b, Representative still images from first frame of 48-hour time-lapse movies of LATSi- or DMSO-treated WT and OE P7 CMs, with full quantification (n = 5–7 for each group). White triangles indicate mitosis without cytokinesis, and white circles indicate mitosis with cytokinesis. Colored tracks outline CM displacement. Scale bars, 100 μm. OE DMSO versus OE LATSi P = 0.0025. c, Representative immunofluorescence images for AurkB of groups stated in b with full quantification. All groups had minimum n = 3. Scale bars, 50 μm. OE DMSO versus OE LATSi P < 0.0001. d, Schematic of inducible caERBB2 expression system in adult mice with tamoxifen-inducible LATS1/2 cKO and tdTomato expression. e, Panels from left to right show ejection fraction, long-axis FS, rSV and left ventricular diastolic volume (LV volume, d) of WT, tOE, WT LATS1/2 cKO and tOE LATS1/2 cKO uninjured mice, measured by echocardiography. Gray shaded area represents the time period of caERBB2 activation. Blue shaded area represents the redifferentiation phase. n = 3–8 for each group. f, Representative M-mode images of the left ventricle in diastole and systole for WT, tOE, WT cKO and OE cKO uninjured mice at Rediff (7WPI). Yellow lines trace wall contractility. Scale bars, 2 mm. g,h, Representative immunofluorescence images of WT, tOE, WT cKO and tOE cKO uninjured hearts at Rediff for Nestin (g) and pH3 (h). For g, upper panel scale bars, 1 mm. For lower panel and h, scale bars, 50 μm. Arrows highlight CMs positive for either Nestin or pH3. n = 3 per group. i, Metaphorical model for the role of negative feedback signaling in redifferentiation. In all panels, numerical data are presented as mean ± s.e.m. Statistical significance was calculated using a paired two-way ANOVA followed by Sidak’s test in b and c; a one-way ANOVA followed by Tukey’s test in the three left-most panels of e; and Bonferroni’s test for the following hypotheses: tOE versus WT cKO and tOE versus tOE cKO in the right-most panel of e. *P ≤ 0.05, **P < 0.01, ***P < 0.001, ****P < 0.0001. 7WPI, 7 weeks post induction; tam, tamoxifen.
We next asked whether LATS1/2 played a role in counteracting ERBB2-mediated dedifferentiation in vivo and, by extension, whether its inhibition would prevent redifferentiation. To that end, we generated a mouse model that allows for CM-restricted LATS1/2 deletion8 (with tdTomato lineage tracing) using a Myh6-driven tamoxifen-inducible Cre in the background of transient ERBB2 overexpression (Fig. 5d). We injected mice that were WT, tOE, WT conditional knockout (cKO) (LATS1/2) or tOE cKO (LATS1/2) with tamoxifen for 7 days before transient ERBB2 induction (Fig. 5d). Successful LATS1/2 deletion was validated by western blot for pYAP S112 (a target residue of LATS1/2), whereby pYAP/Total YAP ratio was halved in the WT cKO and tOE cKO groups (Extended Data Fig. 10b,c). Echocardiographic analysis revealed that, unlike the tOE group, which undergoes robust functional improvement upon ERBB2 shut-off (that is, redifferentiation), tOE-cKO mice lacking LATS1/2 in CMs experienced a sustained and marked reduction in ejection fraction, fractional shortening (FS), rSV and LV volume (Fig. 5e,f and Supplementary Movie 5). WT cKO mice also experienced a decline in function but to a lesser extent (Fig. 5e,f). This pattern between the groups was paralleled by the presence of dedifferentiation phenotypes at the Rediff timepoint in the cKO groups, such as disassembled sarcomeres, Nestin+ CMs and pH3+ CMs, which were completely absent in the WT and tOE groups (Fig. 5g,h). This is consistent with other studies that show the role of the Hippo pathway in maintaining CM differentiation and maturity8,46. In summary, our findings suggest that, under basal conditions, LATS1/2 is able to maintain CM identity but can also be activated as a countering force in response to ERBB2 signaling. In doing so, it establishes a new equilibrium whereby CMs can proliferate but are able to redifferentiate upon signal cessation. If, however, LATS1/2 is disabled in combination with ERBB2 activation, dedifferentiation is maintained even after ERBB2 is shut off, and redifferentiation is prevented (Fig. 5i). Hence, LATS1/2 is required for CM redifferentiation.
Discussion
Physiologically, CMs that readily proliferate contract weakly, such as those of adult zebrafish or neonatal mammals. Conversely, CMs that do not readily proliferate, such as those found in adult mammals, contract strongly. This appears to be the evolutionary tradeoff adult mammals made to meet the high oxygen demands of their bodies47. It, therefore, stands to reason that, during mammalian heart regeneration, dedifferentiated CMs resembling those of neonates lose some of their contractile ability and, therefore, must undergo a return journey, redifferentiation, to recover their baseline function. Although there is growing appreciation of this process, it remains poorly understood1. Many studies have been published to date that claim heart regeneration by dedifferentiating CMs through an irreversible intervention, creating a paradox of regeneration without redifferentiation8–15. As awareness of this paradox has grown, more studies have begun to report the deleterious and lethal effects of persistent dedifferentiation2–6, and there has been a subsequent focus on transient interventions for heart regeneration5,48–50. It has been suggested that the process of dedifferentiation is reversible, based on the return to normal levels of individual markers after transient interventions in mouse5 or pig CMs48. Indeed, we too see many such markers return to normal, in line with declining ERBB2 levels and restoration of heart contractility. However, our high-throughput screens revealed a more complex picture, whereby a substantial number of genes and proteins remained or became differentially expressed at the Rediff timepoint, indicating that CM dedifferentiation is not completely reversible. Understanding the consequences of what does and does not return to baseline will be key in translating cardiac regeneration research to the clinic.
We found that hearts that underwent a DR cycle appeared rejuvenated, in that they had restored function, but showed lingering hallmarks of dedifferentiation, including remnants of cell cycle activity, EMT-like features and lower oxphos metabolism markers. The concept of rejuvenation, driven by a transient pulse of dedifferentiation, is intriguing and has recently also gained traction in the field of aging and regeneration of other organs51. We asked whether a DR cycle in CMs would be beneficial against future ischemic insult and found that such hearts were robustly protected for up to 5 months (demonstrated in 9-month-old mice), with preserved contractile function and reduced scarring. This bears similarity to the finding that apical resection in pigs at P1 extends the CM proliferative window and provides protection when injured again at P28 (ref. 52). We speculate several non-exclusive mechanisms for this effect. One is that the lingering dedifferentiation features, particularly those relating to reduced oxphos metabolism, are more accommodating to hypoxic conditions resulting from ischemic injury50,53. Another is that the greater blood and lymphatic vessel density allows the myocardium to draw oxygen supplies from a wider source and the immune system to respond to the damage more quickly. Another intriguing possibility stems from the role of calcium in the cell-to-cell propagation of necrosis originating from the initial ischemic event, analogous to the calcium-mediated ‘necrotic wave’ during Caenorhabditis elegans organismal death54. The marked reduction in GJA1 expression in tOE-DR hearts may block such signaling, which is normally mediated by GJA1 gap junctions25 and hemichannels26,27, and may share the same underlying mechanism for the cardioprotective effects of GJA1-blocking peptides55.
The significance of this finding is underscored by the medical community’s interest in prophylactic therapies for ischemic damage, such as ischemic preconditioning, which, despite being first reported over 30 years ago, has struggled to reach the clinic56. Currently, the strategy of inducing CM dedifferentiation for cardiac regeneration is being enthusiastically pursued, with ever more studies taking place in a preclinical setting6,48,49,57. Should it become a reality, after addressing numerous safety issues, these findings may lay the foundation for the use of transient CM dedifferentiation as a prophylactic measure rather than a post-injury treatment. It is important to note that we performed permanent LAD ligation in a mouse model, and it is still to be determined whether or not this finding would translate to the more clinically relevant ischemia–reperfusion model and in larger mammals.
During the dedifferentiation phase, we noted a profound and wide-ranging induction of negative feedback regulators, representing a robust resistance to mitogenic signaling, which subsided in step with ERBB2 levels. We also showed that this pattern is mirrored in WT mice from birth to adulthood, suggesting that negative feedback signaling in neonates may be important for CM differentiation and maturation. This finding may prove useful for researchers generating iPSC-derived CMs, whose efforts have been hampered by insufficient maturation58. The negative feedback signaling may also explain the paradox posed above, whereby irreversible dedifferentiation signals are eventually countered to stabilize heart function. This is consistent with a study in mice whereby overexpression of a cocktail of four cell cycle activators caused a burst of CM proliferation, which diminished rapidly after 1 week, in response to their increased proteasomal degradation16. A similar trajectory was seen after CM-specific deletion of the Hippo pathway component Salv, which caused an initial increase in cell cycle activity before waning in the weeks thereafter13. Nonetheless, the role of negative feedback signaling in regeneration as the driver of redifferentiation has not been previously established or studied. Here we showed that inhibiting or disabling negative feedback signaling via the major kinases LATS1/2 augmented dedifferentiation in vitro and sustained dedifferentiation in vivo, highlighting the necessity of LATS1/2 Hippo signaling for successful redifferentiation. In contrast to the widely accepted notion of CM terminal differentiation in the adult mammalian heart, our study adds to the growing body of evidence that Hippo signaling is actively required to maintain CMs in a differentiated state8,46. Although we focused our study on LATS1/2 and the Hippo pathway, we speculate that other negative feedback regulators are also important in redifferentiation, such as those that target ERK1/2, AKT and ERBB2 itself. DUSP5 (ref. 59) and DUSP6 (ref. 60), which dephosphorylate activated ERK1/2, are attractive candidates for playing a similar role in redifferentiation. Our findings are consistent with studies showing that Dusp5 or Dusp6 inhibition can further promote CM proliferation in zebrafish, mice and rats59–62.
Our study focused on the redifferentiation of the heart with an emphasis on CMs; however, it is clear from histological analysis that forced CM dedifferentiation affects many cell types and their relative composition in the heart. It will be equally important in the future to characterize all cells of the redifferentiated heart and the consequences of any irreversible changes. Understanding the mechanism behind the protective effect of a DR cycle will be crucial to refine any proposed therapeutic interventions.
Considerable damage was done to the field of cardiac regenerative medicine when researchers rushed to trial stem-cell-based cardiac regenerative therapies in humans, which inevitably failed owing to a poor understanding of the underlying mechanisms of regeneration63,64. Similarly, at a time when understanding of the first phase of cardiac regeneration—that is, CM dedifferentiation—is so advanced, it will be important to understand the second phase, redifferentiation, in sufficient detail before progressing to the clinic again.
Methods
Mouse experiments
Mouse experiments were approved by the Animal Care and Use Committee of the Weizmann Institute of Science (approval nos. 13240419–3 and 05850721–2), and the study is compliant with all of the relevant ethical regulations regarding animal research. Dox-inducible CM-specific caERBB2 overexpression was achieved by crossing the TetRE-caERBB2 mouse line65 (a B6SJLF1/J transgenic line in which the activated form of rat c-neu/erbB2 is placed under the control of a minimal CMV promoter and the tetracycline-responsive element) with an αMHC-tTA66, which expresses the tetracycline-responsive transcriptional activator (tTA) under the control of the human alpha myosin heavy chain promoter. The αMHC-tTA was originally created in the FVB background and was subsequently back-crossed into the C57BL/6 background. Dox hyclate-supplemented special diet (Harlan Laboratories, TD.02503, 625 mg kg−1) was fed to the mice ad libitum to repress transgene expression. To track the cardiac muscle cell lineage, we inter-crossed αMHC-Cre to ROSA26-tdTomato mice as previously described17.
For the Lats1/2 cKO mice, inducible-Cre mice (αMHC-MerCreMer, Jackson Laboratory, 005657) were crossed with Lats1/2 flox8,46 mice and then with αMHC-tTA all in one mouse, whereas TetRE-caERBB2 were crossed with Lats1/2 flox mice and ROSA26::tdTomato all in another mouse. These mice were crossed, and mice inheriting all transgenes were OE-cKO, and those lacking αMHC-tTA were WT cKO. A list of genotyping primers for the transgenes used in this study is provided in Supplementary Table 1.
MI
MI in adult mice was achieved by ligation of the LAD coronary artery as previously described3,17. In brief, mice were anaesthetized with isofluorane (Abbott Laboratories) and artificially ventilated after tracheal intubation. Lateral thoracotomy at the fourth intercostal space was performed by blunt dissection of the intercostal muscles after skin incision. After LAD ligation, the thoracic wall was closed and the incision sealed with Histoacryl (B. Braun Melsungen), and the mice were administered buprenorphine (0.066 mg kg−1) by subcutaneous injection as an analgesic and warmed until recovery.
Echocardiography parameters
Cardiac function was evaluated by transthoracic echocardiography performed on isofluorane (2–3%, Abbot Laboratories) sedated mice using the Vevo 3100 (VisualSonics, keeping the heart rate between 340 bpm and 510 bpm). Ejection fraction, systolic volume, diastolic volume and stroke volume were calculated from the long axis, whereas measurements for the left ventricular anterior wall and left ventricular posterior wall were calculated from the short axis, representing the papillary plane thickness. Parameters were calculated using Vevo Lab 3.2.6 software (VisualSonics, Build 15111). Mice with a 2-week ejection fraction value lower than 40% or higher than 90% of their baseline value were excluded from experiments in Figs. 1 and 5, as the injury was determined as either too severe for ERBB2 to induce regeneration or insufficient to be considered a true injury. No mice were excluded from experiments in Fig. 3, because they could not be distinguished from genuine cardioprotection or injury sensitivity. All analysis performed was blinded except for during ERBB2 overexpression, because the phenotype presents robustly in an identifiable manner.
RNA-seq
RNA-seq was performed as previously described17. In brief, RNA was extracted and purified from PBS-perfused, liquid-N2-frozen, powdered whole heart tissue using an miRNeasy kit (Qiagen, 217004) followed by library preparation (G-INCPM, Weizmann Institute of Science). Sequencing libraries were constructed and read using an Illumina HiSeq 2500 machine, using the Single-Read 60 protocol (version 4). Poly-A/T stretches and Illumina adapters were trimmed from the reads using cutadapt67, and reads that were shorter than 30 nucleotides were discarded. Reads were aligned to the mm10 mouse genome (STAR)68, supplied with gene annotations downloaded from Ensembl (and with EndToEnd option and outFilterMismatchNoverLmax set to 0.04). Expression levels for each gene were quantified using HTseq-count69. Differential expression analysis was performed using DESeq2 (1.6.3)70 with the betaPrior, cooksCutoff and independentFiltering parameters set to False. Raw P values were adjusted for multiple testing (Benjamini–Hochberg).
PCA was performed on the DESeq2 variance stabilizing transformed values of the 1,000 most variable genes (using the R Stats package). To create the dendrogram, hierarchical clustering was performed on the DESeq2 variance stabilizing transformed values of the 1,000 most variable genes. Pearson’s correlation was used as a distance metric with the Ward algorithm. The RNA-seq data discussed in this publication have been deposited in the National Center for Biotechnology Information’s Gene Expression Omnibus (GEO)71 and are accessible through GEO Series accession number GSE220612.
Proteomics
Proteomics was performed as previously described17. In brief, protein was extracted from the powder (see ‘RNA-seq’ subsection) by homogenization in SDT buffer supplemented with phosphatase and protease inhibitors. Samples were subjected to tryptic digestion followed by liquid chromatography separations as previously described72. Peptides were detected using mass spectrometry (Q Exactive Plus, Thermo Fisher Scientific), and the raw data were imported into Expressionist software (Genedata, version 9.1.3) and processed as described previously73. Data were searched against the mouse protein database downloaded from UniProtKB (http://www.uniprot.org/). Peptide identifications were imported back to Expressionist to annotate the identified peaks. Quantification of protein abundance from the peptide data was performed using an in-house script73, obtained by summing the three most intense unique peptides per protein. A Student’s t-test, after logarithmic transformation, was used to identify significant differences across the biological replicates. Fold changes were calculated based on the ratio of the arithmetic means of the experimental groups. PCA and hierarchical clustering were calculated by their respective functions in Perseus. The mass spectrometry proteomics data have been deposited to the ProteomeXchange Consortium via the PRIDE74 partner repository with the dataset identifier PXD038450.
Bioinformatics
The Ingenuity Pathway Analysis tool (Qiagen, October 2021 release) was used for the analysis of the RNA-seq and proteomics data using differential expression thresholds (as stated in the figure legend). The canonical pathway analysis grouped DE (tOE/WT) genes or proteins into GO terms/canonical pathways and provided an enrichment score, representing the ‘significance of the association between the dataset and a canonical pathway’, as ‘determined from a P value of overlap calculated using a right-tailed Fisher’s exact test’ (https://www.qiagen.com/-/media/project/qiagen/qiagen-home/content-worlds/ngs/documents/prom-15284-001_service-report_ipa_1119_ww.pdf), as well as a z-score, akin to effect size (whereby a score <−2 is predicted to be inactivated, and a score of >+2 is predicted to be activated). Heat maps were constructed using Morpheus (https://software.broadinstitute.org/morpheus). GO term enrichment for Rediff RNA-seq data was performed using PANTHER software75 (http://www.pantherdb.org, March 2022 release) testing for overrepresentation with a significance threshold of 0.05 for the adjusted q value.
RT–qPCR
RNA from whole hearts was isolated using an miRNeasy RNA extraction kit (Qiagen, 217004) according to the manufacturer’s instructions. A high-capacity cDNA reverse transcription kit (Applied Biosystems, 4374966) was used to reverse transcribe 2 μg of purified RNA according to the manufacturer’s instructions. The quantitative PCR reactions were performed using a Fast SYBR Green PCR Master Mix (Thermo Fisher Scientific, 4385614). Expression fold change values were calculated using the 2−ΔΔCt method using StepOne (Thermo Fisher Scientific, version 2.3). The oligonucleotide sequences used for RT–qPCR analysis performed in this study are listed in Supplementary Table 2.
Western blot analysis
Total tissue lysates were isolated using RIPA buffer supplemented with 1:100 protease (Sigma-Aldrich, P8340) and 1:100 phosphatase inhibitor cocktails (Sigma-Aldrich, P5726 and P0044). Protein concentrations were quantified by BCA assay (Thermo Fisher Scientific, 23225). The lysates were separated on 4–20% Mini-PROTEAN TGX Stain-Free gels (Bio-Rad) and wet transferred onto 0.44-μm PVDF membranes. The membranes were blocked and probed with primary antibodies according to the manufacturer’s instructions (detailed list in Supplementary Table 3). The results were visualized and analyzed using Image Lab software (version 6.1.0)
Immunofluorescence
Heart sections.
Hearts were briefly perfused in situ with ice-cold PBS for 30 seconds and then by 4% paraformaldehyde (PFA) for 1 minute, followed by overnight incubation shaking at 4 °C. The samples were then embedded in paraffin and cut into 5-μm-thick sections. Slides were deparaffinized, and heat-mediated antigen retrieval was performed using EDTA or citrate buffer, followed by 5 minutes of permeabilization (0.5% Triton X-100), 1 hour of blocking and the addition of primary antibodies in blocking solution (3% BSA and 10% heat-inactivated horse/goat serum (Biological Industries, 04–124-1A and 04-009-1A) in 0.1% Triton X-100) for overnight incubation at 4 °C (detailed list in Supplementary Table 4). A hydrophobic pen was used to draw a perimeter around the sections, promoting equal coverage of the antibody solution across all sections. Sides underwent three cycles of 10-minute PBS washes, followed by the application of secondary antibodies (Jackson Laboratory or Abcam) with DAPI for 40 minutes at room temperature. The slides were washed and mounted with Immu-Mount (Thermo Fisher Scientific, 9990402) and imaged on a Nikon Eclipse Ti2 microscope, analyzed using Fiji software (version 1.53) or Photoshop (2015 release) for cell counting.
P7 cardiac cultures.
Cells were fixed with 4% PFA for 12 minutes, followed by permeabilization with 0.5% Triton X-100 for 5 minutes and blocking with 5% BSA and 0.1% Triton X-100 for 1 hour. Primary antibody solution was prepared in blocking solution (detailed list in Supplementary Table 4) and incubated on an orbital shaker for 3 hours at room temperature. The cultures subsequently underwent three cycles of 10-minute PBS washes and incubated for 40 minutes with the appropriate secondary antibodies (Abcam or Jackson Laboratory) and DAPI. After an additional three cycles of 10-minute PBS washes, the cultures were imaged on a Nikon Eclipse Ti2 microscope.
Respiration and glycolysis
Measurements of live cellular respiration and ECAR were measured using the Seahorse XFe96 Analyzer (Agilent) according to the manufacturer’s instructions. P7 hearts were digested as described below, with an additional step to purify the culture for CMs (Miltenyi Biotec, 130-100-825). ECAR was measured using the Glyco Stress Test (Agilent, 103020–100), and oxygen consumption rate was measured using the Mito Stress Test (Agilent, 103015–100). Data were normalized to cTnT fluorescent staining intensity of Seahorse plate wells after the experimental runs in the Analyzer.
Optical mapping
Optical mapping was performed as previously described76,77. In brief, hearts were extracted from anaesthetized mice and washed in oxygenated (95%) 37 °C Tyrode’s solution. Once cannulated via the aorta, the heart was perfused with Tyrode’s solution with 20 mM 2,3-butanedione monoxime. Before measurement, the perfusate was spiked with 1 ml of 100 μM CytoVolt1 (Di-4-ANBDQBS) and 200 μM blebbistatin in Tyrode’s solution over the course of 2 minutes. Optical mapping was performed using a high-speed CCD-based technique (Evolve 512 Delta, Photometrics) with the hearts paced at a constant rate of 200CL. The X-Cite Turbo LED system served as a light source. ElectroMap software (original release) was used for analysis of optical signals. The data were viewed initially as dynamic displays showing the propagation of the activation wavefronts. Activation maps were then constructed by measuring the timing of electrical activation at each image pixel (timing of the maximum dF/dt).
Scar analysis
Scar quantification was performed in a blinded manner, based on Sirius Red staining of serial cardiac sections spanning the entire heart (imaged with Panoramic Scan II, 3DHISTECH). In each section, the area of fibrotic tissue as a percentage of the area of the left ventricle was measured using an in-house script within Fiji (1.53) (full script provided in the Supplementary Materials). This was then averaged across all sections. For scar class, each section was graded as having a transmural scar (that is, a scar spanning the entire width of the left ventricle at any point), a non-transmural scar or no scar. The number of sections for each category was expressed as a percentage of total sections on the slide.
Re-analysis of published datasets
Two different bulk RNA-seq datasets were reanalyzed in this study. The first, from O’Meara et al.40, contained data from whole heart lysates from P0, P4, P7 and adult mice (n = 2 per group) and was obtained in a completely analyzed form with FPKM values. The second, from Quaife-Ryan et al.41, was generated by separating myocyte and non-myocyte fractions of dissociated hearts, before FACS sorting the non-myocyte fractions into endothelial cells, fibroblasts and immune cells. Raw data were downloaded from the GEO database (GSE95755). A count matrix for each gene was quantified using HTseq-count69 on union mode, and differential expression analysis was performed with EdgeR (version 3.2.4)78.
Zebrafish cryoinjury
All zebrafish experiments were conducted under the guidelines of the animal welfare committee of the Royal Netherlands Academy of Arts and Sciences. Adult zebrafish (Danio rerio) were maintained, and embryos were raised and staged as previously described79,80. Tüpfel longfin (WT) between 6 months and 1 year were subjected to cryoinjury as previously described81. In brief, anaesthetised fish (0.02% tricaine) were placed on a moistened sponge. After skin puncture at the posterior medial margin, the ventricle was exposed by an incision between the peritoneal–pericardial junction and 2/3 of the way up the heart in an anterior direction. Cryoinjury was achieved by placing a 0.3-mm-diameter nitrogen-cooled copper filament on the posterior tip of the ventricle for 10 seconds.
Zebrafish ISH and FISH
At 7 days after injury, hearts were extracted and fixed in 4% PFA overnight at 4 °C. Hearts were then washed 3× in 4% sucrose/PBS and allowed to equilibrate in 30% sucrose/PBS at 4 °C for 5 hours. Hearts were then suspended in Tissue Freezing Medium (Leica) and frozen with dry ice. Blocks were cryosectioned at 10 μm at −20 °C. Slides were subjected to the in situ hybridization protocol as previously described18 with the exception of using Fast Red (Sigma-Aldrich) to develop the signal. In brief, sections were pre-treated for 70 °C in 2× SSC for 10 minutes before a 5-minute wash step in ultrapure water. Digestion in 0.1% pepsin (in 0.01 N HCl) was performed for 10 minutes, followed by two 0.2% glycine/PBS rinses, two 5-minute washes in ultrapure water and a 5-minute blocking step in 10 mM dithiothreitol. Hybridization was achieved by overnight incubation in 50% formamide, 10% dextran sulphate, 2× SSC, 2× Denhardt’s solution, 0.1% Triton X-100, 50 mM dithiothreitol and 200 ng μl−1 salmon sperm DNA, at 54 °C. After hybridization, sections were washed twice in 1× SSC in 50% formamide and then without formamide. In situ probes were made by PCR with T7 RNA polymerase using the primers listed in Supplementary Table 5. Once the in situ stain was developed, slides were immediately washed in PBST and an antigen retrieval step with 10 mM sodium citrate at 84 °C for 15 minutes, permeabilized with 0.1% collagenase II in PBS with 0.1% Tween 20 and blocked for at least 30 minutes in PBS containing 10% FCS, 1% DMSO and 0.1% Tween 20. Primary antibodies (PCNA, Dako, M0879 1:800 dilution; tropomyosin, Sigma-Aldrich, T9283, 1:500 dilution) were diluted in blocking buffer overnight at 4 °C, followed by 3× washes in PBS with 0.1% Tween 20 and incubation with Alexa Fluor secondary antibodies at 1:500 dilution and DAPI. Slides were imaged on a VS200 slide scanner (Olympus) or LSM900 confocal (Zeiss). Due to anti-tropomyosin primary antibody cross-reactivity with PCNA, we performed post-acquisition processing of images to dampen the artifactual tropomyosin signal in overlapping regions—that is, PCNA+ nuclei—to a uniform intensity matching that of the cytoplasmic regions. This procedure was performed uniformly in all acquired images and was used only for illustrative purposes. Quantification was performed on unprocessed images.
CM isolation and culture
CM isolation and culture were performed as previously described17. In brief, cardiac cultures were isolated from P7 mice using a neonatal dissociation kit (Miltenyi Biotec, 130-098-373) and the gentleMACS homogenizer, according to the manufacturer’s instructions, and cultured in ‘complete medium’ at 37 °C in 5% CO2 for 24 hours, before being replaced by ‘starvation’ media for an additional 48 hours. To inhibit LATS1/2, the LATS1/2 inhibitor TRULI45 was used at a final concentration of 10 μM in the ‘starvation’ media. For LATS1/2 cKO, pups were administered a daily subcutaneous injection of 10–20 μl tamoxifen (10 mg ml−1) from P3 to P7. After isolation, cells were cultured in the media described above supplemented with 10 μM tamoxifen (Sigma-Aldrich, T5648).
Time-lapse movie and single-cell tracking
P7 WT, OE, WT cKO or OE cKO cardiac cultures tagged with tdTomato fluorescent protein were cultured as described above. After 24 hours, the medium was replaced, and time-lapse imaging began for 48 hours, with images acquired every 10 minutes. Proliferation was expressed as a percentage of full CM cell division events divided by the number of CMs per field by the last frame.
Statistics and reproducibility
All experiments were carried out with n ≥ 3 biological replicates. When n is expressed as ≥3, it refers to an experiment where, at the beginning, there were many biological replicates (for example, 12), with some animals being sacrificed at an early timepoint; the second timepoint, therefore, will have fewer replicates and the third timepoint even fewer. Experimental groups were balanced for animal age, sex and weight. The animals were genotyped before the experiment, caged together and treated in the same way. Statistical analyses were carried out using GraphPad Prism software (version 6.0.1). When comparing between two conditions, data were analyzed using a two-tailed Student’s t-test (unless otherwise mentioned). When comparing more than two conditions, we employed an ANOVA analysis with multiple comparisons. In bar plots comprising color-coded dots (such as in Fig. 2c), the dots represent data points derived from different biological repeats to demonstrate the distribution of data across different experiments. The statistical analysis is derived from the biological repeats of an experiment. Measurements are reported as the mean, and the error bars denote the s.e.m. throughout the study. The threshold for statistical significance was considered as *P ≤ 0.05, **P < 0.01, ***P < 0.001, ****P < 0.0001 and NS, not significant, as stated in the figure legends.
Extended Data
Extended Data Fig. 1 |. Hundreds of genes and proteins show differential expression after redifferentiation.
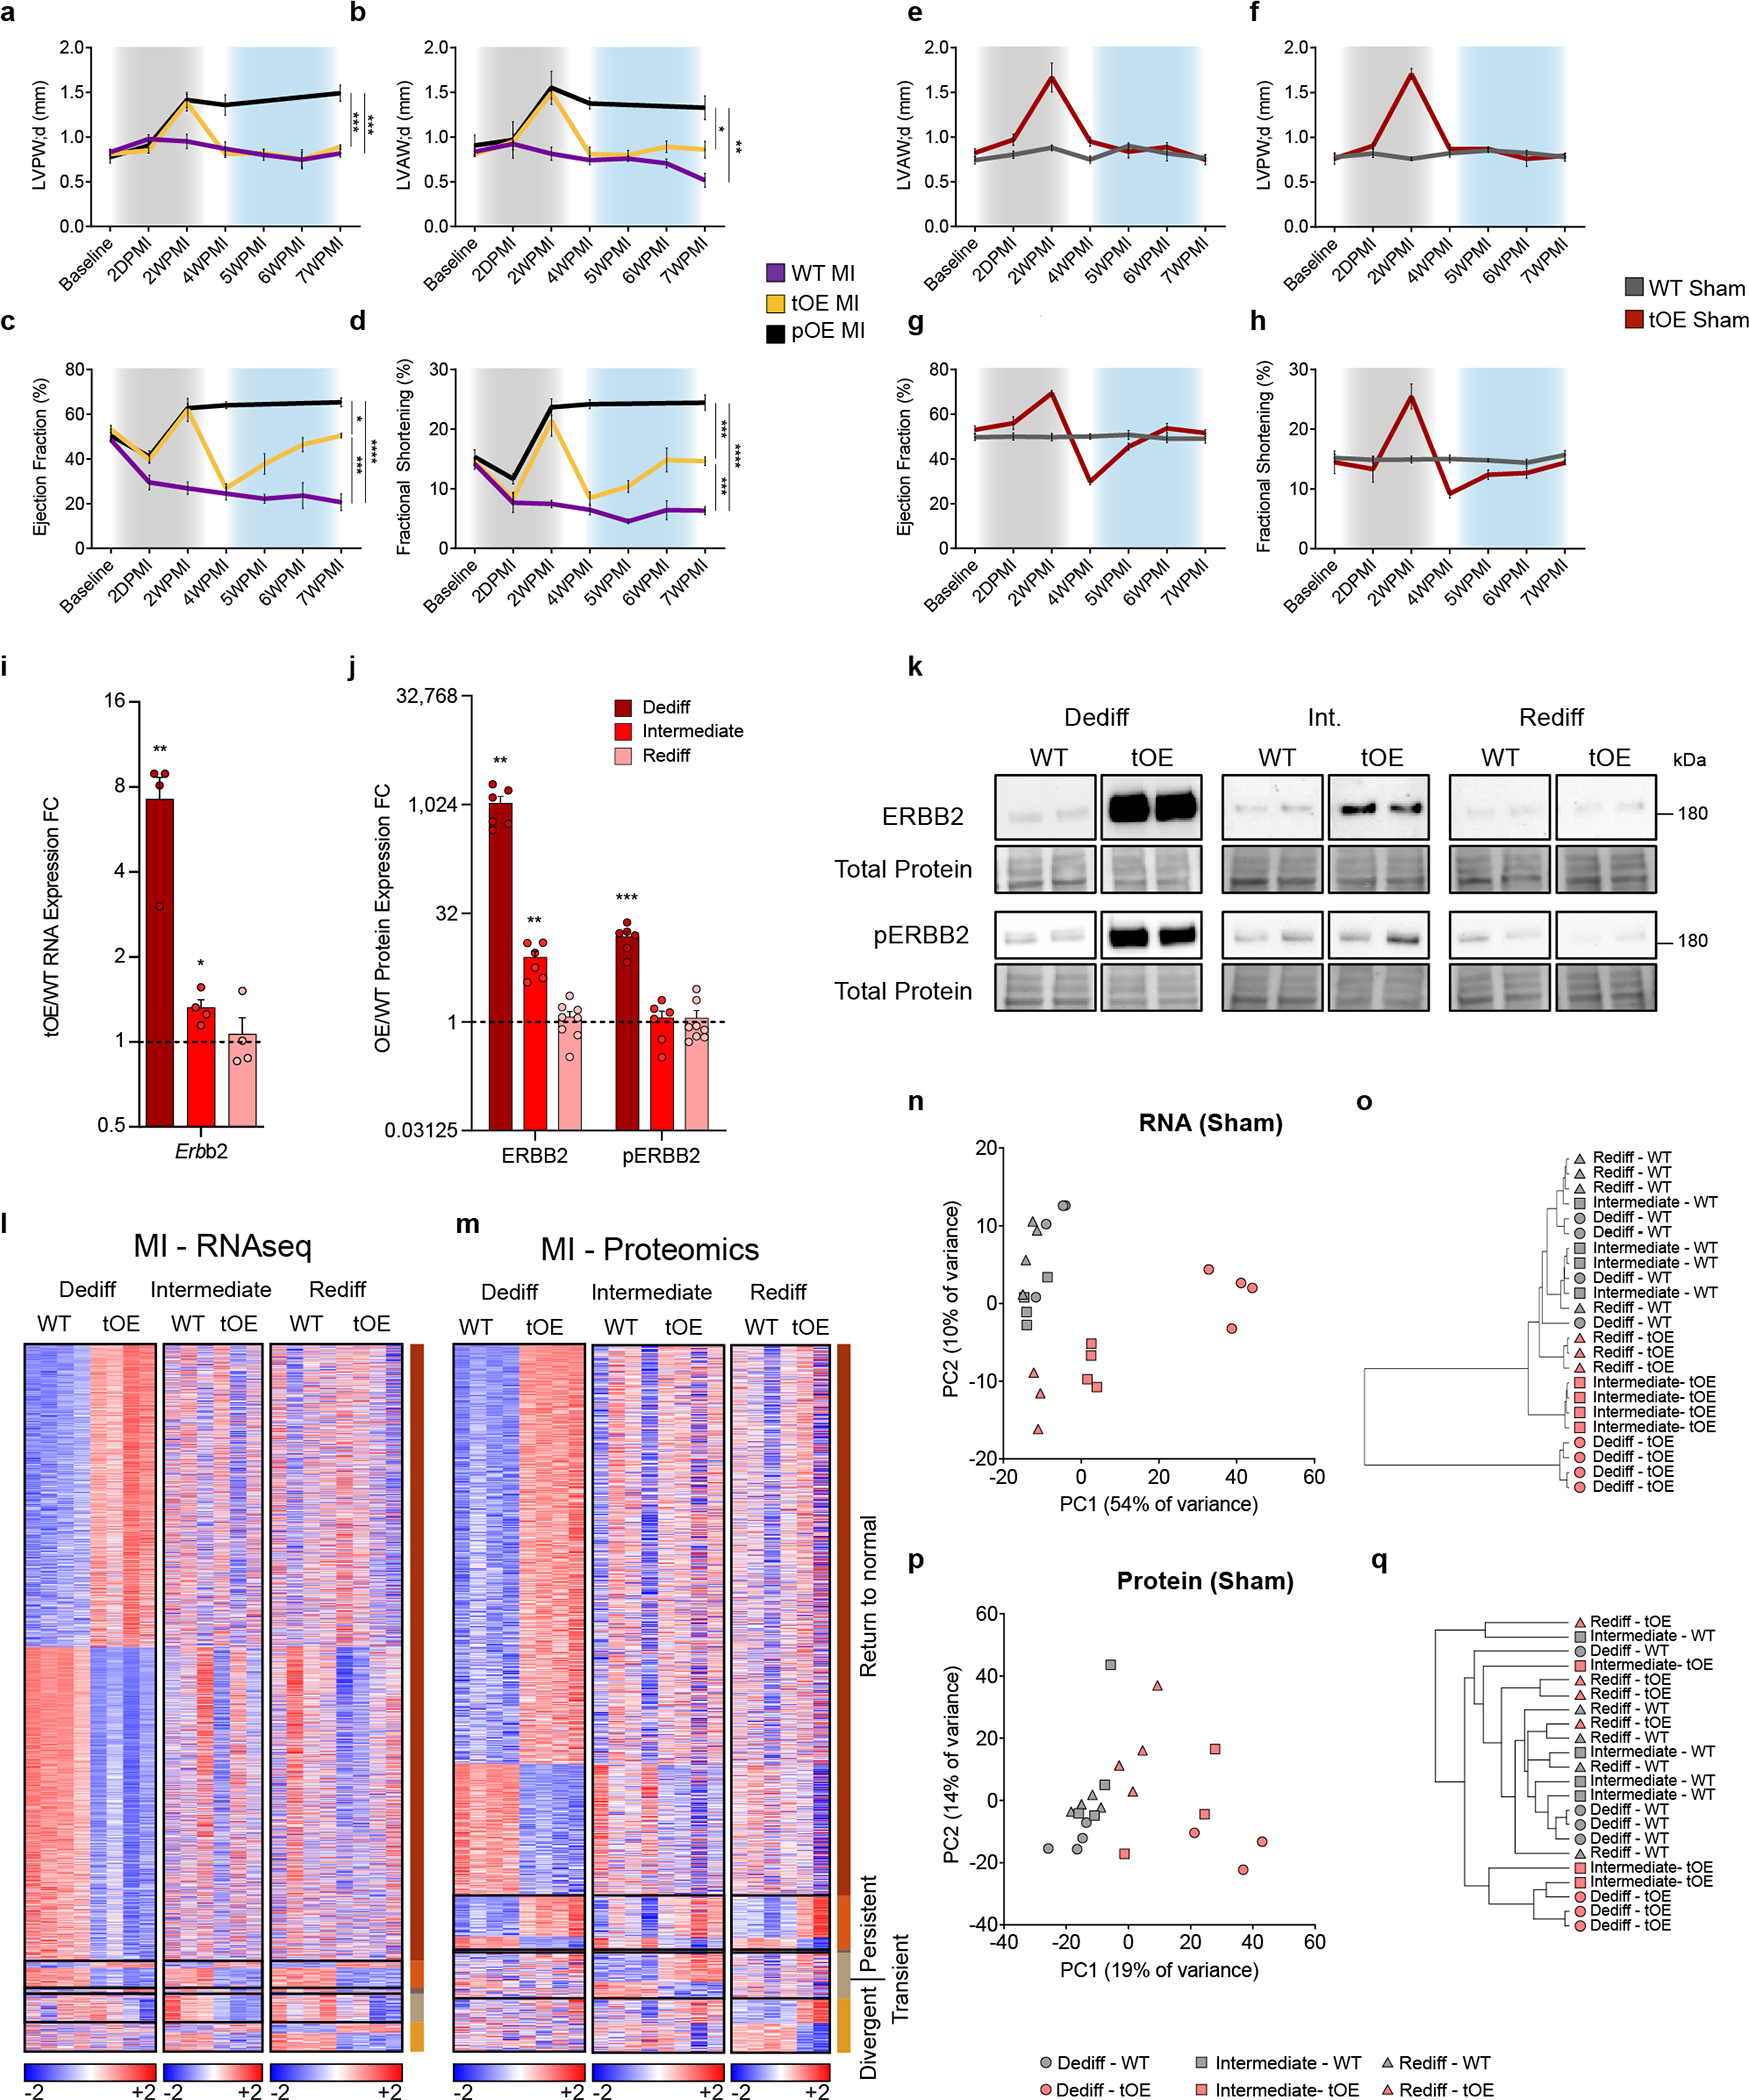
a–h, Left Ventricular Posterior Diastolic Wall thickness (LVPW;d) (a,f), Left Ventricular Anterior Diastolic Wall thickness (LVAW;d) (b,e), Ejection Fraction (c,g), and long-axis Fractional Shortening (d,h) of WT MI, tOE MI, pOE MI, WT Sham and tOE Sham mice, measured by echocardiography. Gray shaded area represents time period of caERBB2 activation (dedifferentiation). Blue shaded area represents the redifferentiation phase. Overall, n = 3 – 8 per group. For (a), WT MI vs pOE MI p = 0.0002, tOE MI vs pOE MI p = 0.0005, for (b), WT MI vs pOE MI p = 0.0018, tOE MI vs pOE MI p = 0.0461, for (c), WT MI vs pOE MI p = <0.0001, tOE MI vs pOE MI p = 0.0161, WT MI vs tOE MI p = 0.0001, for (d), WT MI vs pOE MI p = <0.0001, tOE MI vs pOE MI p = 0.0003, WT MI vs tOE MI p = 0.0005. i, RT-qPCR analysis of Erbb2 from sham WT and tOE adult heart lysates for each time point. All values are normalized to their in-time point average WT value (black dashed line). All groups had minimum n = 3. For WT vs tOE, Dediff p = 0.004606, Intermediate p = 0.016849. j, Western blot quantification of tOE/WT FC of ERBB2 and pERBB2 (Tyr-1248) protein. All values are normalised to their in-time point average WT value (black dashed line). n = 4 – 8 per group. For WT vs tOE for ERBB2, Dediff p = 0.00189, Intermediate p = 0.00551, for pERBB2, Dediff p = 0.00016. k, Representative western blot images of data from (j). l,m, Heatmaps of differentially expressed genes (l) and proteins (m) from MI-injured samples, compiled as described in Fig. 1g,h. n–q, Principal component analysis and dendrograms of sham RNAseq (n,o), and sham proteomics groups (p,q). In all panels numerical data are presented as mean ± SEM; statistical significance was calculated using one-way ANOVA with Sidak’s multiple comparison test at the 7WPMI time point in (a–h), two-tailed unpaired Student’s t-test between tOE and WT of each time point in (i,j). *p ≤ 0.05, **p < 0.01, ***p < 0.001, ****p < 0.0001. Uncropped blots for (k) are provided in supplementary source data.
Extended Data Fig. 2 |. Dedifferentiated phenotypes are largely reversed in functionally redifferentiated hearts.
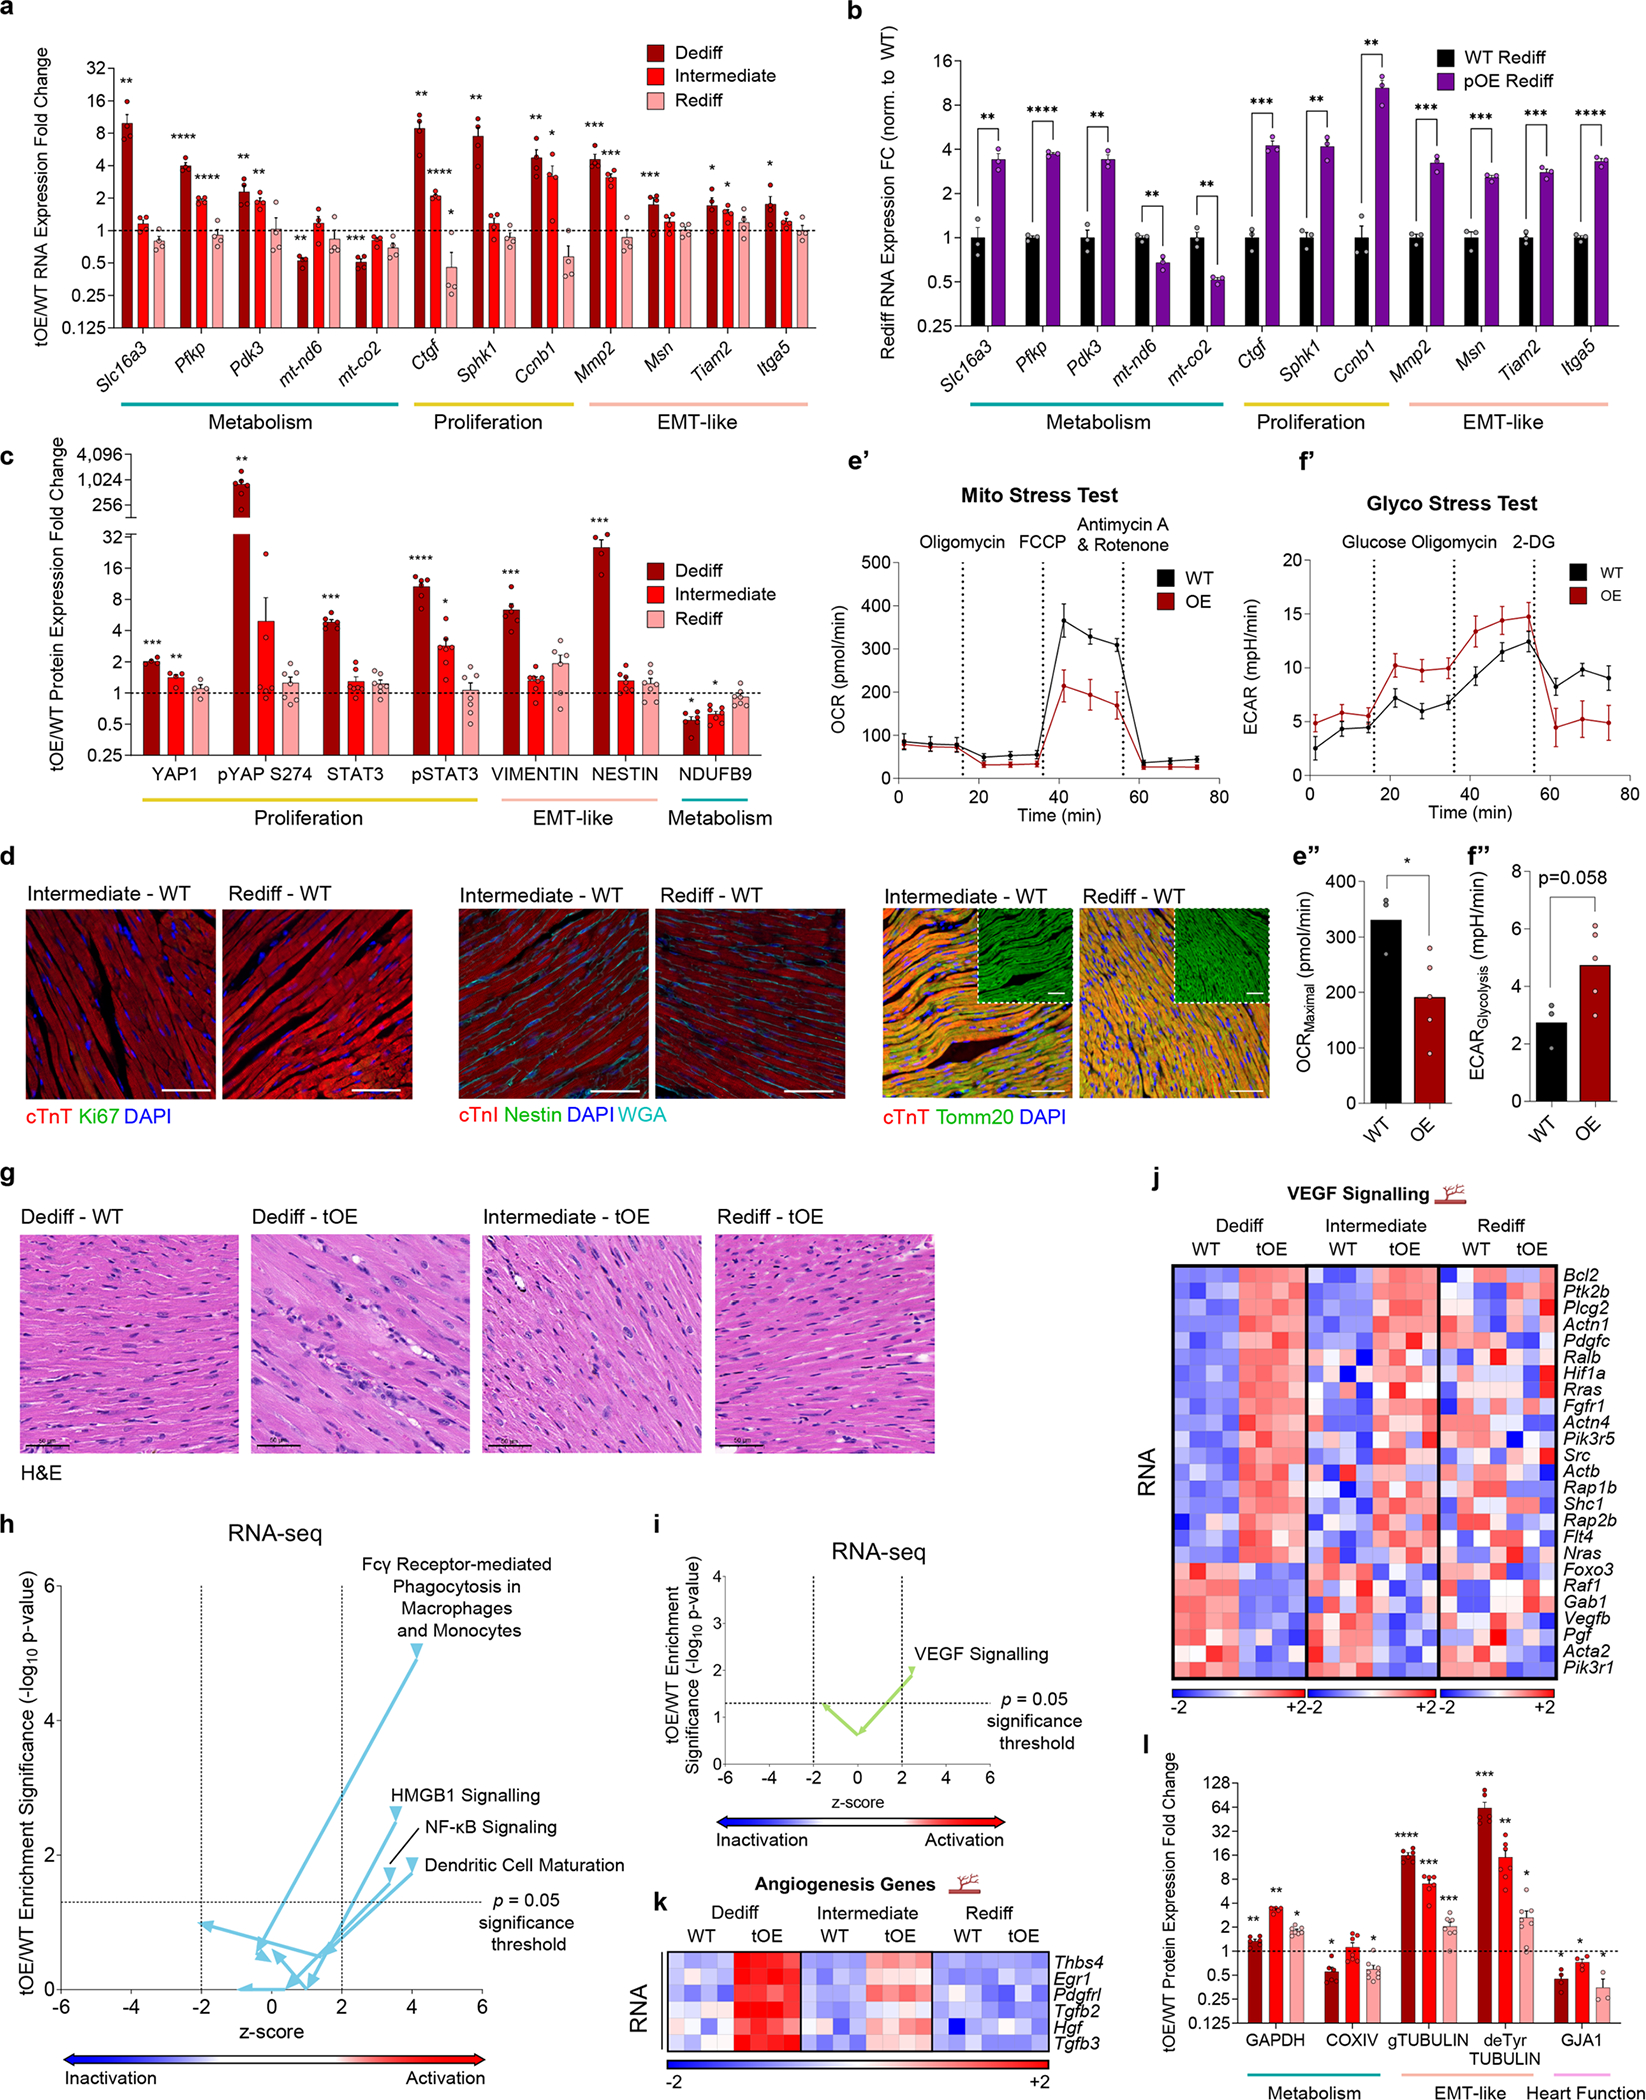
a,b, tOE/WT at all timepoints (a) and pOE/WT at Rediff (b) RNA expression fold change of ‘return to normal’ genes, involved in metabolism, proliferation and EMT-like features, determined by RT-qPCR. All values are normalised to their in-time point average WT value (black dashed line). n = 3 – 4 mice per group. c, Western blot quantification for data in Fig. 2b in order to validate the ‘return to normal’ behaviour of proteins involved in proliferation, EMT-like features and metabolism. n = 4 – 7 mice per group. d, Representative immunofluorescence images of isotype controls (WT) for the tOE hearts at Int. and Rediff timepoints shown in Fig. 2c, stained for Ki67, Nestin and Tomm20. Full quantification is provided in Fig. 2c. Scale bars = 50μm for Ki67 and NESTIN, 100μm for TOMM20. e’–f”, Metabolic analysis of cultured P7 WT (n = 3) and OE (n = 5) CMs using an XFe96 Seahorse analyser. OCR (oxygen consumption rate) during the Cell Mito Stress Test (e’) and ECAR (extracellular acidification rate (glycolysis proxy)) during the Glycolysis Stress Test (f’). Maximal respiration/OCR (e”) and Glycolysis (f”). For (e”) WT vs OE p = 0.0320. g, H&E-stained histological sections of WT Dediff and tOE Dediff, Int. and Rediff hearts. Images were acquired in the remote zones of MI injured hearts as a proxy for sham injury. Scale bars = 50μm. n = 3 for each group. h,i, Scatter plot of immune-related (h) and angiogenesis-related (i) GO term z-scores against enrichment significance (log10 p-value) for tOE/WT across all timepoints, based on Ingenuity Canonical Pathway Analysis of RNAseq data using a threshold fold change (FC) ≥ 1.5; adjusted p ≤ 0.05. Arrows on each line indicate the direction of the GO term from Dediff to Int. to Rediff. Z-scores below −2 are predictive of pathway inactivation and above +2 are predictive of pathway activation. Values above the horizontal dashed black line represent statistically significant enrichment. j,k, Heatmaps of differentially expressed genes corresponding to the IPA analysis in (i), (j) and an independently curated list of angiogenesis genes (k), compiled as described in Fig. 1g. l, Western blot quantification for data in Fig. 2g in order to validate the proteins involved in metabolism, cytoskeletal signalling and heart function that remain differentially expressed at Rediff. In all panels numerical data are presented as mean ± SEM statistical significance was calculated using two-tailed unpaired Student’s t-test in (a–c,e”,f”,l) between the in-time point WT and tOE values. *p ≤ 0.05, **p < 0.01, ***p < 0.001, ****p < 0.0001.
Extended Data Fig. 3 |. Expanded RNAseq evidence of effects for EMT-like GO terms that ‘return to normal’.
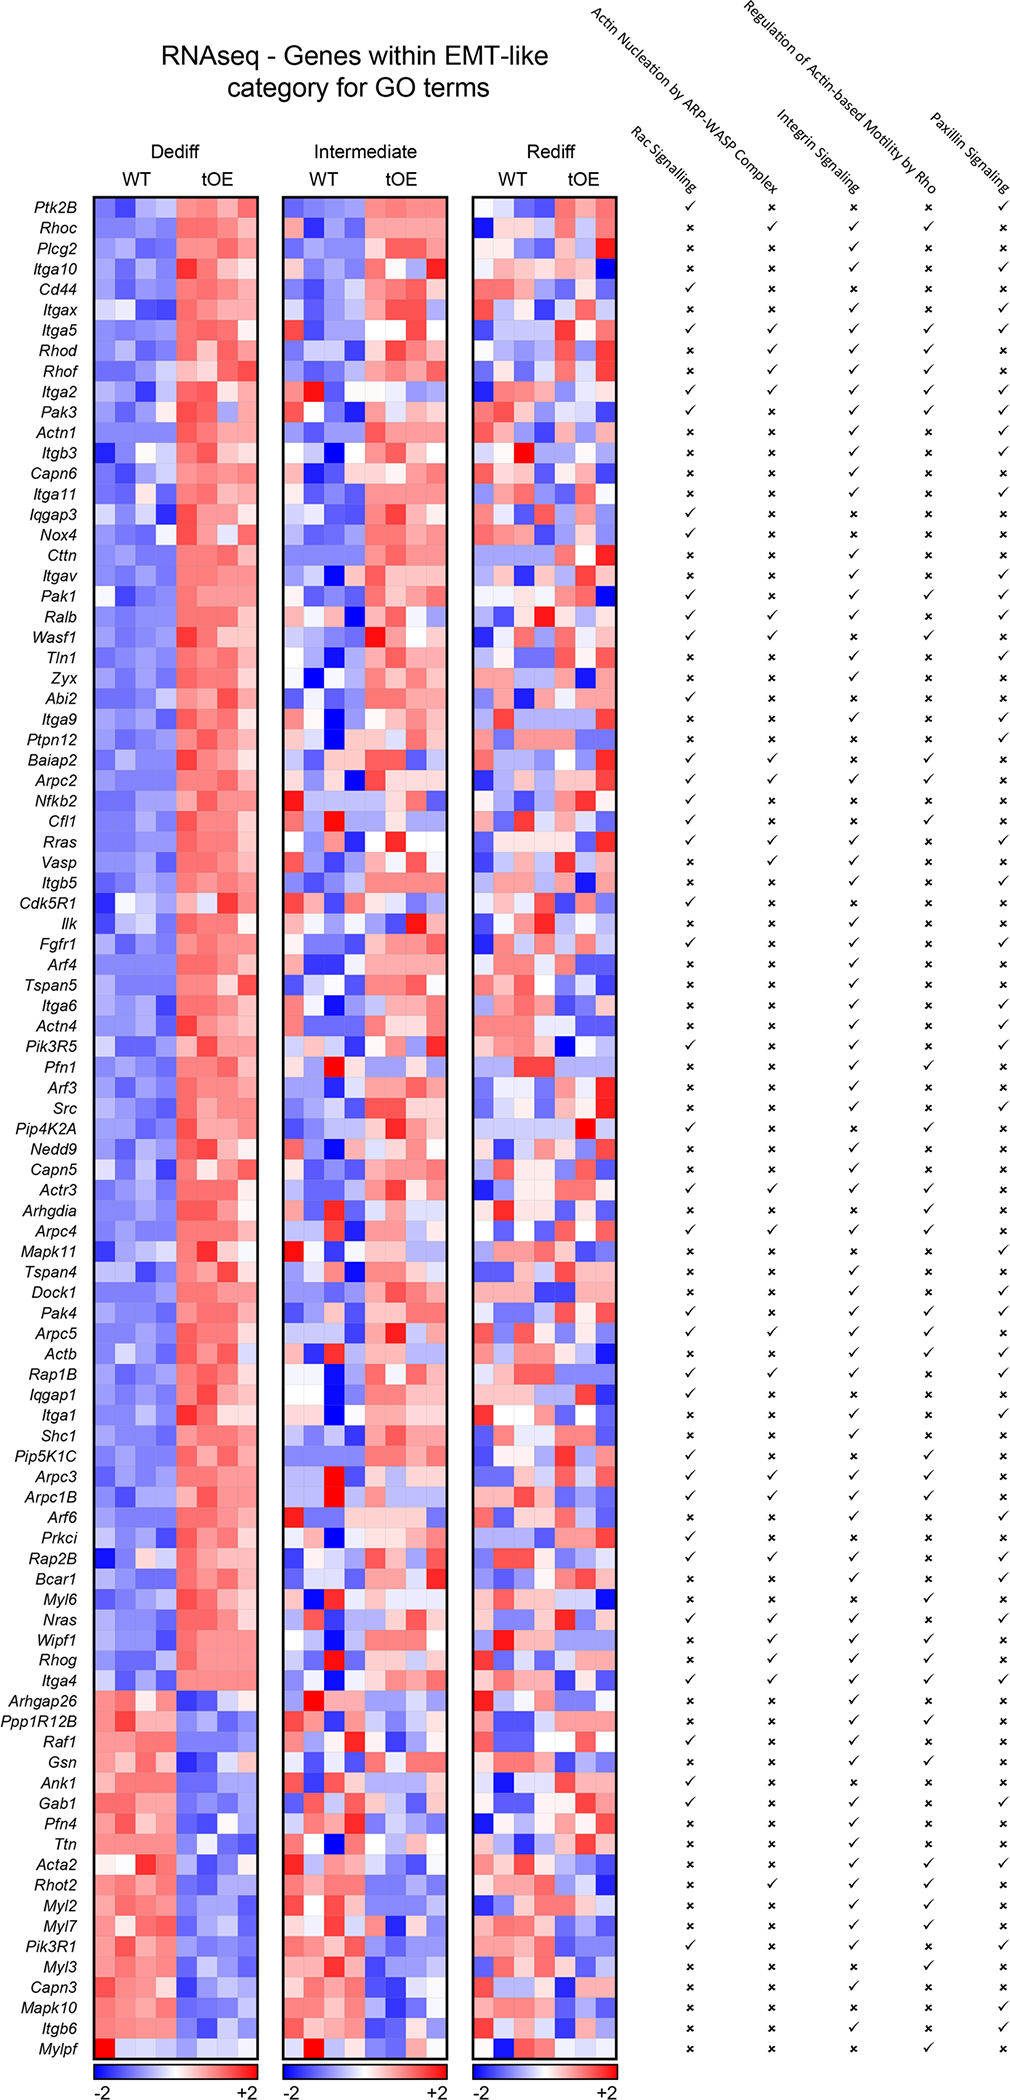
Heatmaps based on log2 transformed normalised counts from Sham RNAseq data of differentially expressed genes that appear within at least one of the listed EMT-like category GO terms (indicated by a tick). Rows represent genes. Columns represent each biological sample. Colour bars represent z-score for each timepoint.
Extended Data Fig. 4 |. Expanded RNAseq evidence of effects for mitochondrial metabolism GO terms that ‘return to normal’.
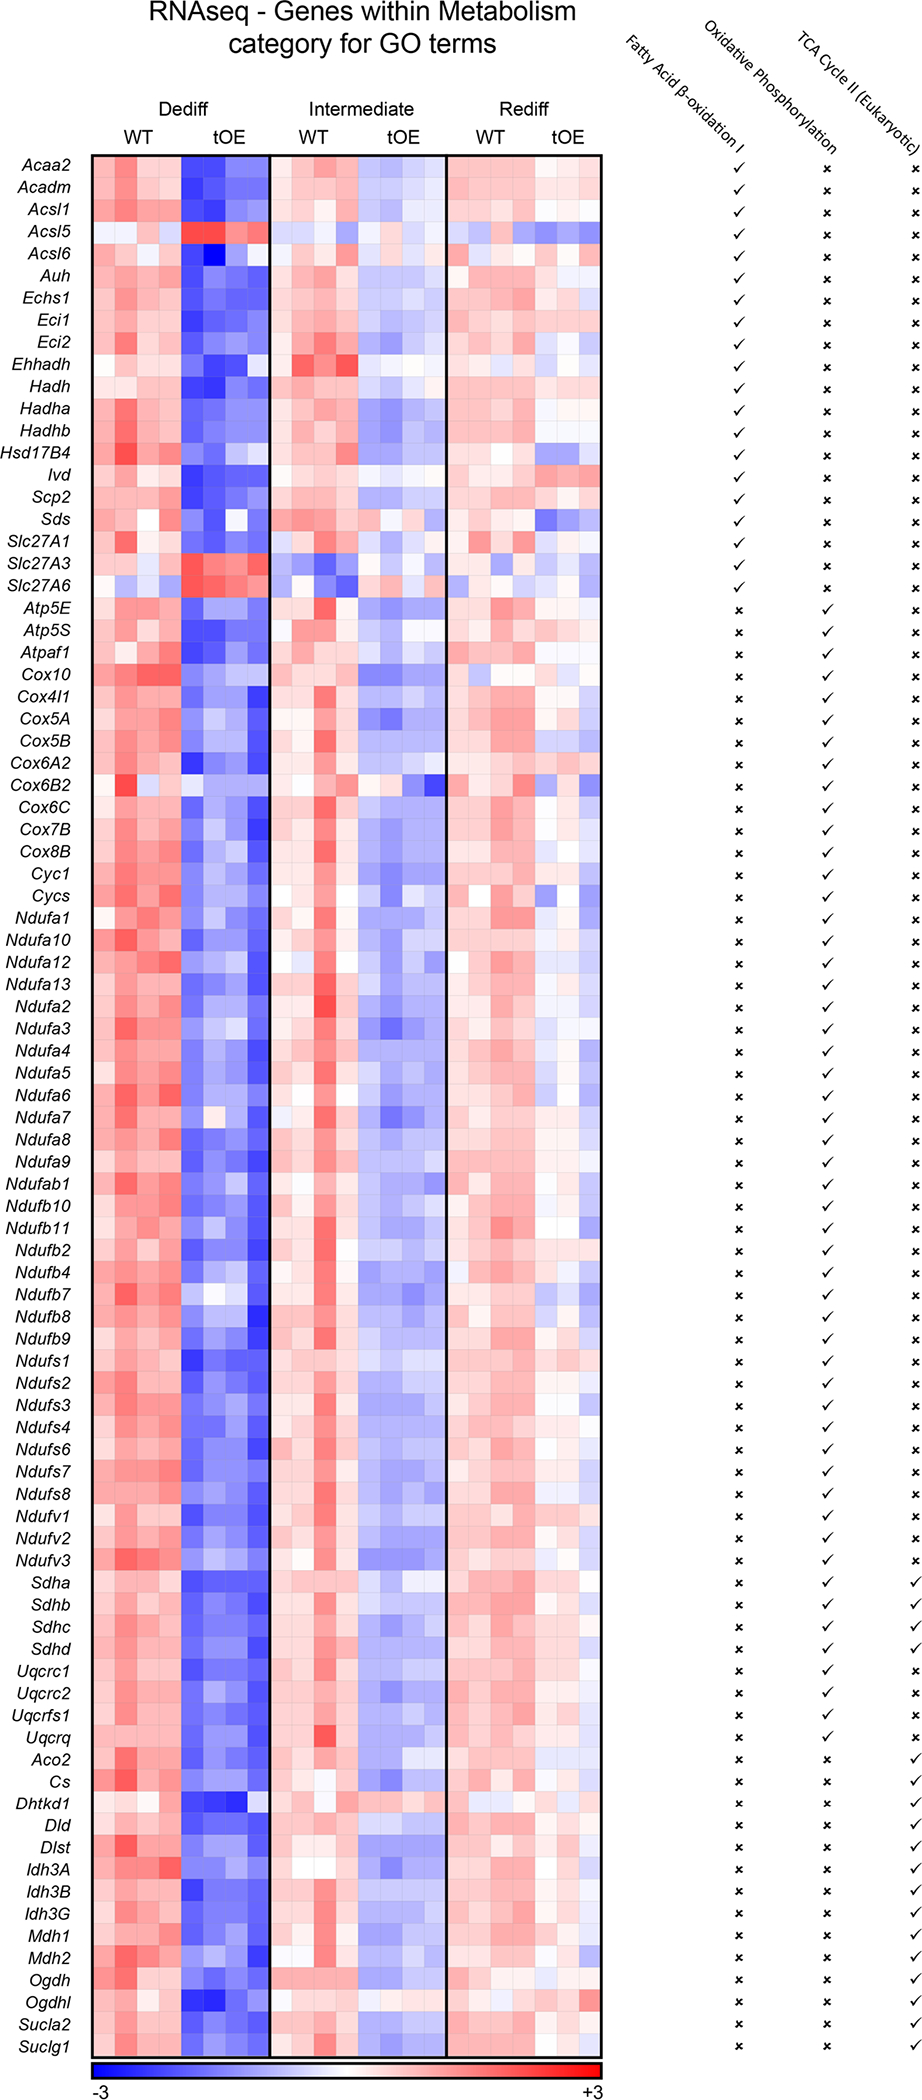
Heatmaps based on log2 transformed normalised counts from Sham RNAseq data of differentially expressed genes that appear within at least one of the listed mitochondrial metabolism GO terms (indicated by a tick). Rows represent genes. Columns represent each biological sample. Colour bars represent z-score for all timepoints.
Extended Data Fig. 5 |. Expanded proteomics evidence of effects for mitochondrial metabolism GO terms that partially ‘return to normal’.
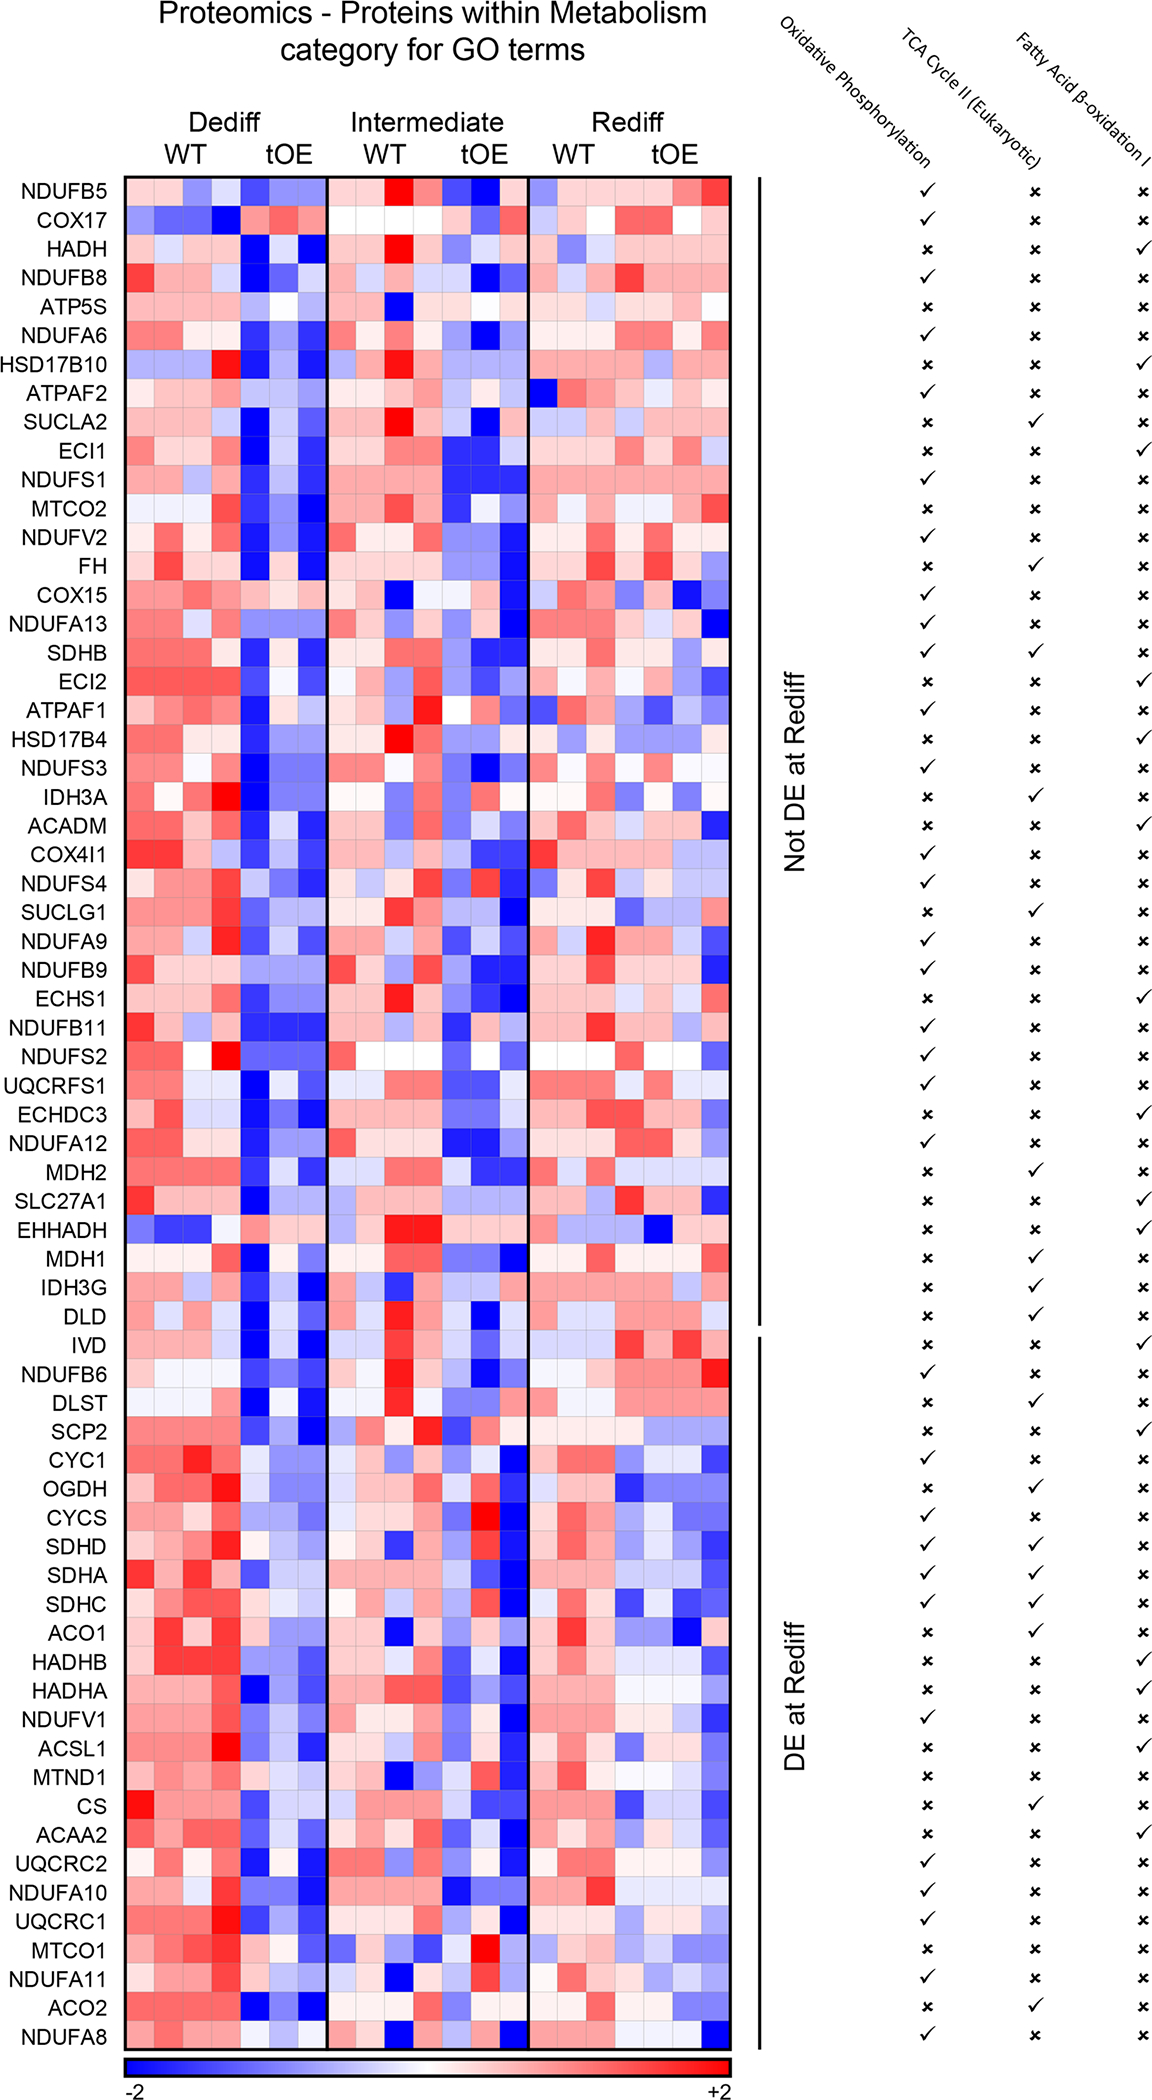
Heat maps based on log10 transformed intensity values from Sham proteomics data of differentially expressed proteins that appear within at least one of the listed mitochondrial metabolism GO terms (indicated by a tick). Rows represent proteins. Columns represent each biological sample. Colour bars represent z-score for each row across all timepoints.
Extended Data Fig. 6 |. Expanded proteomics evidence of effects for EMT-like category GO terms that partially ‘return to normal’.
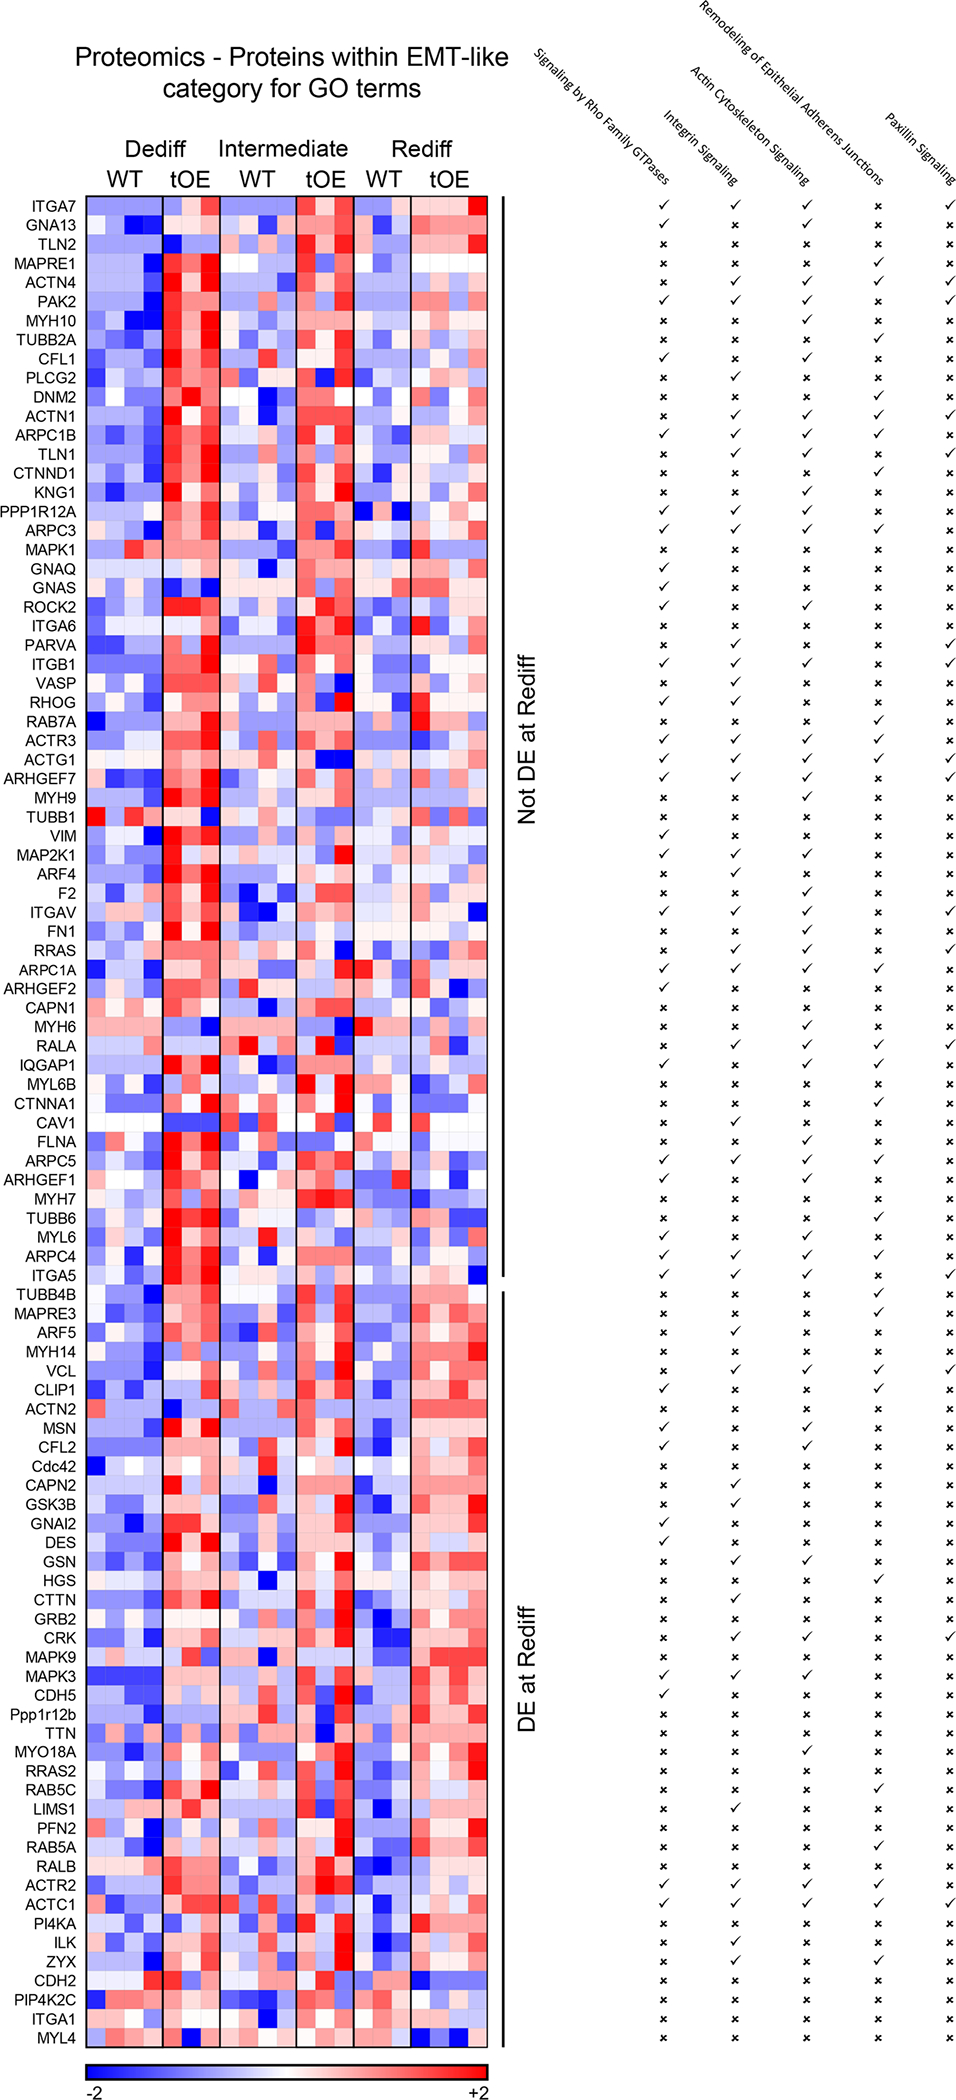
Heat maps based on log10 transformed intensity values from Sham proteomics data of differentially expressed proteins that appear within at least one of the listed EMT-like category GO terms (indicated by a tick). Rows represent proteins. Columns represent each biological sample. Colour bars represent z-score for each row across all timepoints.
Extended Data Fig. 7 |. Expanded proteomics evidence of effects for heart related category GO terms that partially ‘return to normal’.
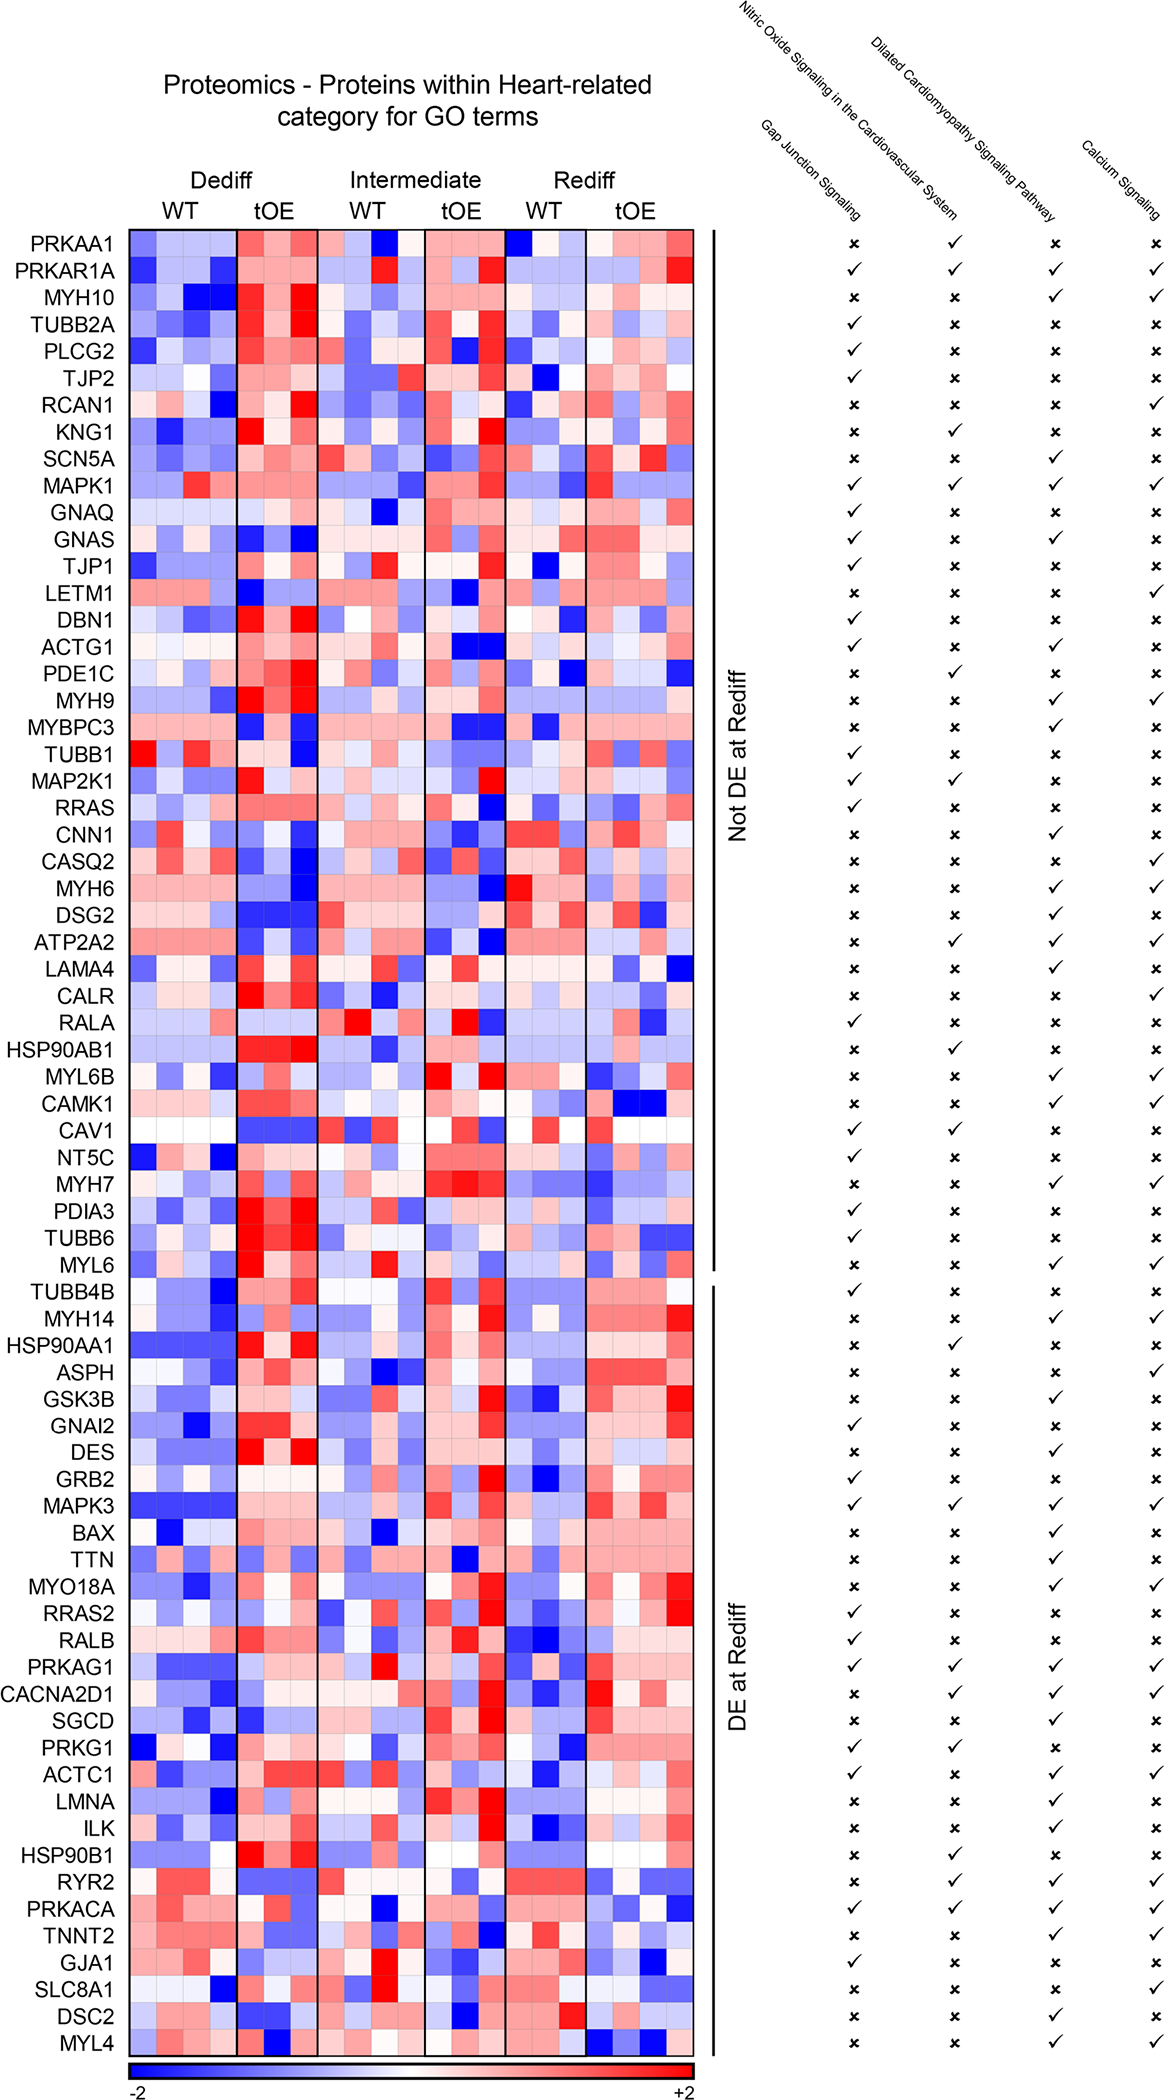
Heat maps based on log10 transformed intensity values from Sham proteomics data of differentially expressed proteins that appear within at least one of the listed heart related category GO terms (indicated by a tick). Rows represent proteins. Columns represent each biological sample. Colour bars represent z-score for each row across all timepoints.
Extended Data Fig. 8 |. Dedifferentiation-Redifferentiation cycle confers robust protection against ischaemic injury.
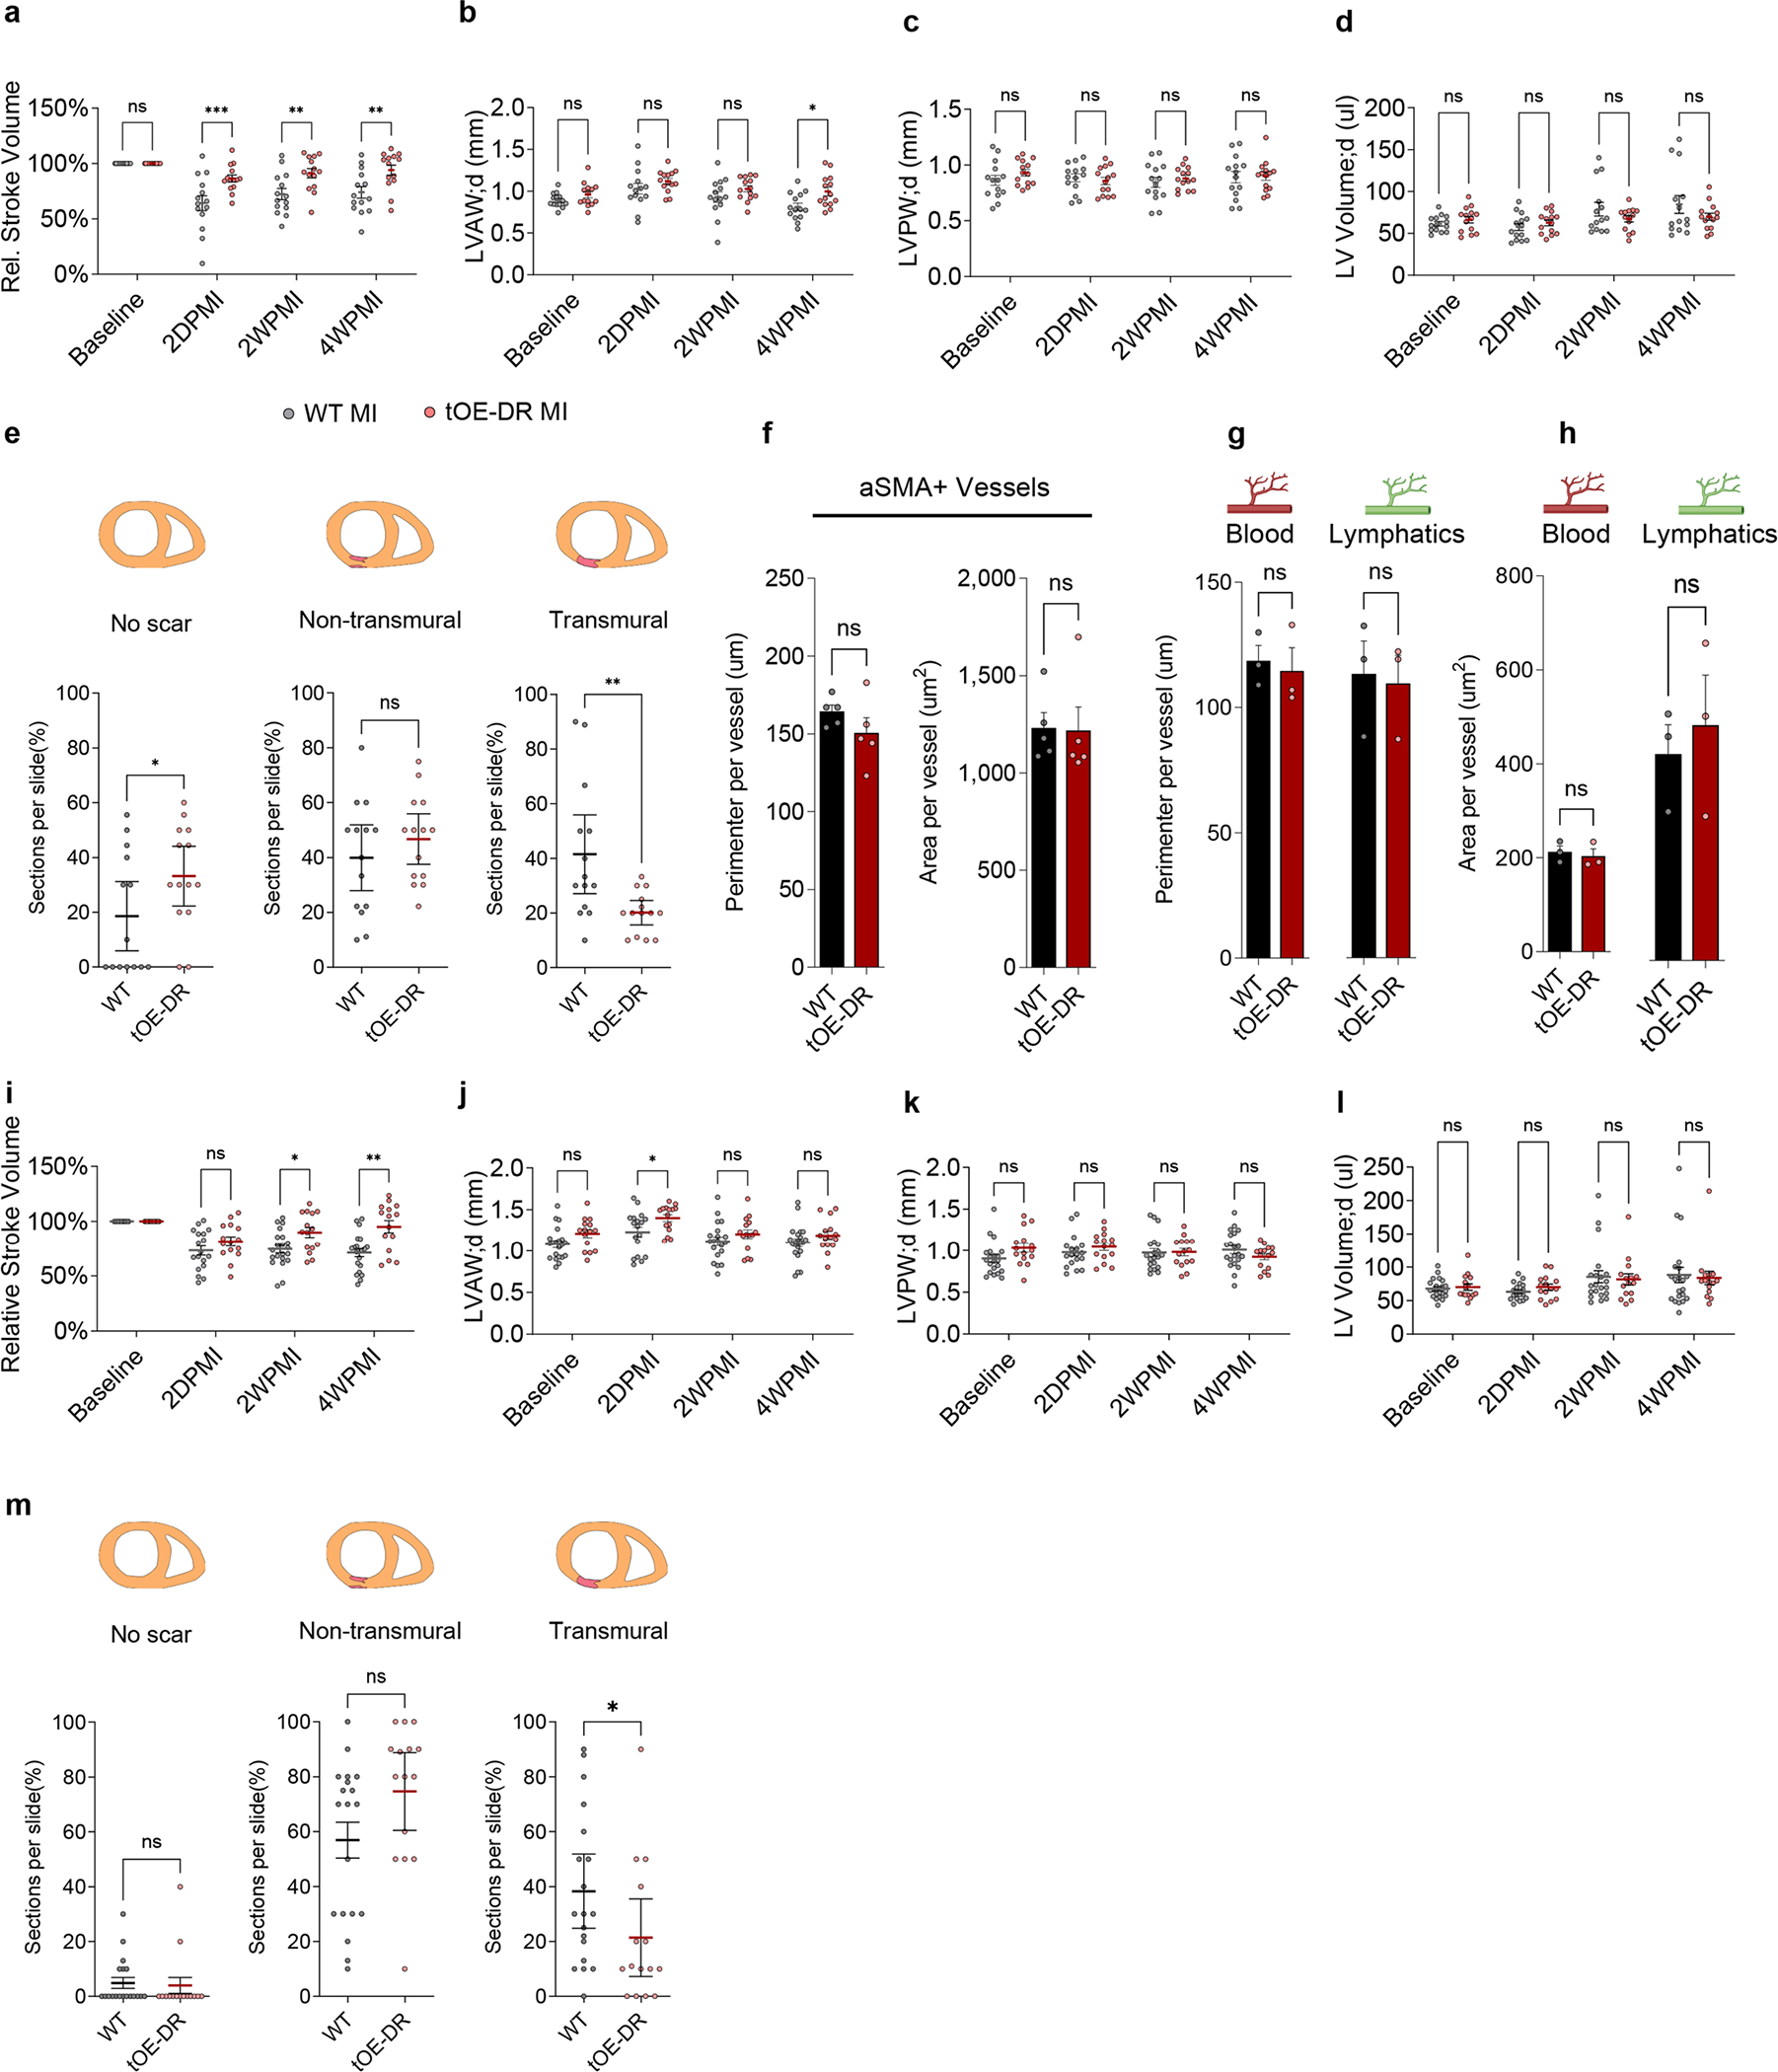
a-d, Relative stroke volume (a), Left Ventricular Anterior Diastolic Wall thickness (LVAW;d) (b), Left Ventricular Posterior Diastolic Wall thickness (LVPW;d) (c) and Left ventricular diastolic volume (LV Volume;d) (d) of WT and tOE-DR, measured by echocardiography. n = 14 for each group. For WT vs tOE-DR in (a), 2DPMI p = 0.000369, 2WPMI p = 0.002282, 4WPMI p = 0.00133. For WT vs tOE-DR in (b), 4WPMI p = 0.010216. e, Scar classification quantification for WT and tOE-DR mice. n = 14 for each group. For WT vs tOE-DR, No Scar p = 0.0442, Transmural scar p = 0.0051. f, Average perimeter and area per aSMA+ vessel. n = 5 for each group. g,h, Average perimeter (g) and area (h) per blood and lymphatic vessel, as measured by CD31 and LYVE1 immunofluorescence. n = 3 for each group. i-l, rSV (i), LVAW;d (j), LVPW;d (k) and LV Volume;d (l) of WT and tOE-DR 5 months after ERBB2 shut-off, measured by echocardiography. n = 21 for WT, n = 16 for tOE-DR. For WT vs tOE-DR in (i), 2WPMI p = 0.013785, 4WPMI p = 0.001556, (j), 2DPMI p = 0.021647. m, Scar classification quantification for WT and tOE-DR mice, 5 months after ERBB2 shut-off. n = 19 for WT, n = 15 for tOE-DR. Data are presented as mean ± SEM; statistical significance was calculated using a one-tailed Mann-Whitney test in (e) and (m) for ‘No scar’, a two-tailed Mann-Whitney test in (m) for transmural scar, and a two-tailed unpaired Student’s t-test in (e) for ‘non-transmural’ and ‘transmural’ scar and (m) for ‘non-transmural’ scar counts and (f to h). *p ≤ 0.05, **p < 0.01, ***p < 0.001, ****p < 0.0001
Extended Data Fig. 9 |. ERBB2 signalling promotes a multi-faceted negative feedback response.
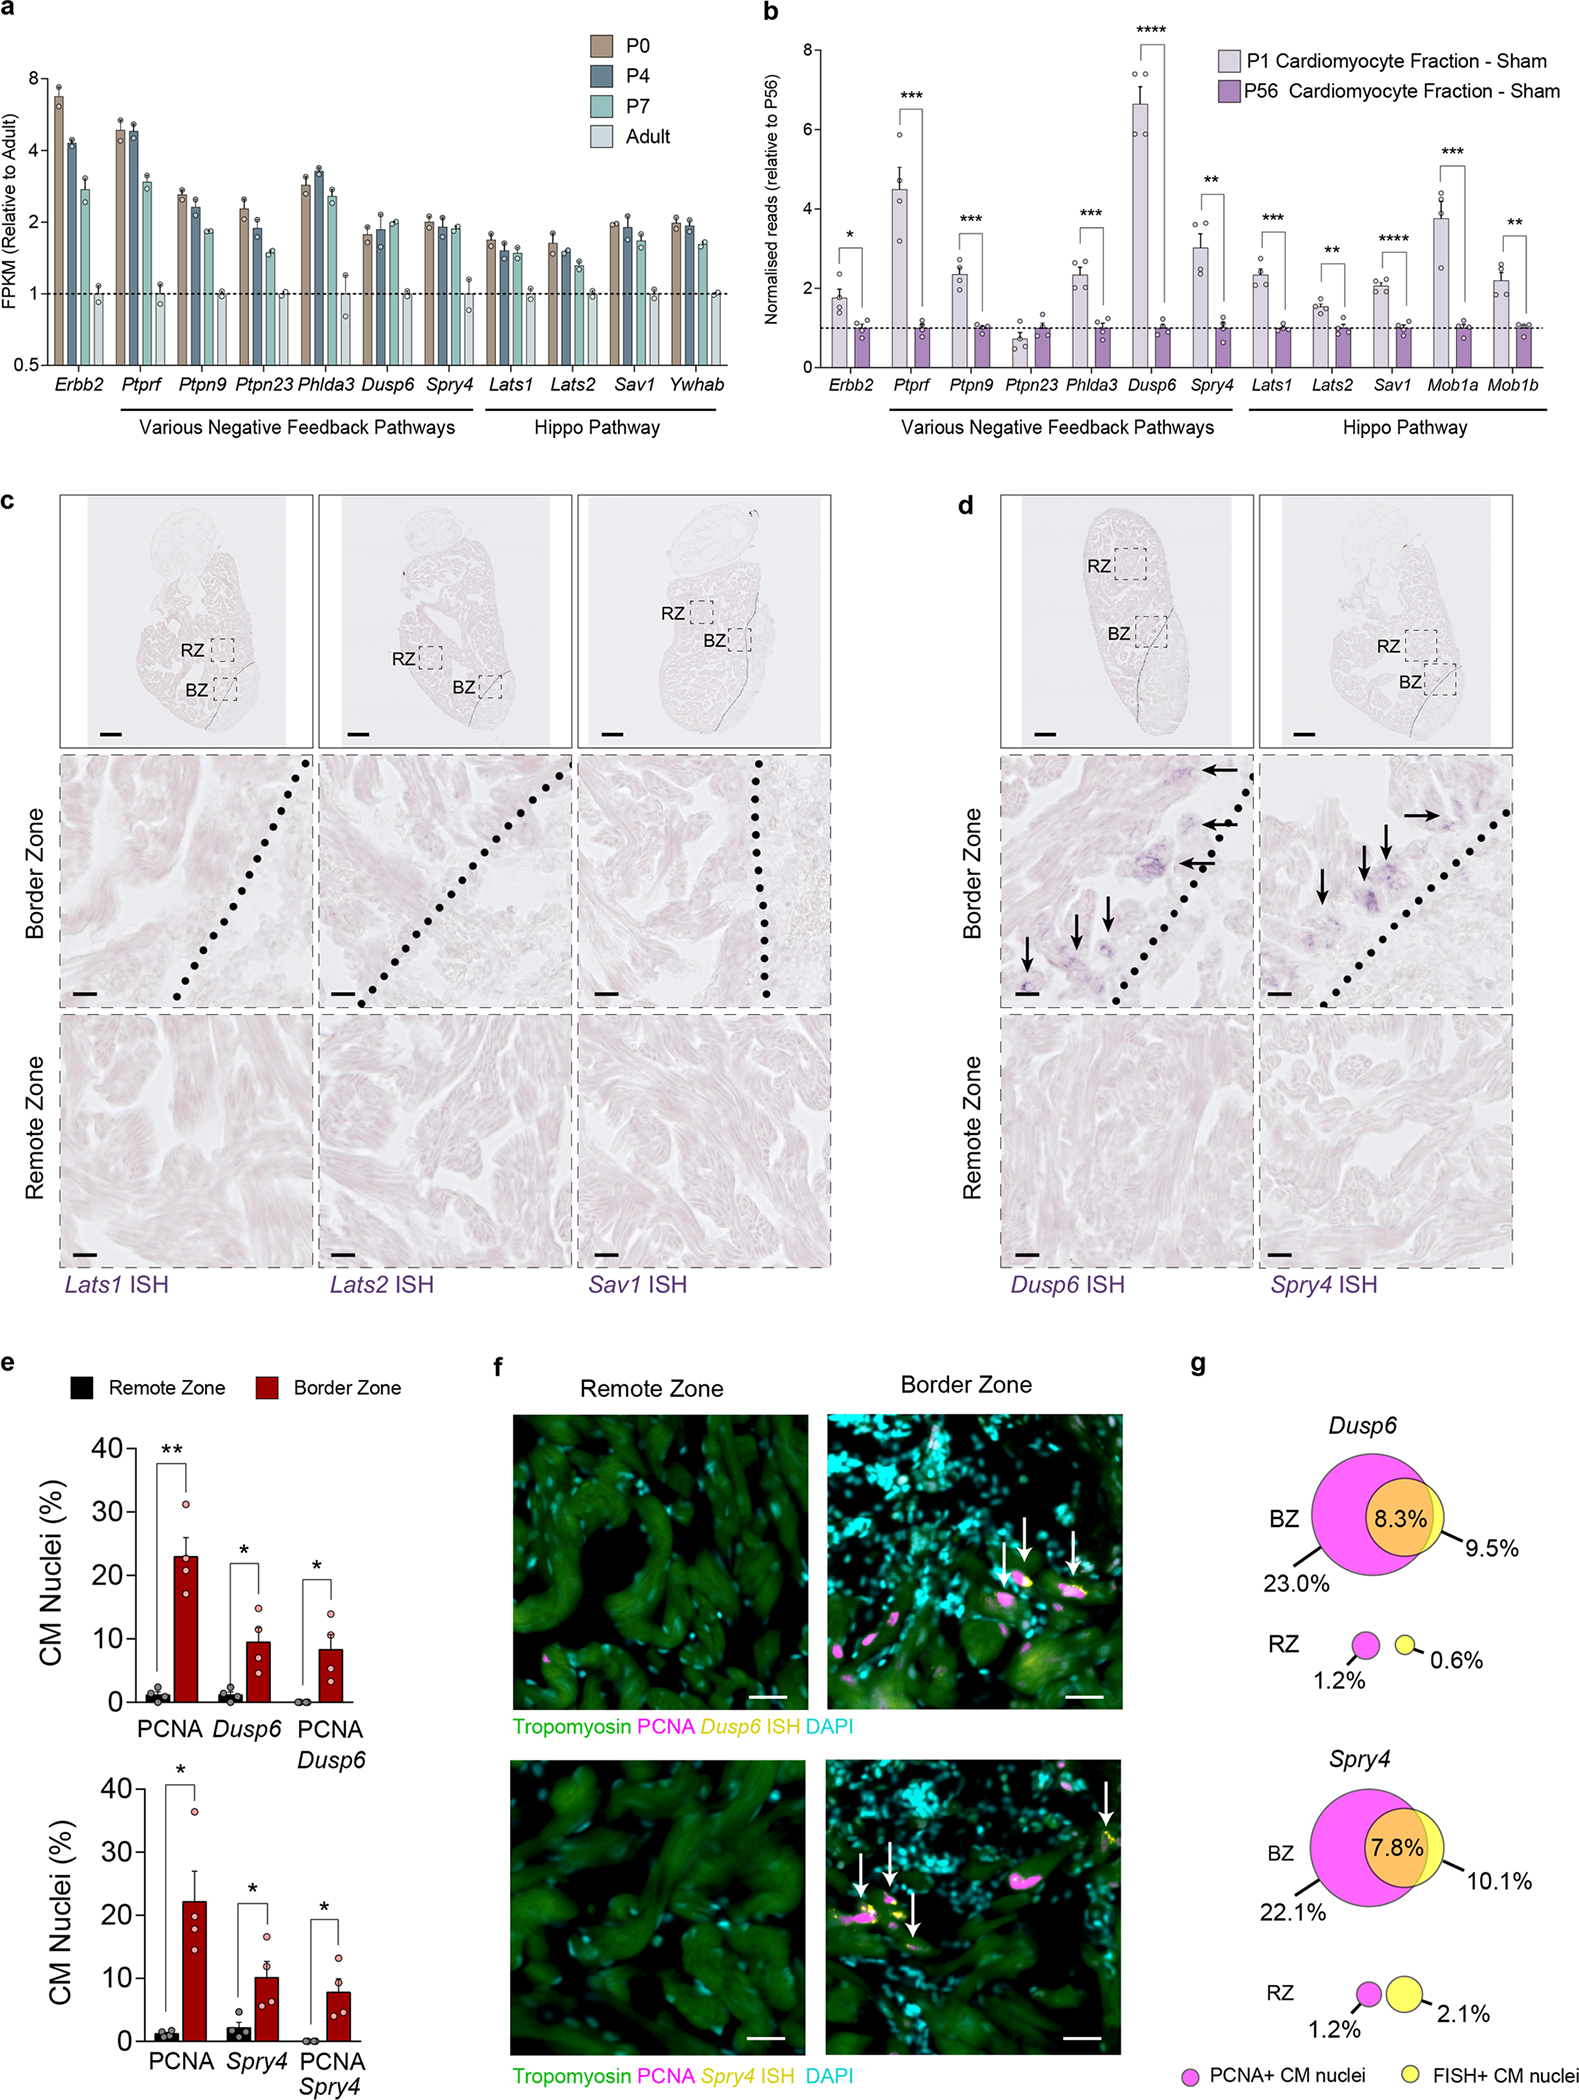
a, RNAseq FPKM values for negative feedback regulators from ventricular lysate of various ages. Data re-analysed from O’meara et al.40. b, RNAseq normalised counts for negative feedback regulators from bulk-RNAseq of purified CMs from sham injured P1 and P56 mice. Data re-analysed from Quaife-Ryan et al.41. c,d, In situ hybridisation for Hippo pathway genes Lats1, Lats2 and Sav1 (c) and ERK negative feedback regulators Dusp6 & Spry4 (d) mRNA in 7DPI (days post injury) adult zebrafish hearts. RZ = Remote Zone. BZ = Border Zone. Zones are delineated by the black dotted lines. Middle and bottom panels show higher magnification images of the corresponding dashed black boxes in the top panel. Black arrows highlight the presence of detected mRNA. Scale bar in top panels represent 100 μm, scale bars in middle and bottom panels represent 10 μm. n = 3 for each group. e, Quantification of combined FISH and immunofluorescence staining for PCNA and either Dusp6 (top panel) or Spry4 (bottom panel) positive CM nuclei in RZ and BZ of 7DPI adult zebrafish hearts (n = 4). For Dusp6 Border zone vs Remote zone, PCNA + CMs p = 0.0033, Dusp6+ CMs p = 0.0371, PCNA + /Dusp6+ CMs p = 0.0421. For Spry4 Border zone vs Remote zone, PCNA + CMs p = 0.0241, Dusp6+ CMs p = 0.0240, PCNA + /Dusp6+ CMs p = 0.0369. f, Representative images of remote and border zones for Dusp6 (upper) and Spry4 (lower) stained sections in (e). White arrows indicate doublepositive CM nuclei. Scale bars represent 20μm. g, To-scale Venn diagram for Dusp6 (upper) and Spry4 (lower) positive nuclei overlapping with PCNA positive nuclei between the RZ and BZ. In all graph panels numerical data are presented as mean ± SEM; statistical significance was calculated using a two-tailed unpaired Student’s t-test in (b) between the P1 and P56 values, and in (e) between the corresponding RZ and BZ values. *p ≤ 0.05, **p < 0.01, ***p < 0.001, ****p < 0.0001.
Extended Data Fig. 10 |. LATS1/2 negative feedback signalling is required for redifferentiation.
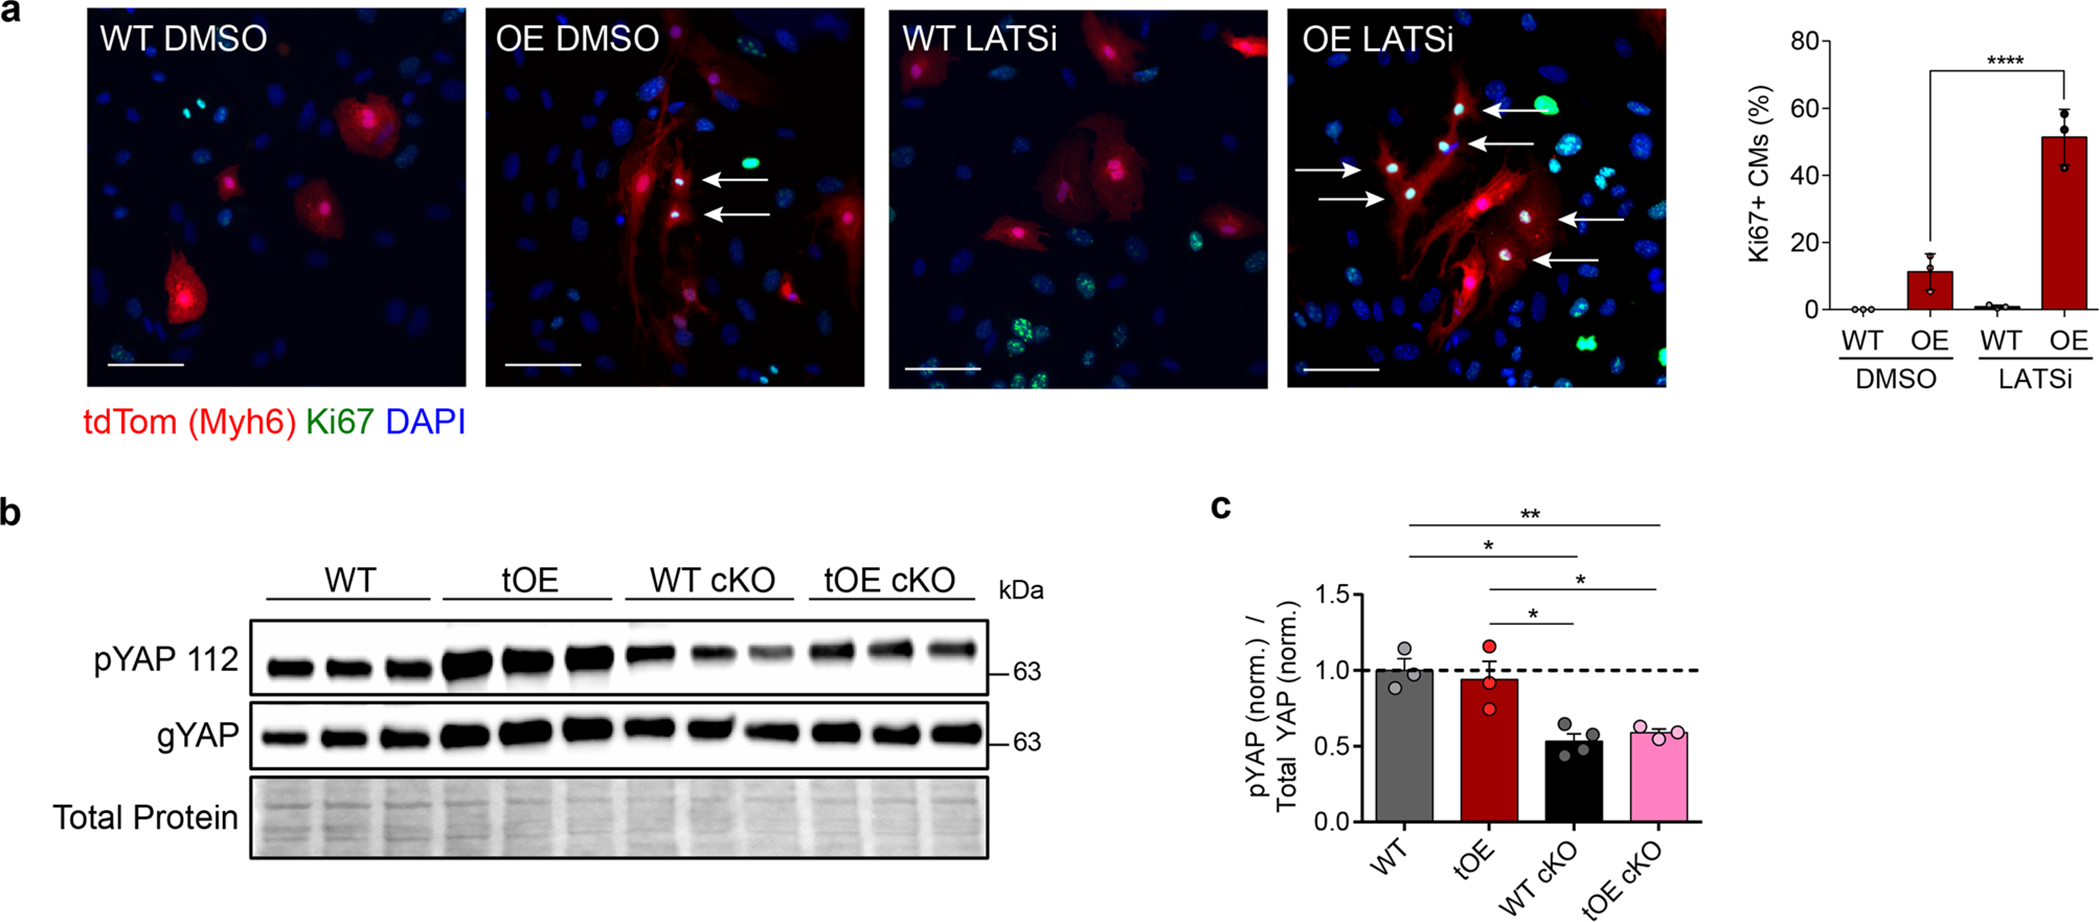
a, Representative immunofluorescence images of Ki67 in LATSi or DMSO treated WT and OE P7 cardiac cultures, with full quantification. All groups had minimum n = 3. Scale bars = 50μm. b,c, Representative western blot of whole-heart lysates for general Yap (gYAP) and pYAP S112 (a target residue of LATS1/2) from WT, tOE, WT LATS1/2 cKO and tOE LATS1/2 cKO mice (b), with quantification, normalised to the average WT value (c). WT n = 3, tOE n = 3, WT cKO n = 4, OE cKO n = 3. In all panels numerical data are presented as mean ± SEM; statistical significance was calculated using a paired two-way ANOVA followed by Sidak’s test in (a) and a one-way ANOVA followed by Tukey’s test in (c). *p ≤ 0.05, **p < 0.01, ***p < 0.001, ****p < 0.0001. Uncropped blots for (b) are provided in supplementary source data.
Supplementary Material
Acknowledgements
We thank the Benoziyo Endowment Fund for the Advancement of Science, the Head of the Yad Abraham Research Center for Cancer Diagnostics and Therapy, the Zuckerman STEM Leadership Program, the Dr. Dvora and Haim Teitelbaum Endowment Fund and the Daniel S. Shapiro Cardiovascular Research Fund. G.F. is the Incumbent of the David and Stacey Cynamon Research Fellow Chair in Genetics and Personalized Medicine. We thank O. Golani for assistance with image processing (Weizmann Institute of Science), M. Oren (Weizmann Institute of Science) and J. Martin (Baylor College of Medicine) for the LATS1/2 cKO mice and A. Genzelinakh (Weizmann Institute of Science) for providing the Sirius Red quantification script. Illustrations in figures were created with BioRender. Funding: European Research Council StG grant 281289 (E.T.); European Research Council AdG grant 788194 (E.T.); ERA-CVD CARDIO-PRO (J.B. and E.T.); U.S.–Israel Binational Science Foundation (E.T.); Israel Science Foundation (E.T.); Foundation Leducq Transatlantic Network of Excellence (E.T.); Minerva Foundation, with funding from the Federal German Ministry for Education and Research (E.T.); EU Horizon 2020 Research and Innovation Programme REANIMA (E.T.); EMBO Long Term Fellowship grant ALTF1129-2015 (P.D.N.); HFSPO Fellowship grant LT001404/2017-L (P.D.N.); NWO-ZonMW Veni grant 016.186.017-3 (P.D.N.); Netherlands Cardiovascular Research Initiative: an initiative with support from the Dutch Heart Foundation and Hartekind, CVON2019-002 OUTREACH (J.B.); and National Institutes of Health grant T32GM007739 (N.K.).
Footnotes
Competing interests
The authors declare no competing interests.
Reporting Summary
Further information on research design is available in the Nature Portfolio Reporting Summary linked to this article.
Extended data is available for this paper at https://doi.org/10.1038/s44161-023-00250-w.
Supplementary information The online version contains supplementary material available at https://doi.org/10.1038/s44161-023-00250-w.
Peer review information Nature Cardiovascular Research thanks the anonymous reviewers for their contribution to the peer review of this work.
Reprints and permissions information is available at www.nature.com/reprints.
Data availability
RNA-seq reads were aligned to the mm10 mouse genome (https://www.ncbi.nlm.nih.gov/data-hub/genome/GCF_000001635.20/). The RNA-seq data discussed in this publication have been deposited in the National Center for Biotechnology Information’s Gene Expression Omnibus (GEO)71 and are accessible through GEO Series accession number GSE220612. The mass spectrometry proteomics data have been deposited to the ProteomeXchange Consortium via the PRIDE74 partner repository with the dataset identifier PXD038450. Data reanalyzed from O’Meara et al.40 (https://doi.org/10.1161/CIR-CRESAHA.116.304269) are readily accessible from the online article. Data reanalyzed from Quaife-Ryan et al.41 (https://doi.org/10.1161/CIRCULATIONAHA.117.028252) were downloaded from the GEO database (GSE95755). Source data are provided with this paper.
References
- 1.Ali H, Braga L & Giacca M Cardiac regeneration and remodelling of the cardiomyocyte cytoarchitecture. FEBS J. 287, 417–438 (2019). [DOI] [PubMed] [Google Scholar]
- 2.Gemberling M, Karra R, Dickson AL & Poss KD Nrg1 is an injury-induced cardiomyocyte mitogen for the endogenous heart regeneration program in zebrafish. eLife 4, e05871 (2015). [DOI] [PMC free article] [PubMed] [Google Scholar]
- 3.D’Uva G et al. ERBB2 triggers mammalian heart regeneration by promoting cardiomyocyte dedifferentiation and proliferation. Nat. Cell Biol. 17, 627–638 (2015). [DOI] [PubMed] [Google Scholar]
- 4.Monroe TO et al. YAP partially reprograms chromatin accessibility to directly induce adult cardiogenesis in vivo. Dev. Cell 48, 765–779 (2019). [DOI] [PMC free article] [PubMed] [Google Scholar]
- 5.Chen Y et al. Reversible reprogramming of cardiomyocytes to a fetal state drives heart regeneration in mice. Science 373, 1537–1540 (2021). [DOI] [PubMed] [Google Scholar]
- 6.Gabisonia K et al. MicroRNA therapy stimulates uncontrolled cardiac repair after myocardial infarction in pigs. Nature 569, 418–422 (2019). [DOI] [PMC free article] [PubMed] [Google Scholar]
- 7.Mahmoud AI et al. Meis1 regulates postnatal cardiomyocyte cell cycle arrest. Nature 497, 249–253 (2013). [DOI] [PMC free article] [PubMed] [Google Scholar]
- 8.Heallen T et al. Hippo signaling impedes adult heart regeneration. Development 140, 4683–4690 (2013). [DOI] [PMC free article] [PubMed] [Google Scholar]
- 9.Morikawa Y et al. Actin cytoskeletal remodeling with protrusion formation is essential for heart regeneration in Hippo-deficient mice. Sci. Signal. 8, ra41 (2015). [DOI] [PMC free article] [PubMed] [Google Scholar]
- 10.Lin Z et al. Cardiac-specific YAP activation improves cardiac function and survival in an experimental murine MI model. Circ. Res. 115, 354–363 (2014). [DOI] [PMC free article] [PubMed] [Google Scholar]
- 11.Wu Y et al. LRP6 downregulation promotes cardiomyocyte proliferation and heart regeneration. Cell Res. 31, 450–462 (2021). [DOI] [PMC free article] [PubMed] [Google Scholar]
- 12.Yue Z et al. PDGFR-β signaling regulates cardiomyocyte proliferation and myocardial regeneration. Cell Rep. 28, 966–978. e4 (2019). [DOI] [PubMed] [Google Scholar]
- 13.Leach JP et al. Hippo pathway deficiency reverses systolic heart failure after infarction. Nature 550, 260 (2017). [DOI] [PMC free article] [PubMed] [Google Scholar]
- 14.Tao G et al. Pitx2 promotes heart repair by activating the antioxidant response after cardiac injury. Nature 534, 119–123 (2016). [DOI] [PMC free article] [PubMed] [Google Scholar]
- 15.Xiang F, Guo M & Yutzey KE Overexpression of Tbx20 in adult cardiomyocytes promotes proliferation and improves cardiac function after myocardial infarction. Circulation 133, 1081–1092 (2016). [DOI] [PMC free article] [PubMed] [Google Scholar]
- 16.Mohamed TMA et al. Regulation of cell cycle to stimulate adult cardiomyocyte proliferation and cardiac regeneration. Cell 173, 104–116 (2018). [DOI] [PMC free article] [PubMed] [Google Scholar]
- 17.Aharonov A et al. ERBB2 drives YAP activation and EMT-like processes during cardiac regeneration. Nat. Cell Biol. 22, 1356–135 (2020). [DOI] [PubMed] [Google Scholar]
- 18.Honkoop H et al. Single-cell analysis uncovers that metabolic reprogramming by ErbB2 signaling is essential for cardiomyocyte proliferation in the regenerating heart. eLife 8, e50163 (2019). [DOI] [PMC free article] [PubMed] [Google Scholar]
- 19.Puente BN et al. The oxygen-rich postnatal environment induces cardiomyocyte cell-cycle arrest through DNA damage response. Cell 157, 565–579 (2014). [DOI] [PMC free article] [PubMed] [Google Scholar]
- 20.Rodríguez-Sinovas A, Sánchez JA, Valls-Lacalle L, Consegal M & Ferreira-González I Connexins in the heart: regulation, function and involvement in cardiac disease. Int. J. Mol. Sci. 22, 4413 (2021). [DOI] [PMC free article] [PubMed] [Google Scholar]
- 21.van Rijen HVM et al. Slow conduction and enhanced anisotropy increase the propensity for ventricular tachyarrhythmias in adult mice with induced deletion of connexin43. Circulation 109, 1048–1055 (2004). [DOI] [PubMed] [Google Scholar]
- 22.Gourdie RG The cardiac gap junction has discrete functions in electrotonic and ephaptic coupling. Anat. Rec. 302, 93–100 (2019). [DOI] [PMC free article] [PubMed] [Google Scholar]
- 23.Richardson WJ, Clarke SA, Quinn TA & Holmes JW Comprehensive physiology. Compr. Physiol. 5, 1877–1909 (2017). [DOI] [PMC free article] [PubMed] [Google Scholar]
- 24.Liu X et al. Lymphoangiocrine signals promote cardiac growth and repair. Nature 588, 705–711 (2020). [DOI] [PMC free article] [PubMed] [Google Scholar]
- 25.Garcia-Dorado D et al. Gap junction uncoupler heptanol prevents cell-to-cell progression of hypercontracture and limits necrosis during myocardial reperfusion. Circulation 96, 3579–3586 (1997). [DOI] [PubMed] [Google Scholar]
- 26.Gadicherla AK et al. Mitochondrial Cx43 hemichannels contribute to mitochondrial calcium entry and cell death in the heart. Basic Res. Cardiol. 112, 27 (2017). [DOI] [PubMed] [Google Scholar]
- 27.Wang N et al. Selective inhibition of Cx43 hemichannels by Gap19 and its impact on myocardial ischemia/reperfusion injury. Basic Res. Cardiol. 108, 309 (2012). [DOI] [PMC free article] [PubMed] [Google Scholar]
- 28.Doumont G, Martoriati A & Marine J-C PTPRV is a key mediator of p53-induced cell cycle exit. Cell Cycle 4, 1703–1705 (2005). [DOI] [PubMed] [Google Scholar]
- 29.Tian X, Yang C, Yang L, Sun Q & Liu N PTPRF as a novel tumor suppressor through deactivation of ERK1/2 signaling in gastric adenocarcinoma. OncoTargets Ther. 11, 7795–7803 (2018). [DOI] [PMC free article] [PubMed] [Google Scholar]
- 30.Yuan T, Wang Y, Zhao ZJ & Gu H Protein-tyrosine phosphatase PTPN9 negatively regulates ErbB2 and epidermal growth factor receptor signaling in breast cancer cells. J. Biol. Chem. 285, 14861–14870 (2010). [DOI] [PMC free article] [PubMed] [Google Scholar]
- 31.van der Lely L et al. Loss of PTPN23 promotes proliferation and epithelial-to-mesenchymal transition in human intestinal cancer cells. Inflamm. Intest. Dis. 4, 161–173 (2019). [DOI] [PMC free article] [PubMed] [Google Scholar]
- 32.Fearon AE et al. PHLDA1 mediates drug resistance in receptor tyrosine kinase-driven cancer. Cell Rep. 22, 2469–2481 (2018). [DOI] [PMC free article] [PubMed] [Google Scholar]
- 33.Kawase T et al. PH domain-only protein PHLDA3 is a p53-regulated repressor of Akt. Cell 136, 535–550 (2009). [DOI] [PubMed] [Google Scholar]
- 34.Habibian JS et al. DUSP5 functions as a feedback regulator of TNFα-induced ERK1/2 dephosphorylation and inflammatory gene expression in adipocytes. Sci Rep. 7, 12879 (2017). [DOI] [PMC free article] [PubMed] [Google Scholar]
- 35.Okudela K et al. Down-regulation of DUSP6 expression in lung cancer its mechanism and potential role in carcinogenesis. Am. J. Pathol. 175, 867–881 (2009). [DOI] [PMC free article] [PubMed] [Google Scholar]
- 36.Zhang Z et al. Dual specificity phosphatase 6 (DUSP6) is an ETS-regulated negative feedback mediator of oncogenic ERK signaling in lung cancer cells. Carcinogenesis 31, 577–586 (2010). [DOI] [PMC free article] [PubMed] [Google Scholar]
- 37.Li M et al. SPRY4-mediated ERK1/2 signaling inhibition abolishes 17β-estradiol-induced cell growth in endometrial adenocarcinoma cell. Gynecol. Endocrinol. 30, 600–604 (2014). [DOI] [PubMed] [Google Scholar]
- 38.Hirai M et al. Adaptor proteins NUMB and NUMBL promote cell cycle withdrawal by targeting ERBB2 for degradation. J. Clin. Invest. 127, 569–582 (2017). [DOI] [PMC free article] [PubMed] [Google Scholar]
- 39.Kumbrink J, Gerlinger M & Johnson JP Egr-1 induces the expression of its corepressor Nab2 by activation of the Nab2 promoter thereby establishing a negative feedback loop. J. Biol. Chem. 280, 42785–42793 (2005). [DOI] [PubMed] [Google Scholar]
- 40.O’Meara CC et al. Transcriptional reversion of cardiac myocyte fate during mammalian cardiac regeneration. Circ. Res. 116, 804–815 (2015). [DOI] [PMC free article] [PubMed] [Google Scholar]
- 41.Quaife-Ryan GA et al. Multicellular transcriptional analysis of mammalian heart regeneration. Circulation 136, 1123–1139 (2017). [DOI] [PMC free article] [PubMed] [Google Scholar]
- 42.Lawler PR & Lawler J Molecular basis for the regulation of angiogenesis by thrombospondin-1 and −2. Cold Spring Harb. Perspect. Med. 2, a006627 (2012). [DOI] [PMC free article] [PubMed] [Google Scholar]
- 43.Mundel TM & Kalluri R Type IV collagen-derived angiogenesis inhibitors. Microvasc. Res. 74, 85–89 (2007). [DOI] [PMC free article] [PubMed] [Google Scholar]
- 44.Poss KD, Wilson LG & Keating MT Heart regeneration in zebrafish. Science 298, 2188–2190 (2002). [DOI] [PubMed] [Google Scholar]
- 45.Kastan N et al. Small-molecule inhibition of Lats kinases may promote Yap-dependent proliferation in postmitotic mammalian tissues. Nat. Commun. 12, 3100 (2021). [DOI] [PMC free article] [PubMed] [Google Scholar]
- 46.Heallen T et al. Hippo pathway inhibits Wnt signaling to restrain cardiomyocyte proliferation and heart size. Science 332, 458–461 (2011). [DOI] [PMC free article] [PubMed] [Google Scholar]
- 47.Vivien CJ, Hudson JE & Porrello ER Evolution, comparative biology and ontogeny of vertebrate heart regeneration. NPJ Regen. Med. 1, 16012 (2016). [DOI] [PMC free article] [PubMed] [Google Scholar]
- 48.Liu S et al. Gene therapy knockdown of Hippo signaling induces cardiomyocyte renewal in pigs after myocardial infarction. Sci. Transl. Med. 13, eabd6892 (2021). [DOI] [PMC free article] [PubMed] [Google Scholar]
- 49.Abouleisa RRE et al. Transient cell cycle induction in cardiomyocytes to treat subacute ischemic heart failure. Circulation 145, 1339–1355 (2022). [DOI] [PMC free article] [PubMed] [Google Scholar]
- 50.Nakada Y et al. Hypoxia induces heart regeneration in adult mice. Nature 541, 222–227 (2017). [DOI] [PubMed] [Google Scholar]
- 51.Ocampo A et al. In vivo amelioration of age-associated hallmarks by partial reprogramming. Cell 167, 1719–1733 (2016). [DOI] [PMC free article] [PubMed] [Google Scholar]
- 52.Zhao M et al. Apical resection prolongs the cell cycle activity and promotes myocardial regeneration after left ventricular injury in neonatal pig. Circulation 142, 913–916 (2020). [DOI] [PMC free article] [PubMed] [Google Scholar]
- 53.Cardoso AC et al. Mitochondrial substrate utilization regulates cardiomyocyte cell-cycle progression. Nat. Metab. 2, 167–178 (2020). [PMC free article] [PubMed] [Google Scholar]
- 54.Coburn C et al. Anthranilate fluorescence marks a calcium-propagated necrotic wave that promotes organismal death in C. elegans. PLoS Biol. 11, e1001613 (2013). [DOI] [PMC free article] [PubMed] [Google Scholar]
- 55.Marsh SR, Williams ZJ, Pridham KJ & Gourdie RG Peptidic connexin43 therapeutics in cardiac reparative medicine. J. Cardiovasc. Dev. Dis. 8, 52 (2021). [DOI] [PMC free article] [PubMed] [Google Scholar]
- 56.Stokfisz K, Ledakowicz-Polak A, Zagorski M & Zielinska M Ischaemic preconditioning—current knowledge and potential future applications after 30 years of experience. Adv. Med. Sci.62, 307–316 (2017). [DOI] [PubMed] [Google Scholar]
- 57.Yan R et al. An enhancer-based gene-therapy strategy for spatiotemporal control of cargoes during tissue repair. Cell Stem Cell 30, 96–111 (2023). [DOI] [PMC free article] [PubMed] [Google Scholar]
- 58.Scuderi GJ & Butcher J Naturally engineered maturation of cardiomyocytes. Front. Cell Dev. Biol. 5, 50 (2017). [DOI] [PMC free article] [PubMed] [Google Scholar]
- 59.Bogush N et al. DUSP5 expression in left ventricular cardiomyocytes of young hearts regulates thyroid hormone (T3)-induced proliferative ERK1/2 signaling. Sci Rep. 10, 21918 (2020). [DOI] [PMC free article] [PubMed] [Google Scholar]
- 60.Maillet M et al. DUSP6 (MKP3) null mice show enhanced ERK1/2 phosphorylation at baseline and increased myocyte proliferation in the heart affecting disease susceptibility. J. Biol. Chem. 283, 31246–31255 (2008). [DOI] [PMC free article] [PubMed] [Google Scholar]
- 61.Missinato MA et al. Dusp6 attenuates Ras/MAPK signaling to limit zebrafish heart regeneration. Development 145, dev157206 (2018). [DOI] [PMC free article] [PubMed] [Google Scholar]
- 62.Han P et al. Hydrogen peroxide primes heart regeneration with a derepression mechanism. Cell Res. 24, 1091–1107 (2014). [DOI] [PMC free article] [PubMed] [Google Scholar]
- 63.Sadek H & Olson EN Toward the goal of human heart regeneration. Cell Stem Cell 26, 7–16 (2020). [DOI] [PMC free article] [PubMed] [Google Scholar]
- 64.Tzahor E & Poss KD Cardiac regeneration strategies: staying young at heart. Science 356, 1035–1039 (2017). [DOI] [PMC free article] [PubMed] [Google Scholar]
- 65.Yu Z, Redfern CS & Fishman GI Conditional transgene expression in the heart. Circ. Res. 79, 691–697 (1996). [DOI] [PubMed] [Google Scholar]
- 66.Agah R et al. Gene recombination in postmitotic cells. Targeted expression of Cre recombinase provokes cardiac-restricted, site-specific rearrangement in adult ventricular muscle in vivo. J. Clin. Invest. 100, 169–179 (1997). [DOI] [PMC free article] [PubMed] [Google Scholar]
- 67.Martin M Cutadapt removes adapter sequences from high-throughput sequencing reads. EMBnet J. 17, 10–12 (2011). [Google Scholar]
- 68.Dobin A et al. STAR: ultrafast universal RNA-seq aligner. Bioinformatics 29, 15–21 (2013). [DOI] [PMC free article] [PubMed] [Google Scholar]
- 69.Anders S, Pyl PT & Huber W HTSeq—a Python framework to work with high-throughput sequencing data. Bioinformatics 31, 166–169 (2015). [DOI] [PMC free article] [PubMed] [Google Scholar]
- 70.Love MI, Huber W & Anders S Moderated estimation of fold change and dispersion for RNA-seq data with DESeq2. Genome Biol. 15, 550 (2014). [DOI] [PMC free article] [PubMed] [Google Scholar]
- 71.Edgar R, Domrachev M & Lash AE Gene Expression Omnibus: NCBI gene expression and hybridization array data repository. Nucleic Acids Res. 30, 207–210 (2002). [DOI] [PMC free article] [PubMed] [Google Scholar]
- 72.Tamary E et al. Chlorophyll catabolism precedes changes in chloroplast structure and proteome during leaf senescence. Plant Direct 3, e00127 (2019). [DOI] [PMC free article] [PubMed] [Google Scholar]
- 73.Shalit T, Elinger D, Savidor A, Gabashvili A & Levin Y MS1-based label-free proteomics using a quadrupole orbitrap mass spectrometer. J. Proteome Res. 14, 1979–1986 (2015). [DOI] [PubMed] [Google Scholar]
- 74.Perez-Riverol Y et al. The PRIDE database resources in 2022: a hub for mass spectrometry-based proteomics evidences. Nucleic Acids Res. 50, D543–D552 (2021). [DOI] [PMC free article] [PubMed] [Google Scholar]
- 75.Mi H et al. PANTHER version 16: a revised family classification, tree-based classification tool, enhancer regions and extensive API. Nucleic Acids Res. 49, gkaa1106 (2020). [DOI] [PMC free article] [PubMed] [Google Scholar]
- 76.Nussinovitch U & Gepstein L Optogenetics for in vivo cardiac pacing and resynchronization therapies. Nat. Biotechnol. 33, 750–754 (2015). [DOI] [PubMed] [Google Scholar]
- 77.Lang D & Glukhov AV High-resolution optical mapping of the mouse sino-atrial node. J. Vis. Exp. 10.3791/54773 (2016). [DOI] [PMC free article] [PubMed] [Google Scholar]
- 78.Robinson MD, McCarthy DJ & Smyth GK edgeR: a Bioconductor package for differential expression analysis of digital gene expression data. Bioinformatics 26, 139–140 (2010). [DOI] [PMC free article] [PubMed] [Google Scholar]
- 79.Westerfield M The Zebrafish Book. A Guide for the Laboratory Use of Zebrafish (Danio rerio), 4th edn (Univ. Oregon Press, 2000). [Google Scholar]
- 80.Aleström P et al. Zebrafish: housing and husbandry recommendations. Lab. Anim. 54, 213–224 (2020). [DOI] [PMC free article] [PubMed] [Google Scholar]
- 81.Schnabel K, Wu C-C, Kurth T & Weidinger G Regeneration of cryoinjury induced necrotic heart lesions in zebrafish is associated with epicardial activation and cardiomyocyte proliferation. PLoS ONE 6, e18503 (2011). [DOI] [PMC free article] [PubMed] [Google Scholar]
Associated Data
This section collects any data citations, data availability statements, or supplementary materials included in this article.
Supplementary Materials
Data Availability Statement
RNA-seq reads were aligned to the mm10 mouse genome (https://www.ncbi.nlm.nih.gov/data-hub/genome/GCF_000001635.20/). The RNA-seq data discussed in this publication have been deposited in the National Center for Biotechnology Information’s Gene Expression Omnibus (GEO)71 and are accessible through GEO Series accession number GSE220612. The mass spectrometry proteomics data have been deposited to the ProteomeXchange Consortium via the PRIDE74 partner repository with the dataset identifier PXD038450. Data reanalyzed from O’Meara et al.40 (https://doi.org/10.1161/CIR-CRESAHA.116.304269) are readily accessible from the online article. Data reanalyzed from Quaife-Ryan et al.41 (https://doi.org/10.1161/CIRCULATIONAHA.117.028252) were downloaded from the GEO database (GSE95755). Source data are provided with this paper.


