

Abstract
Trapped ion mobility spectrometry (TIMS) was used to fractionate ions in the gas phase based on their ion mobility (V·s/cm2) followed by parallel accumulation-serial fragmentation (PASEF) in a quadrupole time-of-flight instrument to determine the effect on the depth of proteome coverage. TIMS fractionation (up to 4 gas-phase fractions) coupled to DDA-PASEF resulted in the detection of ~7,000 proteins and over 70,000 peptides overall from 200ng of human (HeLa) cell lysate per injection using a commercial 25 cm UPLC column with a 90-minute gradient. This result corresponded to ~19 and 30% increases in protein and peptide identifications, respectively, when compared to a default, single range-TIMS DDA-PASEF analysis. Quantitation precision was not affected by TIMS fractionation as demonstrated by average and median CV values that were less than 4% upon label-free quantitation of technical replicates. TIMS fractionation was utilized to generate a DDA-based spectral library for downstream DIA analysis of lower sample input using a shorter LC gradient. The TIMS-fractionated library, consisting of over 7,600 proteins and 82,000 peptides, enabled the identification of ~4,000 and 6,600 proteins from 10ng and 200ng of human (HeLa) cell lysate input, respectively, with a 20-min gradient, single-shot DIA analysis. Data are available in ProteomeXchange: identifier PXD033129.
Keywords: timsTOF Pro, ion mobility, gas-phase fractionation, DDA-PASEF, DIA-PASEF, spectral library, proteomics
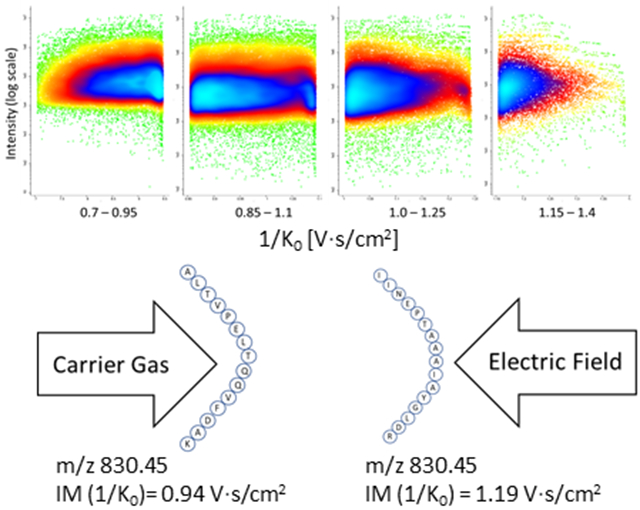
Graphical Abstract
INTRODUCTION
Instrumentation for mass spectrometry-based proteomics has significantly evolved over the years, leading to major advancements in the understanding of fundamental biological and disease-related processes at the protein level. Depth of proteome coverage is critical in this regard, where peptide fractionation in combination with DDA and DIA approaches has typically been employed in studies that aim to obtain deeper proteome coverage. The concept of multi-dimensional LC fractionation for improved mass spectrometry-based detection of peptides (derived from protein digests) was first reported by the Yates lab where in-line strong cation exchange fractionation of peptides in combination with rpHPLC-MS/MS showed significant enhancement of protein identification1-2. Further development of this approach for both in-line and offline solution-based peptide fractionation using different column chemistries has been explored and now high-pH reversed phase HPLC fractionation is commonly implemented for proteomic applications3. Gas-phase ion fractionation coupled to mass spectrometry analysis has also been explored, where the use of narrow m/z ranges to improve proteomic depth of coverage was first introduced by Spahr et al.4 and was further developed5, including as a methodology for gas-phase fractionation in DIA applications6.
LC-based peptide fractionation bears the disadvantage of negatively affecting sample throughput, necessitating the compromise between throughput and coverage desired for a specific proteomics experiment. The use of offline chromatographic approaches typically requires larger amounts of protein input, which may not be feasible to obtain for certain biological samples and can also introduce additional time and potential variability into the experiment. Gas-phase fractionation approaches offer a clear advantage since a smaller sample amount is typically needed for multiple injections or even simultaneous fractionation in real-time based on m/z ranges or through other means of ion filtering (e.g., high-field asymmetric waveform ion mobility spectrometry or FAIMS). For example, our group demonstrated the use of segmented m/z ranges as a fractionation approach to improve DDA-based peptide feature detection using an older generation quadrupole-Orbitrap (QE Plus) instrument7-8. Further studies demonstrated the utility of additional m/z segments as well as FAIMS for ion filtering (using multiple compensation voltages in the FAIMS device) on a Q Exactive HF instrument9. Compensation voltage stepping with FAIMS coupled to high-resolution MS analysis has shown great potential for deep proteome sequencing where approximately 8,000 proteins within 6 hours of instrument time were detected with microgram amounts of protein digest10 and more recently over 8,000 proteins were detected with microgram amount of HeLa digest in a 3-hour gradient run using a specialized micropillar array column in conjunction with FAIMS-Orbitrap analysis11. Further development of FAIMS coupled to newer generation Orbitrap instruments for deep proteomic analysis using shorter LC gradients12 as well as lower sample input13 has been reported.
Ion mobility (IM)-based manipulation of ions prior to MS detection has shown great potential for comprehensive single-shot proteomic coverage. The original report of a trapped ion mobility spectrometry (TIMS) device coupled to high-resolution QTOF analysis using parallel accumulation-serial fragmentation (PASEF) demonstrated the power of this approach to separate ions based on their ion mobility in conjunction with MS/MS-based peptide identification14. Accordingly, a significant aspect of TIMS-QTOF analysis is the measurement of ion mobility values (V·s/cm2), which can be used to calculate collision cross section of the peptide ions and ultimately provide a high-confidence characteristic for peptide sequence identification15. Both DDA-PASEF and DIA-PASEF have been shown to significantly improve the depth of proteomic coverage, with an advantage of doing so with minimal sample input (200 ng or less) as well as with faster analysis times (<2 hours)16-17. However, ion mobility fractionation coupled to PASEF analysis to improve proteome coverage has not been characterized.
In this study, we evaluated the utility of TIMS for gas-phase IM fractionation in combination with DDA-PASEF for fast and reproducible acquisition of deep proteome coverage at low sample input (200ng or less of human cell lysate digest per injection). The novel aspect of this approach is the fractionation of ions in the gas-phase based on measured ion mobility values (V·s/cm2), which can improve downstream ion feature detection/mapping for proteomic data analysis. Additionally, we assessed IM fractionation for generation of DDA-based libraries used for subsequent DIA-PASEF analysis at low sample input and faster gradient times, which avoids time-consuming offline sample preparation steps. This study, to the best of our knowledge, is the first to report the use of TIMS to fractionate ions based on ion mobility in the gas phase in order to improve proteomic depth of coverage in both DDA and DIA applications.
EXPERIMENTAL SECTION
Liquid Chromatography
A commercially available HeLa tryptic digest (Thermo Fisher Scientific) was resuspended in 0.1% formic acid in water, for LC-MS/MS analysis of either 200ng or 10ng total on-column injections. The HeLa digest was separated by a nanoElute UPLC system (Bruker) with an Aurora series reversed-phase C18 column (25 cm × 75 μm i.d., 1.6 μm C18, IonOpticks) heated to 50°C and coupled to a timsTOF Pro (Bruker) operated in DDA or DIA-PASEF mode. A gradient of 2-25% B, where mobile phase A was 0.1% formic acid in water and B was 0.1% formic acid in acetonitrile, was used over different lengths of time including 20 min, 45 min, 60 min, 90 min, and 150 min. Total run times, including a ramp up to 37-80% B to clean the column and prep for next sample, were 30 min, 60 min, 80 min, 120 min, and 180 min, respectively. Specifics of gradient profiles are listed in Supporting Table 1. Gradient Profile.
Mass Spectrometry
The timsTOF Pro was set to PASEF scan mode for DDA acquisition spanning 100-1700 m/z with 10 PASEF ramps. TIMS settings were 100 ms ramp and accumulation time (100% duty cycle) and ramp rate of 9.43 Hz; this resulted in 1.17 sec of total cycle time. Linear precursor repetitions were set at a 15,000 target intensity with a 2,500 intensity threshold. Active exclusion was enabled with a 0.4 min release. Collision energy remained at default with base of 1.6 1/K0 [V·s/cm2] set at 59 eV and 0.6 1/K0 [V·s/cm2] at 20 eV. Isolation widths were set at 2 m/z at <700 m/z and 3 m/z at >800 m/z. TIMS ranges were set initially from a one range 0.6-1.6 1/K0 [V·s/cm2] as seen in most published studies and further optimized and tested at a narrower range of 0.7-1.4 1/K0 [Vs/cm2]. Further IM fractionation based on ion density within that total range included: 2 ranges at 0.7-1.1 1/K0 [V·s/cm2] and 1.0-1.4 1/K0 [V·s/cm2]; 3 ranges at 0.7-1.0 1/K0 [V·s/cm2], 0.9-1.2 1/K0 [V·s/cm2], and 1.1-1.4 1/K0 [V·s/cm2]; and 4 ranges at 0.7-0.95 1/K0 [V·s/cm2], 0.85-1.1 1/K0 [V·s/cm2], 1.0-1.25 1/K0 [V·s/cm2], and 1.15-1.4 1/K0 [V·s/cm2]. Additionally, an optimized 2-IM range method was developed spanning the most ion dense regions of 0.8-1.05 1/K0 [V·s/cm2] and 1.0-1.25 1/K0 [V·s/cm2] using a longer 150 min gradient (180 min total run time) to achieve more comprehensive coverage and generate a library for subsequent DIA searches. TIMS ranges are specified in Supporting Table 2. TIMS ranges. Finally, the DIA-PASEF method was utilized with a 20 min gradient on both 200ng and 10ng HeLa in order to compare proteome coverage from low sample input in a high-throughput fashion. The m/z range default was 400-1201 with an ion mobility range of 0.6- 1.43 1/K0 [V·s/cm2], which corresponded to an estimated cycle time of 1.80 sec. DIA-PASEF windows and collision energy were also left to default with base of 0.85 1/K0 [V·s/cm2] set at 20 eV and 1.30 1/K0 [V·s/cm2] set at 59 eV. DIA windows are listed in Supporting Table 3. DIA PASEF windows. TIMS and mass calibration were performed linearly using three calibrant ions at 622, 922, and 1222 m/z (Agilent) at different ranges to match Δ1/K0 of each respective set of ranges.
Data Analysis
In order to analyze HeLa proteomic coverage and quantification between the different TIMS ranges and DDA-PASEF methods, MSFragger18 (v. 3.2) within FragPipe (v.15.0) was implemented to search raw data against the Uniprot Homo sapiens database (UP000005640, 75,777 entries). Default parameters were utilized for label-free quantification (LFQ) via IonQuant within FragPipe with and without match-between-runs (MBR) except minimum ion count was set to 1. DIA raw data were searched in DIA-NN (v. 1.8) against a generated library from IM-fractionated DDA-PASEF data, which were built with EasyPQP within FragPipe. Further data analysis and visualization was then performed in Perseus19 (v.1.6.15.0) and GraphPad Prism 9. In Perseus, data were filtered where only protein groups of Homo sapiens were kept before being log2 transformed. We then noted the number of protein groups that were identified from each replicate and number of proteins with 2 unique peptides or more before filtering out any proteins that did not have a value in all replicates. This approach was repeated for the peptides file generated by MSFragger as well for each condition. In GraphPad Prism, along with identification values being compiled, averages, standard deviations, and coefficients of variation (CVs) were calculated, and graphs were created to help visualize the differences between the varying TIMS ranges. Filtered lists containing quantifiable proteins were uploaded to Ingenuity Pathway Analysis (IPA) in order to determine differences in enriched canonical pathways. Significance of enrichment was determined by a Fisher’s exact test with Benjamini-Hochberg corrected p-value < 0.05. Quantifiable proteins were color-coded as red (< 10% CV), gray (10-20% CV), or green (20-30% CV). Data have been deposited to the ProteomeXchange Consortium via the PRIDE20 partner repository with the data set identifier PXD033129.
RESULTS AND DISCUSSION
TIMS-QTOF analysis of 200 ng Hela cell lysate digest using the default 0.6-1.6 1/K0 ion mobility (IM) range allowed visualization of peptide ion density at 90 min gradient run time (Fig. 1A) and demonstrated the detection of ions spanning the entire IM range. However, we observed a much higher density of peptide ions within the 0.8-1.2 1/K0 range with a subsequent density gradient outside that range and minimal detection on the outer edges. We therefore adjusted the IM range to 0.7-1.4 1/K0 in order to potentially improve peptide ion detection and associated peptide and protein identification. As shown in Fig. 1B, the narrower IM acquisition range of 0.7-1.4 1/K0 allowed for more targeted analysis of the ion dense region. Both 45- and 90-min gradients were then evaluated with both the default and narrower IM range, where a significant improvement in both peptide and protein identification was observed after narrowing the IM range (summarized in Fig. 1C-F). Specifically, 5517 proteins and 46,531 peptides on average per run with MBR (5,162 and 41,845 peptides without MBR) were detected with the 45 min gradient compared to 5,828 proteins and 51,615 peptides on average per run (5,541 proteins and 46,697 peptides without MBR) with the narrower IM range. Further DDA-PASEF analysis using a longer (90 min) gradient showed a similar result where 5,884 proteins and 55,656 peptides on average per run increased to 6,260 proteins and 62,823 peptides with a narrower IM range (5,667 proteins and 51,370 peptides increased to 6,007 and 56,508 peptides on average per run without MBR). The approximate 10-13% and 6-7% increase in peptide and protein identifications, respectively, shows that even with loss of peptide ion detection on the outer edges (0.6-0.7 and 1.4-1.6 IM ranges), there is still a significant overall gain by targeting the more ion dense region by DDA-PASEF. These results highlight the importance of IM range optimization to enhance protein identification using TIMS-QTOF analysis.
Figure 1.

Optimization of single TIMS range with DDA-PASEF analysis. Comparison of peptide ion density within the default range of 0.6-1.6 1/K0 (A) to the narrowed range of 0.7-1.4 1/K0 (B) for 200ng of HeLa digest. Average protein identification per run, both with and without MBR, with a 45 min gradient (C) and 90 min gradient (D) DDA-PASEF analysis, which shows the effect of narrowing the TIMS ion mobility range. The effect of narrowing the TIMS range on average peptide identification per run, with and without MBR, in both 45 min gradient (E) and 90 min gradient (F) DDA-PASEF analysis. Error bar represents +SD.
The optimization of IM range prompted us to further investigate IM fractionation using multiple, smaller IM ranges in order to improve detection of peptide ions, especially when considering the ion-dense IM region of 0.8-1.2 1/K0. Accordingly, we investigated multiple IM ranges (2, 3, and 4) for DDA-PASEF analysis within the optimized IM range of 0.7-1.4 1/K0. As fractions across the IM range increased, we narrowed the IM range for each fraction but kept the overlap between fractions constant (Δ1/K0 of 0.1). As shown in Fig. 2, peptide and protein identifications were significantly increased upon comparison of the 4 IM fractionation approach to the single optimized IM range (0.7-1.4 1/K0), where a 13% and 23.6% increase in protein and peptide identifications, respectively, was observed in a 45 min gradient. For a longer gradient time of 90 min, a 10.3% and 15.9% increase in protein and peptide identifications, respectively, was observed. For the 4 IM approach, we detected 7,129 total proteins, where 6998 proteins and 72,680 peptides were identified on average per run. TIMS fractionation (4 fractions) coupled to DDA-PASEF resulted in an 18.9 and 30.6% increase in protein and peptide identifications, respectively, when compared to the default, single IM range (0.6-1.6 1/K0) DDA-PASEF analysis of 200 ng HeLa digest.
Figure 2.

Effect of TIMS fractionation on protein and peptide coverage. Comparison of protein identification in 45 min gradient (A) and 90 min gradient (B) DDA-PASEF analysis of 200ng HeLa digest where 1 fraction represents the optimized full IM range of 0.7-1.4 1/K0 followed by 2 fractions consisting of 0.7-1.1 1/K0 and 1.0-1.4 1/K0; 3 fractions consisting of 0.7-1.0 1/K0, 0.9-1.2 1/K0, and 1.1-1.4 1/K0; 4 fractions consisting of 0.7-0.95 1/K0, 0.85-1.1 1/K0, 1.0-1.25 1/K0, 1.15-1.4 1/K0. Peptide identification obtained with 45 min gradient (C) and 90 min gradient (D) DDA-PASEF analysis.
Given the somewhat stochastic nature of DDA, particularly so for lower-abundance peptide detection, we then compared the cumulative increase of peptide and protein identification with multi-range TIMS fractionation to the increase observed with multiple technical replicates of the same 1 IM range DDA-PASEF analysis. We observed that the protein and peptide identification increase by adding multiple, different IM fractions is significantly higher compared to the cumulative increase from additional technical replicates of a single ion mobility range (Fig. 3A-D, no MBR in this comparison). Interestingly, there was a lower gain in protein identification at higher TIMS fraction ranges (3 and 4) for the shorter gradient time of 45 min. Additionally, we observed that at higher gradient times, the peptide identification enhancement was modest for higher multi-IM fractionation compared to technical replicate analysis of the single-IM range; however, protein identification was still significantly higher, indicating that multi-IM fractionation tends to identify more unique peptides corresponding to additional unique proteins compared to additional unique peptides of the same proteins. Results from this comparison also show the differences in peptide and protein identification at different gradient/run times and number of IM ranges used for fractionation, which can be used to guide experimental optimization on a case-by-case basis.
Figure 3.

Cumulative protein and peptide identifications from TIMS fractionation compared to technical replicates of a single TIMS range. Protein identification obtained from 45 min gradient (A) and 90 min gradient (B) DDA-PASEF analysis of 200ng HeLa digest showing the cumulative increase based on number of TIMS fractions (solid line, error bars represent ± SD) compared to technical replicates of the optimized single TIMS range (dashed line). Cumulative increase comparison at the peptide level for the same 45 min (C) and 90 min (D) DDA-PASEF analyses.
We next assessed the integrity of ion mobility-based fractionation as well as the quantitation precision using multi-range TIMS fractionation. Fig. 4A-D shows the normalized peptide ion density for each IM range within the 4-IM DDA-PASEF analysis. The results show clear and reproducible fractionation of each IM range and strikingly show a dynamic range of approximate 5 orders of magnitude related to LFQ values. However, it is clear that the majority of peptide density in each fraction spans approximately two orders of magnitude in terms of LFQ abundance, which is more apparent in the IM range of 0.8-1.2 1/K0. Based on the visualization of the peptide density data, it would presumably be advantageous to narrow these peptide-rich IM regions in order to improve peptide detection compared to a single default range, which is demonstrated by the total increase in protein identification (Figure 4E,F). By analyzing each IM range separately by DDA-PASEF and then combining into one overall run for database searching and LFQ-based quantitation, there is the potential of introducing variability into the analysis. Within the single IM-range DDA-PASEF analysis, 6,156 out of 6,358 proteins could be quantified with a precision of <30% CV (5,827 proteins quantified at <10% CV), which corresponds to 96.8% of the proteome dataset. With the highest multi-IM range approach (4 Frac), 7,129 total proteins were identified where 6,866 proteins were quantified with a precision of <30% CV (6,383 proteins quantified at <10% CV) corresponding to 96.3% of the detected proteome. Moreover, quantitation precision was maintained upon multi-range IM fractionation based on the average and median CV of 3.96% and 2.41%, respectively, obtained for the 4 IM approach compared to average and median CV values of 3.48% and 2.17%, respectively, with single IM-range DDA-PASEF.
Figure 4.

Effect of TIMS fractionation on peptide detection and quantitation. Four fraction TIMS DDA-PASEF analysis showing peptide ion density within the 0.7-0.95 1/K0 (A), 0.85-1.1 1/K0 (B), 1.0-1.25 1/K0 (C), and 1.15-1.4 1/K0 (D). Accurate and reproducible measurement of peptide IM values was observed. Quantitation precision is not affected by multi-range TIMS fractionation as demonstrated by the number of quantifiable proteins at a specific % CV cutoff as well as the overall median and average % CV values obtained upon comparison to single range TIMS DDA-PASEF analysis for 1 Frac (E) compared to 4 Frac (F).
Related to overlap as well as unique identifications when comparing the single TIMS range DDA-PASEF results to the most fractionated sample by ion mobility (4 TIMS fractions), we observed a significant number of unique identifications with TIMS fractionation as shown in the Venn diagram in Fig. 5A. Interestingly, unique identifications were observed with the single TIMS range DDA-PASEF analysis, indicating both an improvement in protein identification but also that the two approaches are complementary. Additionally, TIMS fractionation resulted in improved bioinformatic analysis in which certain canonical pathways were significantly enriched using IPA while still maintaining high quantitation precision for the uniquely identified targets (Fig. 5B-C).
Figure 5.

TIMS fractionation provides complementary coverage and improves bioinformatic analysis. Differences between quantifiable unique IDs are shown in the qualitative Venn Diagram (A). Ingenuity Pathway Analysis reveals several targets within IL10 signaling pathway (B) were only detected in TIMS fractionated data with high quantitation precision (C). This pathway was significantly enriched in TIMS fractionated data (p=0.02, Fisher’s exact test with B-H correction) and NS (p=0.12) with standard DDA acquisition.
The majority of peptide ion density within the IM range of 0.8-1.2 1/K0 prompted us to optimize DDA-PASEF analysis specifically within this range based on the consideration of both proteome coverage and instrument time. We therefore optimized a 2-IM range fractionation approach within the 0.8-1.2 1/K0 range but employed a longer (150 min gradient) DDA-PASEF analysis. The overall run time with 2 injections (for 2 separate IM ranges) was 6 hours where 400 ng of total protein (2 x 200ng HeLa digest) was used. We identified 7,615 proteins and 82,241 peptides overall (n=3 technical replicates) as shown in Fig. 6A-B. Quantitation precision and reproducibility was maintained at a high level with 7,101 quantifiable proteins detected in all 3 replicates (6,426 proteins quantified at <10% CV). The 2 IM fraction DDA-PASEF analysis within the peptide dense IM range of 0.8-1.2 1/K0 (comprised of ranges 0.8–1.05 1/K0 and 1.0–1.25 1/K0) showed comparable (total and quantifiable) protein and peptide coverage to results obtained from DIA analysis of HeLa digest from the original report of DIA-PASEF on a TIMS-QTOF instrument17. It is also noteworthy that we obtained approximately 90% of recently reported protein identification rates (~8000 proteins), which were obtained by DDA utilizing FAIMS-hybrid orbitrap analysis and/or specialized chromatography10-11. The clear advantage of TIMS-QTOF analysis was that individual ion mobility measurements were obtained for every peptide detected and that ~7,300 proteins per run was obtained with 5-10 times less sample input [200ng versus microgram(s) injection amount].
Figure 6.

Optimization of 2-range TIMS DDA-PASEF for in-depth quantitative proteomics as well as spectral library building for DIA-PASEF. Two IM-range DDA-PASEF analysis was performed within the ion dense region of 0.8-1.25 1/K0 at a longer gradient time (150 min) where over 7,300 proteins (A) and 71,000 peptides (B) on average per run were identified. Quantitation precision was maintained for over 7,000 proteins. Overall, a spectral library of 82,241 peptides corresponding to 7,615 proteins was generated for subsequent DIA-PASEF analysis. A shorter gradient time of 20 min was utilized for DIA-PASEF analysis of both 10ng and 200ng HeLa digest, where significant single-shot coverage at the protein (C) and precursor (D) level was obtained.
Because we generated a fairly extensive DDA-PASEF library based on the 2 IM fraction DDA-PASEF analysis (82,214 peptides corresponding to 7,615 proteins from MSFragger), we then assessed if this experimental library could be utilized for DIA-PASEF analysis of the same HeLa digest, however, this time with a much shorter gradient time of 20 min and using both 10 and 200 ng input material. Impressively, DIA-PASEF analysis of 200 ng HeLa using the gas-phase IM library from MSFragger and subsequent use in DIA-NN analysis, resulted in identification of 62,783 precursors corresponding to 6,654 proteins on average per run, which is 87.4% of the original protein library captured in just 30 min total runtime. Using a much lower sample input of 10 ng HeLa digest, DIA-PASEF analysis identified 21,985 precursors corresponding to 4,092 proteins on average per run. The results show that not only can the optimized 2 IM-range DDA-PASEF be used to obtain comprehensive and reproducible quantifiable proteome coverage on its own, but the gas-phase fractionation data can also be a powerful approach to build spectral libraries for DIA applications aimed at shorter analysis times and lower sample input.
CONCLUSIONS
TIMS fractionation in combination with DDA-PASEF is a useful approach to significantly increase the depth of proteome coverage. The results from this report show that TIMS fractionation still maintains high quantitation precision, which allows for more comprehensive quantitative proteomics with comparable coverage to DIA analysis. Another interesting advantage of this approach is that custom experimental DDA spectral libraries can be generated for DIA as well as PRM applications with minimal sample consumption (nanogram level of protein digest) and instrument time (~30min single-shot run time) needed. Further project-specific optimization can be performed including customization of the number of fractions and/or ion mobility range widths within the detectable peptide ion mobility space (with TIMS calibration using custom calibrant ions) as well as sample injection amount based on ion density within a certain ion mobility fraction.
Although TIMS fractionation was shown to increase peptide and protein identifications, future work is needed to delineate the various factors that potentially contribute to this effect. These factors include the possibilities of increased dynamic range, increased ion mobility resolution by narrowing the ion mobility range while maintaining the same ramp rate, and/or DDA enhancement by releasing less complex ion populations through narrower ion mobility windows.
While this approach currently analyzes multiple IM ranges through separate injections and combines these data into one overall run or replicate, we envision that simultaneous acquisition of multiple IM ranges could be performed in real-time without compromising depth of coverage given the fast MS and MS/MS spectral acquisition rate of the timsTOF Pro used in this study. Moreover, TIMS-QTOF offers flexibility to measure ion mobility of all peptides detected within user-defined ion mobility (V·s/cm2) ranges, thus adding to peptide identification and feature mapping confidence for comprehensive quantitative proteomic analysis using both DDA- and DIA-PASEF approaches.
Supplementary Material
Supporting Table 1. Gradient Profile.
Supporting Table 2. TIMS Ranges.
Supporting Table 3. DIA PASEF Windows.
ACKNOWLEDGMENT
We thank Chris Adams and Conor Mullens from Bruker for fruitful discussions and critically reading this manuscript. We also thank the NIH/NIAAA for funding, grant number AA026082.
REFERENCES
- 1.Link AJ; Eng J; Schieltz DM; Carmack E; Mize GJ; Morris DR; Garvik BM; Yates JR 3rd, Direct analysis of protein complexes using mass spectrometry. Nat Biotechnol 1999, 17 (7), 676–82. [DOI] [PubMed] [Google Scholar]
- 2.Washburn MP; Wolters D; Yates JR 3rd, Large-scale analysis of the yeast proteome by multidimensional protein identification technology. Nat Biotechnol 2001, 19 (3), 242–7. [DOI] [PubMed] [Google Scholar]
- 3.Yang F; Shen Y; Camp DG 2nd; Smith RD, High-pH reversed-phase chromatography with fraction concatenation for 2D proteomic analysis. Expert Rev Proteomics 2012, 9 (2), 129–34. [DOI] [PMC free article] [PubMed] [Google Scholar]
- 4.Spahr CS; Davis MT; McGinley MD; Robinson JH; Bures EJ; Beierle J; Mort J; Courchesne PL; Chen K; Wahl RC; Yu W; Luethy R; Patterson SD, Towards defining the urinary proteome using liquid chromatography-tandem mass spectrometry. I. Profiling an unfractionated tryptic digest. Proteomics 2001, 1 (1), 93–107. [DOI] [PubMed] [Google Scholar]
- 5.Yi EC; Marelli M; Lee H; Purvine SO; Aebersold R; Aitchison JD; Goodlett DR, Approaching complete peroxisome characterization by gas-phase fractionation. Electrophoresis 2002, 23 (18), 3205–16. [DOI] [PubMed] [Google Scholar]
- 6.Panchaud A; Scherl A; Shaffer SA; von Haller PD; Kulasekara HD; Miller SI; Goodlett DR, Precursor acquisition independent from ion count: how to dive deeper into the proteomics ocean. Anal Chem 2009, 81 (15), 6481–8. [DOI] [PMC free article] [PubMed] [Google Scholar]
- 7.Guergues J; Zhang P; Liu B; Stevens SM Jr., Improved Methodology for Sensitive and Rapid Quantitative Proteomic Analysis of Adult-Derived Mouse Microglia: Application to a Novel In Vitro Mouse Microglial Cell Model. Proteomics 2019, 19 (11), e1800469. [DOI] [PMC free article] [PubMed] [Google Scholar]
- 8.Guergues J; Wohlfahrt J; Zhang P; Liu B; Stevens SM Jr., Deep proteome profiling reveals novel pathways associated with pro-inflammatory and alcohol-induced microglial activation phenotypes. J Proteomics 2020, 220, 103753. [DOI] [PMC free article] [PubMed] [Google Scholar]
- 9.Pfammatter S; Wu Z; Bonneil E; Bailey DJ; Prasad S; Belford M; Rochon J; Picard P; Lacoursiere J; Dunyach JJ; Thibault P, Integration of Segmented Ion Fractionation and Differential Ion Mobility on a Q-Exactive Hybrid Quadrupole Orbitrap Mass Spectrometer. Anal Chem 2021, 93 (28), 9817–9825. [DOI] [PubMed] [Google Scholar]
- 10.Hebert AS; Prasad S; Belford MW; Bailey DJ; McAlister GC; Abbatiello SE; Huguet R; Wouters ER; Dunyach JJ; Brademan DR; Westphall MS; Coon JJ, Comprehensive Single-Shot Proteomics with FAIMS on a Hybrid Orbitrap Mass Spectrometer. Anal Chem 2018, 90 (15), 9529–9537. [DOI] [PMC free article] [PubMed] [Google Scholar]
- 11.Stejskal Karel, J. O. d. B., Matzinger Manuel, Gerhard Dürnberger, Boychenko Oleksandr, Jacobs Paul, Mechtler Karl, Analysis of 8000 proteins and reduced carry over significantly increase the throughput of single-shot proteomics. bioRxiv 2022. DOI: 10.1101/2021.11.28.470272. [DOI] [Google Scholar]
- 12.Bekker-Jensen DB; Martinez-Val A; Steigerwald S; Ruther P; Fort KL; Arrey TN; Harder A; Makarov A; Olsen JV, A Compact Quadrupole-Orbitrap Mass Spectrometer with FAIMS Interface Improves Proteome Coverage in Short LC Gradients. Mol Cell Proteomics 2020, 19 (4), 716–729. [DOI] [PMC free article] [PubMed] [Google Scholar]
- 13.Stejskal K; Op de Beeck J; Durnberger G; Jacobs P; Mechtler K, Ultrasensitive NanoLC-MS of Subnanogram Protein Samples Using Second Generation Micropillar Array LC Technology with Orbitrap Exploris 480 and FAIMS PRO. Anal Chem 2021, 93 (25), 8704–8710. [DOI] [PMC free article] [PubMed] [Google Scholar]
- 14.Meier F; Brunner AD; Koch S; Koch H; Lubeck M; Krause M; Goedecke N; Decker J; Kosinski T; Park MA; Bache N; Hoerning O; Cox J; Rather O; Mann M, Online Parallel Accumulation-Serial Fragmentation (PASEF) with a Novel Trapped Ion Mobility Mass Spectrometer. Mol Cell Proteomics 2018, 17 (12), 2534–2545. [DOI] [PMC free article] [PubMed] [Google Scholar]
- 15.Meier F; Kohler ND; Brunner AD; Wanka JH; Voytik E; Strauss MT; Theis FJ; Mann M, Deep learning the collisional cross sections of the peptide universe from a million experimental values. Nat Commun 2021, 12 (1), 1185. [DOI] [PMC free article] [PubMed] [Google Scholar]
- 16.Demichev Vadim, F. Y., Teo Guo Ci, Szyrwiel Lukasz, Rosenberger George A., Decker Jens, Kaspar-Schoenefeld Stephanie, Lilley Kathryn S., Mülleder Michael, Nesvizhskii Alexey I., Ralser Markus, High sensitivity dia-PASEF proteomics with DIA-NN and FragPipe. bioRxiv 2021. DOI: 10.1101/2021.03.08.434385. [DOI] [Google Scholar]
- 17.Meier F; Brunner AD; Frank M; Ha A; Bludau I; Voytik E; Kaspar-Schoenefeld S; Lubeck M; Raether O; Bache N; Aebersold R; Collins BC; Rost HL; Mann M, diaPASEF: parallel accumulation-serial fragmentation combined with data-independent acquisition. Nat Methods 2020, 17 (12), 1229–1236. [DOI] [PubMed] [Google Scholar]
- 18.Yu F; Haynes SE; Teo GC; Avtonomov DM; Polasky DA; Nesvizhskii AI, Fast Quantitative Analysis of timsTOF PASEF Data with MSFragger and IonQuant. Mol Cell Proteomics 2020, 19 (9), 1575–1585. [DOI] [PMC free article] [PubMed] [Google Scholar]
- 19.Tyanova S; Temu T; Sinitcyn P; Carlson A; Hein MY; Geiger T; Mann M; Cox J, The Perseus computational platform for comprehensive analysis of (prote)omics data. Nat Methods 2016, 13 (9), 731–40. [DOI] [PubMed] [Google Scholar]
- 20.Perez-Riverol Y; Bai J; Bandla C; Garcia-Seisdedos D; Hewapathirana S; Kamatchinathan S; Kundu DJ; Prakash A; Frericks-Zipper A; Eisenacher M; Walzer M; Wang S; Brazma A; Vizcaino JA, The PRIDE database resources in 2022: a hub for mass spectrometry-based proteomics evidences. Nucleic Acids Res 2022, 50 (D1), D543–D552. [DOI] [PMC free article] [PubMed] [Google Scholar]
Associated Data
This section collects any data citations, data availability statements, or supplementary materials included in this article.
Supplementary Materials
Supporting Table 1. Gradient Profile.
Supporting Table 2. TIMS Ranges.
Supporting Table 3. DIA PASEF Windows.