

Abstract
This data article presents electricity demand data on common household appliances in the Dominican Republic and therefore in the Caribbean region, as well as appliances whose demand characteristics are maintained regardless of geographic location. A one-hour record is made in most cases, for 17 household appliances, containing information on power demand, effective current, power factor and harmonic distortion of voltage and current. The average, minimum, and maximum values of each parameter for one minute are provided. The data were obtained using the Fluke-1738 electrical network analyzer. The data can be used to build demand profiles in the residential or commercial sector, depending on the composition of electrical appliances and the hours of use, dimension photovoltaic systems for self-consumption and emergency electrical sources. Although the number of household appliances and conditions of use of some appliances do not constitute a representative sample, the dataset and the measurement method constitute a starting point for obtaining this type of records, which are scarce in the literature.
Keywords: Electric network analyzer, Electric power profile, Power factor, Energy consumed
Specifications Table
| Subject | Energy Engineering and Power Technology |
| Specific subject area | household appliance power demand profile and power factor |
| Data format | Raw Filtered Change of format and specifications |
| Type of data | FCA2 files CSV files xlsx files Images |
| Data collection | Data from July 8th 2023 to August 22nd 2023:
|
| Data source location | Institution: Instituto Especializado de Estudios Superiores Loyola (IEESL). City/: San Cristóbal. Country: Dominican Republic. Latitude and longitude for collected data: Lat.: 18.41, Long.: 70.10. |
| Data accessibility | Repository name: Electrical dataset of household appliances in operation in one apartment[1] Data identification number: 10.17632/vn2cks9vdr.2 Direct URL to data: https://data.mendeley.com/datasets/vn2cks9vdr/2 |
1. Value of the Data
-
•
The data set provides the power profile and others electrical parameters of the most common household appliances in a middle-class family in the Dominican Republic. This information does not appear on the nameplate of the appliances and is scarce in the literature.
-
•
The joint demand profile of a home is usually analyzed and used, but not individually for each appliance. Individual profiles allow for a better understanding of the electrical behavior of different appliances according to the time and the conditions of use.
-
•
The dataset can be mainly useful for electrical engineers, power demand planners, inverters sizing, emergency generators, other low voltage engineering applications or carry out research.
-
•
Researchers can use the dataset to estimate energy demand based on the electrical appliances used and thus the cost of the household bill, estimation of the power factor according to the type of household appliances, the sizing of photovoltaic self-consumption and other research.
2. Background
The demand for electrical energy is increasing and the residential sector represents approximately 22 % of this [2]. The increase in the participation of renewable energies makes the operation of power systems more unstable and expensive. This has motivated the study of demand response management, including in the residential sector, as a measure to match generation with demand [3]. From the point of view of residential photovoltaic self-consumption, it is necessary to know the energy demand profile for the sizing of photovoltaic systems that operate without surpluses [4]. The data set presented in this work is intended for the prediction, design and construction of demand profiles based on individual demand dataset for household appliances. This information can be used to predict the energy consumed in correspondence with the use of certain appliances and the time of use, as well as the power demanded, information that can be used for energy planning, sizing emergency generation systems, electrical inverters, residential photovoltaic self-consumption and other low voltage applications.
3. Data Description
The measurements were carried out in an apartment in San Cristóbal, province of the Dominican Republic. A middle-class family lives in the apartment, consisting of two adults, two children and a teenager; a domestic worker usually stays in the apartment during the day, Monday through Friday. A criterion for choosing household appliances was not applied, but rather the availability of the electrical network analyzer and access to the apartment of one of the authors was taken advantage of.
It should be noted that the measurements were carried out with the appliances in natural operation (protecting the instrument and taking electrical safety measures), except for the compact fluorescent lamps, which, being connected to the ceiling, had to be connected to an experimental socket that allowed the use of the measuring instrument.
Most equipment has a little variable power demand, so that its profile and electrical energy consumption can be scaled to a longer or shorter time, starting from one hour of measurement with a resolution of one minute. Within this group of appliances are laptops, compact fluorescent lamps, wall fans, televisions, television boxes and routers. Due to the variability in their power demand, other appliances require a measurement interval greater or less than one hour. For refrigerators, a measurement time of 24 h was considered for one case and 4 h for another (due to some limitations). For air conditioning, a measurement interval equal to that of its usual use was considered. In the case of appliances that are rarely used per week, such as washing machines and irons, some minutes were considered with a resolution of seconds, in order to capture the variations. The appliances and measurement context are listed in Table 1 so that the data sets can be used reasonably.
Table 1.
List of appliances and measurement context.
| # | Type | File name | Measurement time | Resolution | Measurement context |
|---|---|---|---|---|---|
| 1 | Air conditioner | AA1 | 8 h 5 min 36 s | 1 min | The room has dimensions of 5.40 m x 3.30 m x 2.63 m and sleeps two adults. The outdoor side and the indoor temperature were 28 °C and 22 °C, respectively. The equipment is usually only used when going to bed. |
| 2 | Lightbulb | CFL1 | 1 h 0 min 0 s | 1 min | The Light bulb had to be plugged into an experimental socket in to use the Fluke analyzer. |
| 3 | Electric iron | Electric iron | 22 min 0 s | 1 s | Only a couple of clothes were ironed, this is why the measurement time is short. |
| 4 | FAN WALL | FAN WALL1 | 1 h 0 min 0 s | 1 min | The fan is used at the lowest speed of three that have. |
| 5 | FRIDGE | FRIDGE1 | 1 d 0 h 0 min 0 s | 1 min | Normal usage context. |
| 6 | FRIDGE | FRIDGE2 | 2 h 53 min 37 s | 1 min | This measurement was carried out in a other place different to the apartment and it was not possible to measure for one day. |
| 7 | LAPTOP | LAPTOP1-hp | 1 h 0 min 0 s | 1 min | The laptop was used during the measurement. |
| 8 | Monitor | Monitor-24SAMSUNG | 1 h 0 min 0 s | 1 min | The Monitor was used during the measurement. |
| 9 | Monitor | Monitor2–24DELL | 1 h 0 min 0 s | 1 min | The monitor was used during the measurement. |
| 10 | Router | Router ALTICE | 1 h 0 min 0 s | 1 min | This device is always in operation. |
| 11 | TV | TV1–32OFF | 1 h 0 min 0 s | 1 min | Demand is measured when the TV is turned off. |
| 12 | TV | TV1–32ON | 1 h 0 min 0 s | 1 min | Demand is measured when the TV is on and in use. |
| 13 | TV | TV-50ON | 1 h 0 min 0 s | 1 min | Demand is measured when the TV-50ON is turned on and in use. |
| 14 | TV-BOX | TVBOX1-OFF | 1 h 0 min 0 s | 1 min | Demand is measured when the TVBOX1 is turned off; this device is always in operation. |
| 15 | TV-BOX | TVBOX1-ON | 1 h 0 min 0 s | 1 min | Demand is measured when the TVBOX1 is turned on; this device is always in operation. |
| 16 | Washing machine | Washing machine | 20 min 13 s | 1 s | The operating time of the device was only 20 min, a very limited time for the behavior of this appliance. |
| 17 | WIFI repeater | WIFI repeater | 1 h 0 min 0 s | 1 min | This device is always in operation. |
The information consists of three data sets, which contain energy demand profiles of different household appliances as well as parameter information on energy quality, obtained with the Fluke-1738 electrical network analyzer. The three data sets are described below.
-
1.
Raw files-Appliance data: These are 17 FCA2 files that are obtained from the Fluke-1738 and processed in the “Fluke Energy Plus 3.10 software”.
-
2.
Filtered CSV files - Appliance Data: There are 17 CSV files that are exported from the 17 FCA2 files, but in this case, they contain only the most relevant information.
-
3.
Filtered xlsx files and specifications-Appliance Data: There are 17 xlsx files that are exported to Excel spreadsheets from the 17 CSV files and that additionally contain information about the plate data of each appliance, in an additional Excel spreadsheet. This data set is the final product and the reason for this documentation. Table 2 indicates the concepts and description of the information contained in the two spreadsheets within each file.
Table 2.
Description of the two sheets in each xlsx file in the folder “Filtered xlsx files and specifications”.
| Sheet 1: Appliance name _Description | |
|---|---|
| Concept | Description |
| Plate data | It refers to the plate data on each appliance, such as brand, model, voltage, power and nominal current. |
| Additional information | It refers to information that can influence the energy demand of the electrical appliance, so it must be indicated. |
| Measuring instrument | It refers to the instrument used to measure, the measurement time, the resolution, the start time and date, and the end time and date. |
| Images | It refers to images of the physical appliance, where the plate data is made visible. |
| Sheet 2: Appliance name _Data | |
| Concept | Description |
| Start (SA Western Standard Time) | Refers to the time at which the measurement begins. |
| Stop (SA Western Standard Time) | Refers to the time at which the measurement ends. |
| Trend_Period | Refers to the time resolution in seconds configured for measurements in the electrical network analyzer. |
| Voltage | It consists of three columns, with the average, minimum and maximum rms voltage in volts (V) over the chosen resolution interval, usually 1 min. |
| Current | It consists of three columns, with the average, minimum, and maximum rms current over the interval of the chosen resolution interval. |
| Voltage THD | It consists of three columns, with the average, minimum, and maximum total harmonic distortion (THD) voltage in volts (V) over the chosen resolution interval. |
| Current THD | It consists of three columns, with the average, minimum and maximum total THD current in amperes (A) over the chosen resolution interval. |
| Frequency | It consists of three columns, with the average, minimum and maximum values of the fundamental frequency in Hz during the interval of the chosen resolution. |
| Active power | It includes six columns of data:
|
| Non-Active power | It includes six columns of data:
|
| Apparent Power | It includes six columns of data:
|
| Power Factor | It includes six columns of data:
|
An example of an air conditioner profile is shown in Table 3, showing the content of the first Excel spreadsheet. In some cases, a Note is placed on information that may influence the energy demand of the appliance, in this case, the dimensions of the room and the number of people sleeping are indicated. Fig. 1 shows the images of this air conditioner.
Table 3.
Equipment datasheet and registration information.
| Place data | |
| Type | Air conditioner |
| Name | AA1 |
| Brand: | TECNOMASTER |
| Model: | M/AUJI-1818 |
| Nominal voltage (VAC): | 220.00 |
| Frequency (Hz) | 60 |
| Max. input current (A): | 10.0 |
| Capacity (BTU): | 18,000 |
| Outside temperature (Celsius grade) | 28 |
| Indoor temperature (Celsius grade) | 22 |
| Measure instrument | |
| Brand and model | Fluke-1738 |
| Measurement time | 8 h 5 min 36 s |
| Resolution time | 1 min |
| Start | 10/7/2023, 11:01:34 PM |
| End | 11/7/2023, 7:07:10 AM |
| Note: | The room has dimensions of 5.40 m x 3.30 m x 2.63 m and sleeps two adults. |
Fig. 1.

Images of AA1 air conditioner. (a) Image and data of the internal unit (evaporator) and (b) Image and data of the external unit (condenser).
Table 4 shows a fraction of the data contained in the second Excel spreadsheet, which is contained in the spreadsheet named “AA1_Data”, while the descriptive data of the equipment is found in the spreadsheet named “AA1_Descrption”, as shown in the image of Fig. 2.
Table 4.
Fraction of the measured data of air conditioner AA1 with the power network analyzer.
| Start (SA Western Standard Time) | Stop (SA Western Standard Time) | Trend_Period | Vrms_AN_avg | Vrms_AN_min | Vrms_AN_max | → |
|---|---|---|---|---|---|---|
| 01:34.2 | 02:00.0 | 60 | 241.049 | 240.544 | 241.489 | → |
| 02:00.0 | 03:00.0 | 60 | 240.134 | 239.554 | 240.808 | → |
| 03:00.0 | 04:00.0 | 60 | 239.938 | 238.997 | 240.397 | → |
| 04:00.0 | 05:00.0 | 60 | 239.578 | 239.038 | 240.08 | → |
| 05:00.0 | 06:00.2 | 60 | 239.706 | 239.227 | 239.975 | → |
| 06:00.2 | 07:00.2 | 60 | 239.843 | 239.348 | 240.271 | → |
| 07:00.2 | 08:00.2 | 60 | 240.231 | 239.881 | 240.501 | → |
| 08:00.2 | 09:00.1 | 60 | 240.087 | 239.582 | 240.428 | → |
| 09:00.1 | 10:00.1 | 60 | 240.366 | 239.918 | 240.586 | → |
| 10:00.1 | 11:00.1 | 60 | 240.357 | 239.417 | 240.71 | → |
| ↓ | ↓ | ↓ | ↓ | ↓ | ↓ |
Fig. 2.

Image of the Excel spreadsheets, to show what they look like, the first is for “Description” and the second for “Data”.
4. Experimental Design, Materials and Methods
Is remembered that the data and measurements have been collected in an apartment in the Dominican Republic, in the province of San Cristóbal (Lat, Lng: 18.41, −70.10). The measurements were carried out with the Fluke 1738 electrical network analyzer.
4.1. Description of measurement and configuration equipment
The Power Logger 1738 is a compact device for conducting energy and power quality studies. It contains an integrated touch screen and a USB Flash port that allows you to easily configure, verify and download measurement sessions carried out at the measurement site itself, without the need for a computer. It has a battery, which allows you to carry out measurements for approximately one hour. For longer measurements, it must be powered from an AC input voltage source from the power cable 100–240 V 50/60 Hz 15 VAC. Fig. 3 shows the standardized elements used to make the measurements.
Fig. 3.

(A) Fluke-1738 electric network analyzer with AC power connector. (B) 4-wire cable, neutral N and lines A, B and C. (C) Two alligator clips. (D) Fluke-17xx i40s-EL current clamp.
Below are the steps to configure the equipment and start data logging
Step 1. Turn on the analyzer using the power button and select the METER option.
Step 2. Within the METER option, the following fields are filled with the options shown
Study Type: Energy study
Power quality: EN 50,160
Topology: Single Phase
Nominal voltage: 120 V
Scale factors for external PTs or CTs: 1:1
Nominal Frequency: 60 Hz
The diagram corresponding to the topology must correspond to the diagram shown in Fig. 4, these diagrams appear on the Fluke 1738 screen.
Fig. 4.
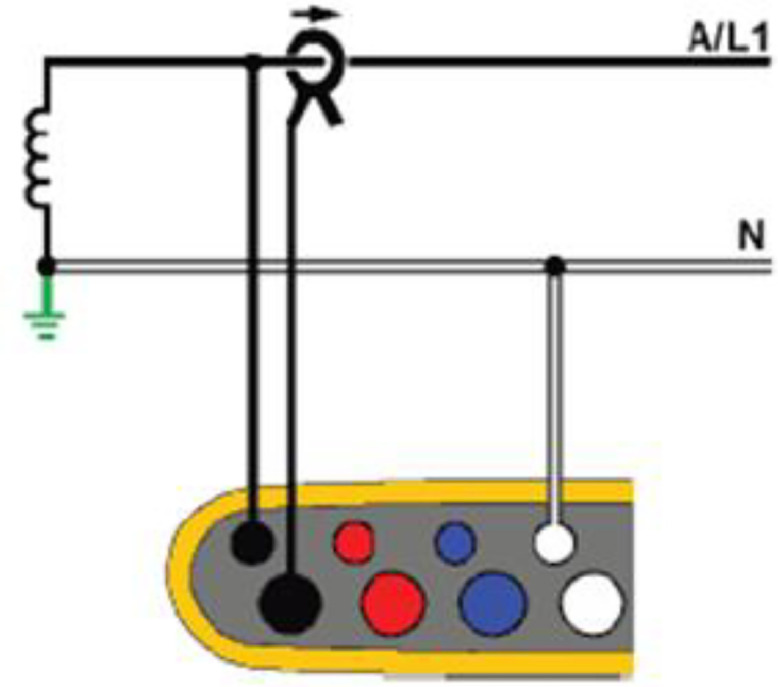
Single phase topology.
Step 3. Press the LOGGER option, within which the following log fields are filled out and the option to save is given.
Name: Laptop
Duration: 1 h 0 min 0 s
Interval of the average calculation: each 1 min
Demand Interval: 15 min
Energy costs: 0.107 USD/kWh
Description: Profile
Step 4. Finally, the starts registration option is pressed, and the analyzer begins to measure and record the parameters.
4.2. Assembly and electrical connections
The Fluke 1738 [5] is specially designed to carry out measurements on industrial electrical panels, to measure joint demand of several pieces of equipment or total demand. For this reason, an electrical extension was developed that facilitates the connection of the current clamp and the two voltage clamps, as shown in Fig. 5.
Fig. 5.

Electric extension to facilitate the connection of the electrical analyzer.
Fig. 6(A) shows a demonstrative connection to measure the demand for a 15-inch laptop. In this case, both the load and the analyzer are powered from the same outlet. For safety, during the implementation, the parts with non-insulated connections were covered, such as the table where the power strip is located, specifically where the alligator clips are connected. Fig. 6(B) shows the screen of the electrical network analyzer in the “Power” option, where the powers and power factor of the laptop are shown.
Fig. 6.

Demonstrative connection to record demand data for a laptop. (A) Demonstrative connection. (B) Power values measured by the electrical network analyzer.
4.3. Data acquisition using Fluke energy analyze plus 3.10 software
After the quantities are measured and recorded in the Fluke 1738, the following procedure was carried out:
Step 1. The log is downloaded through the Fluke 1738′s Wi-Fi or through its USB port. Once you have the log file on a laptop, it is opened using the Fluke Energy Plus 3.10 software. This software recognizes FCA2 Files.
Step 2. Select the Project Manager option, the “Export” icon, where the “CSV Export” file type is selected. In the Trend Data option, check the options shown in Fig. 7:
Step 3. The file is exported to Excel file and forms the second Excel spreadsheet, for example “AA1_Data” in Fig. 2.
Fig. 7.

Registry management for download as CSV file.
5. Limitations
The main limitation in the research was the time available to carry out measurements in the case of some household appliances, as well as the conditions of use. Appliances whose demand profile is very variable require a longer measurement time to be able to make a good scaling in the applications, for example, the washing machine, the electric iron and the fridge. Is a huge variety of appliances available in the market, which means that the number of appliances in this paper is not a representative sample; however, the data set and the measurement method constitute a starting point in obtaining this type of records, which are scarce in the literature.
Ethics Statement
The data was taken with the consent of the residents. The authors have read and followed the ethical requirements for publication in Data in Brief and confirming that the current work does not involve human subjects, animal experiments, or any data collected from social media platforms.
CRediT authorship contribution statement
Edwin Garabitos Lara: Conceptualization, Methodology, Investigation, Data curation, Writing – original draft. Alexander Vallejo Díaz: Conceptualization, Visualization, Writing – review & editing. Carlos Napoleón Pereyra Mariñez: Conceptualization, Funding acquisition.
Declaration of Competing Interest
The authors declare that they have no known competing financial interests or personal relationships that could have appeared to influence the work reported in this paper.
Acknowledgements
The authors gratefully acknowledge the financial support by Fondo Nacional de Innovación Científico y Tecnológico (Fondocyt) of the Dominican Republic, grant number 2022-3A9-140.
Contributor Information
Edwin Garabitos Lara, Email: egarabitos@ipl.edu.do, egarabitos73@uasd.edu.do.
Alexander Vallejo Díaz, Email: avallejo@ipl.edu.do.
Carlos Napoleón Pereyra Mariñez, Email: cpereyra@ipl.edu.do.
Data Availability
References
- 1.E. Garabitos Lara, “Electrical dataset of household appliances in operation in one apartment”, vol. 2, 2023, doi: 10.17632/vn2cks9vdr.2. [DOI] [PMC free article] [PubMed]
- 2.Garabitos Lara E., Vallejo Díaz A., Ocaña Guevara V.S., García F.S. Tecno-economic evaluation of residential PV systems under a tiered rate and net metering program in the Dominican Republic. Energy Sustain. Dev. 2023;72:42–57. doi: 10.1016/j.esd.2022.11.007. [DOI] [Google Scholar]
- 3.Sridhar A., et al. Residential consumer preferences to demand response: analysis of different motivators to enroll in direct load control demand response. Energy Policy. 2023;173 doi: 10.1016/j.enpol.2023.113420. [DOI] [Google Scholar]
- 4.Garabitos Lara E. Techno-economic model of nonincentivized self consumption with residential PV systems in the context of Dominican Republic: a case study. Energy Sustain. Dev. 2022;68:490–500. doi: 10.1016/j.esd.2022.05.005. jun. [DOI] [Google Scholar]
- 5.Fluke, “Fluke 1736 and 1738 three-phase power quality Loggers”. Consultado: el 22 de septiembre de 2023. [En línea]. Disponible en: https://us.fluke.com/en-us/product/electrical-testing/power-quality/1736-1738.
Associated Data
This section collects any data citations, data availability statements, or supplementary materials included in this article.