Abstract
Aims:
Mitochondrial dysfunction is closely associated with the development of diabetic complications. In diabetic retinopathy, electron transport chain is compromised and mitochondrial DNA (mtDNA) is damaged, downregulating transcription of mtDNA-encoded cytochrome B (CYTB) and its antisense long noncoding RNA, long noncoding RNA cytochrome B (LncCytB). Our goal was to investigate the role of LncCytB in the regulation of CYTB and mitochondrial function in diabetic retinopathy.
Methods:
Using human retinal endothelial cells, genetically manipulated for LncCytB (overexpression or silencing), the effect of high glucose (20 mM d-glucose) on LncCytB-CYTB interactions (by chromatin isolation by RNA purification), CYTB gene expression (by real-time quantitative polymerase chain reaction), complex III activity, mitochondrial free radicals, and oxygen consumption rate (OCR, by Seahorse XF analyzer) was investigated. Key results were confirmed in the retinal microvessels from streptozotocin-induced diabetic mice.
Results:
High glucose decreased LncCytB-CYTB interactions, and while LncCytB overexpression ameliorated glucose-induced decrease in CYTB gene transcripts, complex III activity and OCR and increase in mitochondrial reactive oxygen species, LncCytB-siRNA further attenuated CYTB gene transcription, complex III activity, and OCR. Similar decrease in LncCytB-CYTB interactions and CYTB transcription was observed in diabetic mice. Furthermore, maintenance of mitochondrial homeostasis by overexpressing superoxide dismutase or sirtuin 1 in mice ameliorated diabetes-induced decrease in LncCytB-CYTB interactions and CYTB gene transcripts, and also improved complex III activity and mitochondrial respiration.
Innovation and Conclusion:
LncCytB downregulation in hyperglycemic milieu downregulates CYTB transcription, which inhibits complex III activity and compromises mitochondrial stability and OCR. Thus, preventing LncCytB downregulation in diabetes has potential of inhibiting the development of diabetic retinopathy, possibly via maintaining mitochondrial respiration. Antioxid. Redox Signal. 39, 817–828.
Keywords: complex III, cytochrome B, diabetic retinopathy, long noncoding RNA, LncCytB, mitochondria, respiration
Introduction
Retinopathy is one of the most feared complications of diabetes and remains the leading cause of blindness in working-age adults (Cheung et al., 2010). The pathogenesis of diabetic retinopathy is very complex, and many biochemical and molecular abnormalities have been implicated in its development, but the exact mechanism of this slow progressing disease remains unclear (Kowluru and Mishra, 2015; Kowluru et al., 2015; Olivares et al., 2017). Mitochondria, in addition to producing cellular energy, are also the major source of free radical production (Turrens, 2003).
Mitochondrial dysfunction is implicated in diabetic complications, and overproduction of mitochondrial superoxide is considered to serve as a causal link between elevated glucose and many major metabolic abnormalities initiated in a hyperglycemic milieu (Nishikawa et al., 2000). In a normal physiological condition, tricarboxylic acid (TCA) cycle generates electron donors during glucose metabolism, and electrons from complex I and complex II of the electron transport chain, via complex III and complex IV, are passed to the molecular oxygen for their reduction to water (Bénit et al., 2009; Brand, 2016; Musatov and Robinson, 2012). However, due to elevated circulating glucose levels in diabetes, oxidation of glucose via TCA cycle is also increased, which increases the voltage gradient across the mitochondrial membrane, and when it reaches a critical threshold, electron transfer inside complex III is blocked, generating more superoxide (Brownlee, 2005). In the pathogenesis of diabetic retinopathy, while complex I activity remains unchanged, complex III activity is inhibited and mitochondrial superoxide levels are elevated, and diabetic mice overexpressing the gene responsible for mitochondrial manganese superoxide dismutase, Sod2, are protected from inhibition of complex III activity, increase mitochondrial superoxide and the development of diabetic retinopathy (Kanwar et al., 2007). Mitochondria are unique as they have their own DNA (mtDNA), which is only 0.1%–2% of the total DNA, and this small circular DNA has only 16.8 kb. It encodes genes for 13 proteins, all associated with the complexes of the electron transport chain. Among the 13 genes encoded by mtDNA, cytochrome B (CYTB) is the only gene of the complex III encoded by mtDNA (Bénit et al., 2009; Kvist et al., 2003), and in diabetes, mtDNA is damaged and the transcription of CYTB is decreased (Madsen-Bouterse et al., 2010). Technical advances in recent years have shown that ∼15% of the mtDNA has noncoding RNAs, which includes three major long noncoding RNAs (LncRNAs), the nonprotein coding RNAs containing >200 nucleotides with no open reading frame for translation.
Innovation
Mitochondrial dysfunction plays a critical role in the development of diabetic retinopathy. During oxidative phosphorylation, both complex I and complex III produce superoxide; however, in diabetes, voltage gradient across the mitochondrial membrane is increased and electron transfer inside complex III is blocked, making it the major superoxide source. Mitochondrial DNA (mtDNA) encodes genes for 13 proteins and three major long noncoding RNAs (LncRNAs). Cytochrome B (CYTB) is the only complex III protein translated by mtDNA-encoded CYTB gene. This is the first report showing that reduction in mtDNA-encoded antisense LncRNA, long noncoding RNA cytochrome B (LncCytB), in diabetes, downregulates CYTB transcription, which inhibits complex III activity and compromises mitochondrial stability.
There are two mtDNA-encoded LncRNAs for complex I (LncRNAs ND5 and ND6) and one for complex III (LncRNA Cytochrome B [LncCytB]) (De Paepe et al., 2018; Rackham et al., 2011), corresponding to the regions complementary to the mitochondrial ND5, ND6, and CYTB genes, respectively (Rackham et al., 2011). Our recent study has shown that LncCytB is downregulated in the retinal vasculature in diabetes, and this downregulation increases the vulnerability of mtDNA to diabetes-induced damage (Kumar et al., 2023).
Although LncRNAs lack reading frame for translation, they can regulate gene expression by binding to DNA or RNA, can act as scaffolds to promote the interaction of protein, or facilitate transcription by bringing in the transcription factor to the transcription start site (Kopp and Mendell, 2018). LncCytB is an antisense LncRNA, and these antisense LncRNAs can control gene regulation at pretranscriptional, transcriptional, and post-transcriptional levels (Villegas and Zaphiropoulos, 2015), how LncCytB affects transcription of its neighboring gene CYTB is unclear.
The goal of this study was to investigate the role of LncCytB in the regulation of CYTB and mitochondrial function in diabetic retinopathy. Using human retinal endothelial cells (HRECs), genetically manipulated for LncCytB (overexpression or silencing), we investigated the effect of high glucose on LncCytB-CYTB interactions and mitochondrial function. Key results were confirmed in the retinal microvessels from streptozotocin-induced diabetic mice.
Results
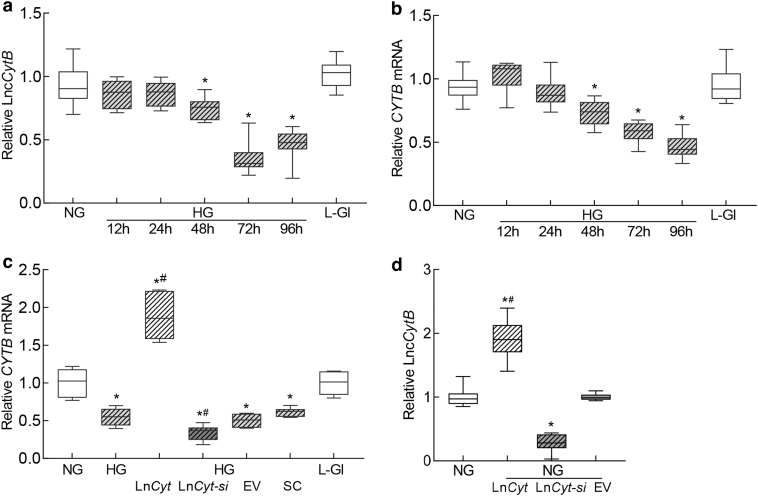
Both, LncCytB and CYTB, are downregulated in retinal capillaries in diabetes (Kumar et al., 2023; Madsen-Bouterse et al., 2010); to investigate if LncCytB and CYTB follow similar temporal relationship with the duration of high glucose insult, their expressions were quantified in HRECs incubated in high glucose from 12 to 96 h. As shown in Figure 1a, expression of LncCytB was similar in the cells incubated in normal glucose (NG) or high glucose (HG) till the duration of high glucose insult was extended to 48 h. At 72 h, LncCytB was reduced by >50% compared with cells in normal glucose, and this decrease continued up to 96 h (p < 0.05). Gene transcripts of CYTB also followed a similar temporal pattern; although at 48 h there was some decrease in CYTB mRNA, at 72 h of high glucose, it was decreased by ∼50% (Fig. 1b). Cells incubated in 20 mM l-glucose, instead of 20 mM d-glucose, had similar LncCytB and CYTB expressions as obtained from cells in normal glucose.
FIG. 1.
Temporal relationship between duration of high glucose exposure and expression of LncCytB and CYTB. HRECs incubated in high glucose for 12, 24, 48, 72, and 96 h were analyzed for (a) LncCytB transcripts by strand-specific PCR, and (b) CYTB mRNA by qRT-PCR using β-actin as a housekeeping gene. (c) Effect of LncCytB regulation on CYTB mRNA. (d) Transfection efficiency of LncCytB overexpression or si-RNA, quantified by its transcripts. Each measurement was performed in triplicate in five different cell preparations, and the values are represented as mean ± SD. LncCyt, LncCytB overexpressing plasmids; LncCyt-si, LncCytB-siRNA; NG and HG = 5 and 20 mM d-glucose; HG/LnCyt, HG/LnCyt-si, HG/EV, and HG/SC, cells transfected with LncCytB overexpressing plasmids, or LncCytB-siRNA, or empty vector or with scrambled control RNA, respectively, and incubated in high glucose for 96 h; L-Gl = 20 mM l-glucose; *p < 0.05 versus NG and #p < 0.05 versus HG. EV, empty vector; HG, high glucose; HREC, human retinal endothelial cell; NG, normal glucose; qRT-PCR, real-time quantitative polymerase chain reaction; SC, scrambled control RNA; SD, standard deviation.
To investigate the role of LncCytB in CYTB gene transcription, the effect of LncCytB regulation on CYTB mRNA was determined. Figure 1c shows that while overexpression of LncCytB increased glucose-induced CYTB gene transcripts by ∼2-fold, LncCytB-siRNA further decreased them; the values from LncCytB-siRNA–transfected cells or untransfected cells, in high glucose, were significantly different from each other (p < 0.05). Transfection of cells with the empty vector or scrambled RNA had no effect on glucose-induced decrease in CYTB mRNA. Figure 1d is included to show ∼80% increase in LncCytB expression in cells transfected with LncCytB overexpressing plasmids and ∼80% decrease in LncCytB-siRNA–transfected cells, compared with untransfected cells in normal glucose.
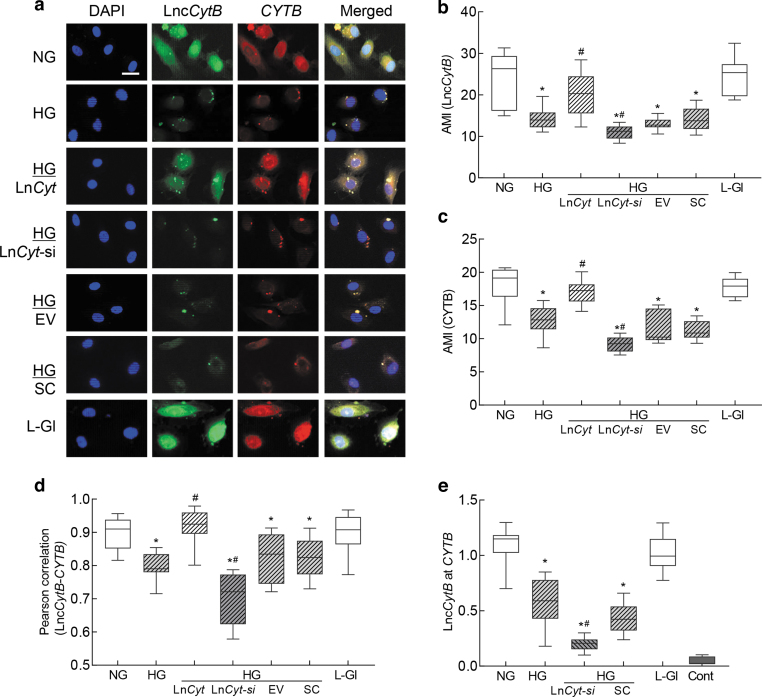
To understand interactions between LncCytB and CYTB, RNA fluorescence in situ hybridization (RNA-FISH) was performed. As expected (Kumar et al., 2023; Madsen-Bouterse et al., 2010), mean fluorescence intensities of LncCytB and CYTB were decreased by 30%–50% in high glucose compared with normal glucose, and while overexpression of LncCytB prevented glucose-induced decreases in CYTB, LncCytB-siRNA further decreased it, confirming the role of LncCytB in CYTB transcription (Fig. 2a–c). Merged fluorescence of LncCytB and CYTB, and Pearson's correlation coefficient between LncCytB and CYTB, were also significantly reduced in cells in high glucose compared with normal glucose (Fig. 2d).
FIG. 2.
Interactions between LncCytB and CYTB. RNA-FISH was performed using fluorescein 12-dUTP–labeled LncCytB probe (green) and aminoallyl-dUTP-Texas Red incorporated CYTB probe (red). (a) Representative image of RNA-FISH and (b, c) represent AMI of LncCytB and CYTB, respectively. (d) Pearson's correlation showing the coefficient of interaction between LncCytB and CYTB. (e) Binding of LncCytB at CYTB by ChIRP technique using input values as an internal control. Values in the graphs are represented as mean ± SD from four different cell preparations, with each measurement made in duplicate. NG and HG = 5 and 20 mM d-glucose; LncCyt, LncCytB overexpressing plasmids; LncCyt-si, LncCytB-siRNA; HG/LnCyt, HG/LnCyt-si, HG/EV, and HG/SC, cells transfected with LncCytB overexpressing plasmids, LncCytB-siRNA, empty vector, or scrambled control RNA, respectively, and incubated in high glucose; L-Gl = 20 mM l-glucose; Cont, LncCytB without biotin-labeled. *p < 0.05 compared with NG and #p < 0.05 compared with HG. AMI, arithmetic mean intensity; ChIRP, chromatin isolation by RNA purification; RNA-FISH, RNA fluorescence in situ hybridization.
LncCytB overexpression ameliorated glucose-induced reduction in the merged fluorescence and Pearson's correlation coefficient between LncCytB and CYTB, and LncCytB-siRNA further reduced them (p < 0.05). Cells transfected with the empty vector or scrambled RNA, and incubated in high glucose, had similar values to those from untransfected cells in high glucose. l-Glucose had no effect on either the arithmetic mean intensity of LncCytB or CYTB, or their Pearson's correlation coefficient.
Interactions between LncCytB and CYTB were further confirmed by quantifying the binding of LncCytB at CYTB using chromatin isolation by RNA purification (ChIRP) technique. Figure 2e shows >50% decrease in LncCytB binding at CYTB in high glucose compared with normal glucose, which was further downregulated in LncCytB-siRNA–transfected cells. l-Glucose had no effect on LncCytB binding at CYTB, and the values from the negative control without a LncCytB probe were <0.5% compared with cells with the probe.
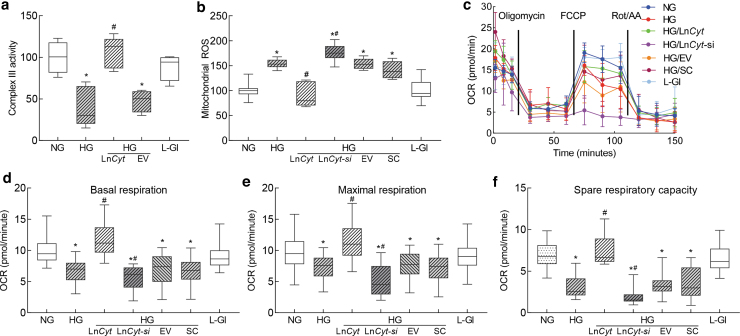
Cytochrome B is the only protein of complex III whose gene is encoded by mtDNA, and complex III is considered as one of the major sites of reactive oxygen species (ROS) production (Brand, 2016); effect of LncCytB regulation on complex III activity and mitochondrial ROS was determined. Compared with normal glucose, complex III activity was inhibited by >50% in the cells incubated in high glucose, and transfection of cells with LncCytB overexpressing plasmids, but not with the empty vector, protected them from glucose-induced inhibition of complex III activity. The values obtained from cells overexpressing LncCytB and incubated in high glucose were not different from untransfected cells incubated in normal glucose or in 20 mM l-glucose (Fig. 3a). Similarly, LncCytB overexpression also prevented glucose-induced increase in mitochondrial ROS, and LncCytB-siRNA further increased ROS levels. The values from untransfected cells or cells transfected with empty vector or scrambled RNA, incubated in high glucose, were not different from each other, but were significantly different from those obtained from cells in normal glucose (Fig. 3b). The role of LncCytB in regulation of electron transport chain was further assessed by measuring mitochondrial stress.
FIG. 3.
Regulation of LncCytB, complex III activity, and mitochondrial respiration. Isolated mitochondria were used to measure (a) complex III activity by quantifying the reduced cytochrome c at 550 nm, and (b) ROS fluorometrically using DCFH-DA. (c) OCR, (d) basal respiration, and (e) maximal respiration rates, and (f) spare respiratory capacity were measured in HRECs by Seahorse XF analyzer using Seahorse XF Cell Mito Stress Test Kit. Each sample was measured in 8–10 wells per group. Values in the graphs are mean ± SD, obtained from three different cell preparations. LncCyt, LncCytB overexpressing plasmids; LncCyt-si, LncCytB-siRNA; NG and HG = 5 and 20 mM d-glucose; HG/LnCyt and HG/EV, cells transfected with LncCytB overexpressing plasmids, or with an empty vector and incubated in high glucose for 96 h; HG/LnCyt-si and HG/SC, cells transfected with LncCytB-siRNA or with scrambled control RNA, and incubated in high glucose for 96 h; L-Gl = 20 mM l-glucose. *p < 0.05 versus NG and #p < 0.05 versus HG. DCFH-DA, 2′-7′dichlorofluorescein diacetate.
Basal respiration rate, measured before injecting regulators of complex activities, was reduced in cells in high glucose compared with normal glucose. Oxygen consumption rate (OCR) was further decreased by the addition of oligomycin, and stimulation of physiological energy demand by mitochondrial uncoupler, carbonyl cyanide 4-[trifluoromethoxy] phenylhydrazone (FCCP), elevated the demand in cells in normal glucose but had blunted effect in cells in high glucose.
Cells overexpressing LncCytB, instead of empty vector, incubated in high glucose, had a similar OCR pattern, basal and maximal respiration rates, and spare respiratory capacity as cells in normal glucose, but LncCytB-siRNA–transfected cells in high glucose had further reduction in the basal and maximal respiration rates. Scrambled RNA-transfected or untransfected cells in high glucose had similar respiration patterns (Fig. 3c–f).
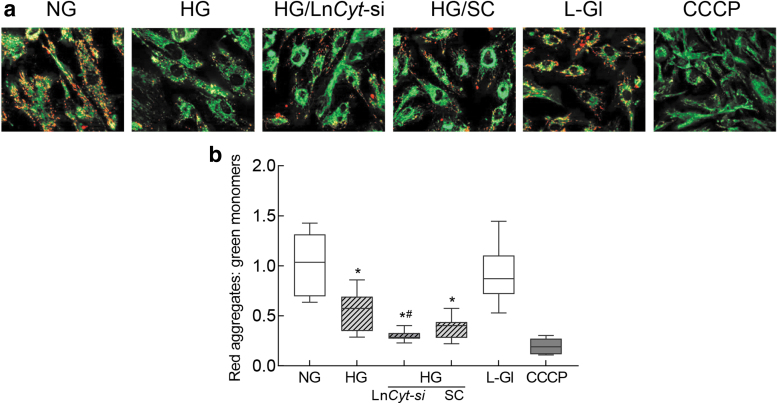
Since electron transport chain complexes help maintain mitochondrial membrane potential by transferring electrons to a subsequent complex or to molecular oxygen (van Raam et al., 2008), effect of regulation of LncCytB on mitochondrial membrane potential was determined. As expected, mitochondrial membrane potential was reduced by ∼50% in cells incubated in high glucose compared with normal glucose (Mohammad and Kowluru, 2021), and transfection with LncCytB-siRNA, not scrambled RNA, further reduced membrane potential, as shown by reduction in red fluorescent J-aggregate to green fluorescent J-monomer ratio (Fig. 4a, b). Cells in 20 mM l-glucose, instead of 20 mM d-glucose, had a similar staining pattern and red fluorescent J-aggregates and green J-monomer ratio as obtained from cells in normal glucose.
FIG. 4.
LncCytB downregulation and mitochondrial membrane potential. (a) Representative image using cationic dye JC-1 showing green (monomers) and red (aggregates). (b) Ratio of red aggregates to green monomers. Values are represented as mean ± SD from four slides per group, performed in three different cell preparations. NG = 5 mM d-glucose, HG = 20 mM d-glucose; HG/LnCyt-si and HG/SC, cells transfected with LncCytB-siRNA or scrambled control RNA and incubated in high glucose for 96 h; L-Gl = 20 mM l-glucose. *p < 0.05 compared with NG and #p < 0.05 compared with HG. CCCP, cells incubated with carbonyl cyanide 3-chlorophenylhydrazone.
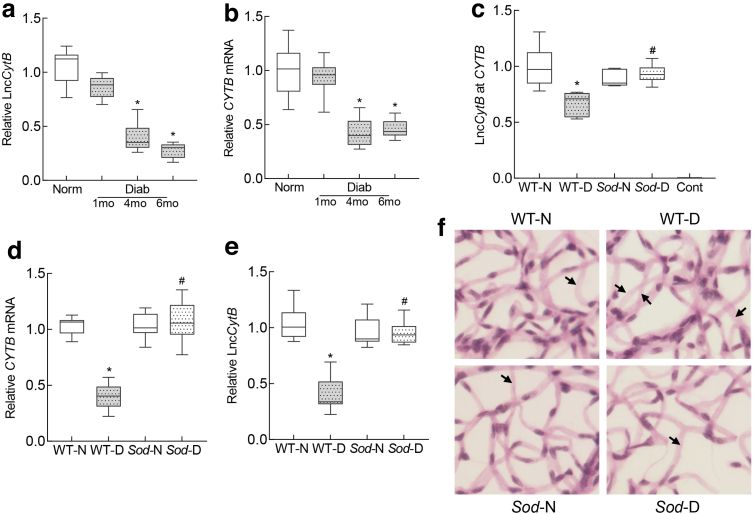
To confirm the in vitro results in animal model of diabetic retinopathy, temporal relationship between LncCytB/CYTB expression and the duration of diabetes was evaluated in the retinal microvessels from mouse diabetic for 1–6 months. Compared with normal mice, 1 month of diabetes in mice produced no significant reduction in LncCytB and CYTB expressions, but at 4 months their expressions were decreased by >50%, and they remained decreased at 6 months of diabetes (Fig. 5a, b).
FIG. 5.
LncCytB and CYTB in retinal microvasculature, and effect of Sod2 overexpression. Temporal relationship between duration of diabetes and expression of (a) LncCytB transcripts, performed by strand-specific PCR, and (b) CYTB mRNA by qRT-PCR using 18S rRNA as a housekeeping gene in retinal microvessels. Effect of Sod2 overexpression on (c) interactions between LncCytB at CYTB, quantified by ChIRP technique, (d) CYTB mRNA, measured by qRT-PCR using 18S rRNA as a housekeeping gene, and (e) LncCytB transcripts, measured by strand-specific PCR. (f) A representative image of periodic acid Schiff-hematoxylin-stained trypsin-digested retinal microvasculature; arrows indicate degenerative capillary. Values are presented as means ± SD obtained from six to eight mice in each of the four experimental groups. Cont, negative control without LncCytB probe; mo, months; Norm and Diab, C57BL/6 normal and diabetes. *p < 0.05 versus WT-N and #p < 0.05 versus WT-D. Sod-N, Sod2 overexpressing normal mice; Sod-D, Sod2 overexpressing diabetic mice; WT-N, wildtype normal; WT-D, wildtype diabetes.
Consistent with the results from HRECs in high glucose, LncCytB interactions with CYTB (quantified by ChIRP assay) were significantly decreased in the retinal microvessels from diabetic mice compared with normal mice (Fig. 5c). Overexpression of Sod2 prevented diabetes-induced decrease in LncCytB-CYTB interactions, and in the same Sod2 overexpressing diabetic mice, decrease in LncCytB and CYTB was also prevented (Fig. 5d, e). These mice were also protected from the development of histopathology, as evidenced by decreased degenerative capillaries (marked with an arrow) in their retinal vasculature (Fig. 5f).
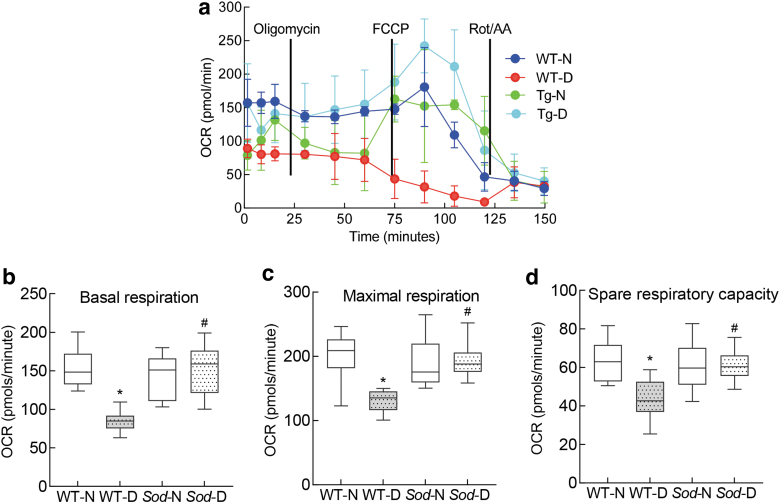
Compared with normal mice, basal and maximal respiration rates and spare respiratory capacity were also significantly reduced in diabetic mice, and the stimulation of physiological energy demand by FCCP was blunted (Fig. 6a–d). However, overexpression of Sod2 ameliorated decrease in mitochondrial respiration, and wildtype normal (WT-N) and Sod2 overexpressing normal or diabetic mice (Sod-N and Sod-D) had values that were not different from each other (p > 0.05), but were significantly different from wildtype diabetic mice (WT-D) (p < 0.05; Fig. 6).
FIG. 6.
Regulation of mitochondrial superoxide dismutase and mitochondrial respiration. (a) OCR, (b) basal respiration and (c) maximal respiration rates, and (d) spare respiratory capacity were measured in the retina by Seahorse XF analyzer using Seahorse XF Cell Mito Stress Test Kit. Each measurement was performed in five to eight mice, and the values in the graphs are mean ± SD. *p < 0.05 compared with WT-N group and #p < 0.05 compared with WT-D.
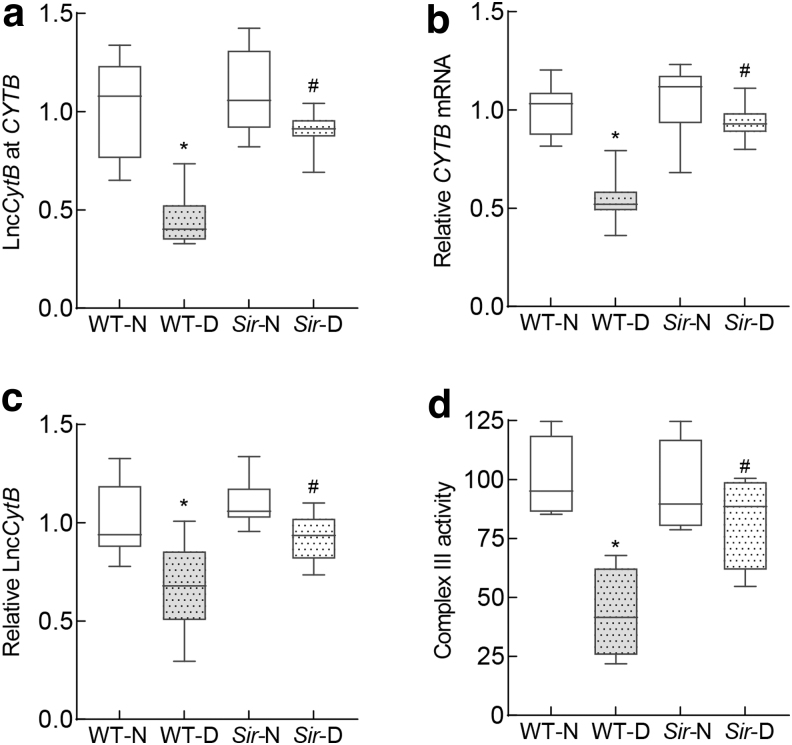
To further confirm the role of LncCytB in the regulation of CYTB in diabetic retinopathy, retinal microvessels from mice overexpressing sirtuin 1 (Sirt1), an enzyme intimately associated with mitochondrial homeostasis (Mishra et al., 2018; Nemoto et al., 2005), were analyzed. Diabetes-induced decrease in LncCytB and CYTB interactions was significantly ameliorated in diabetic mice overexpressing Sirt1, and downregulation of CYTB and LncCytB was prevented. Consistent with LncCytB-CYTB, inhibition of complex III activity was also protected in Sirt1 overexpressing diabetic mice; the values in Sirt1 and WT diabetic mice were significantly different from each other (p < 0.05) (Fig. 7a–d).
FIG. 7.
Effect of Sirt1 overexpression on LncCytB and LncCytB-CYTB interactions. Retinal microvasculature from Sirt1 overexpressing mice was analyzed for (a) LncCytB at CYTB interaction by ChIRP technique, (b) CYTB mRNA by qRT-PCR using 18S rRNA as a housekeeping gene, and (c) LncCytB transcripts by strand-specific PCR. (d) Complex III activity was quantified spectrophotometrically in retinal mitochondria by measuring reduced cytochrome c. Each measurement was performed in five or more mice per group, and the values are represented as mean ± SD. *p < 0.05 versus WT-N and #p < 0.05 versus WT-D. Sir-N and Sir-D, Sirt1 overexpressing normal and diabetic mice, respectively; Sirt1, sirtuin 1.
Discussion
Mitochondrial damage plays a central role in diabetic complications, including in the complex pathogenesis of diabetic retinopathy (Brownlee, 2005; Kowluru and Mishra, 2015; Nishikawa et al., 2000). Diabetes damages retinal mitochondrial integrity, and the damaged mitochondria accelerate apoptosis of capillary cells, a phenomenon that precedes the development of histopathology characteristic of diabetic retinopathy (Mizutani et al., 1996). Damaged mtDNA results in an impaired transcription of the genes it encodes including CYTB, which is important for the functioning of complex III of the electron transport chain system.
Complex III is one of the major sites of release of free radicals (Bénit et al., 2009), and a dysfunctional complex III continues to produce free radicals, propagating a vicious cycle (Kowluru, 2019; Kowluru, 2005; Kowluru and Mishra, 2015). Our recent work has shown that the expression of mtDNA-encoded LncCytB is also downregulated in diabetes, which increases mtDNA vulnerability (Kumar et al., 2023). Although LncRNAs do not have an open reading frame for translation, they can bind to the DNA or RNA in a sequence-specific manner and alter the gene expression (Long et al., 2017; Simion et al., 2019).
Here, our results demonstrate an important role of LncCytB in the regulation of CYTB transcription; LncCytB and CYTB have a similar temporal relationship with the duration of hyperglycemia, and interactions between them are decreased in hyperglycemic milieu. While LncCytB overexpression ameliorates glucose-induced decrease in CYTB gene transcripts, complex III activity, and mitochondrial respiration, its downregulation further decreases CYTB transcription and worsens mitochondrial respiration. Furthermore, overexpression of Sod2 or Sirt1 prevents decrease in LncCytB-CYTB interactions, and improves mitochondrial respiration/complex III activity in diabetic mice. These results clearly suggest that LncCytB downregulation in hyperglycemic milieu has a major role in CYTB transcription–complex III activity and mitochondrial respiration/homeostasis. LncRNAs regulate gene transcription via many different molecular mechanisms, including affecting the expression of the downstream gene, inducing chromatin remodeling, modulating the processing of other RNAs, or by binding to specific protein partners to regulate their activity (Kowluru, 2022; Rafiee et al., 2018). Our results here show that high glucose decreases interaction between LncCytB and CYTB, which can be ameliorated by LncCytB overexpression. LncCytB regulation affects the transcription of CYTB; overexpression of LncCytB prevents hyperglycemia-induced decrease in CYTB gene transcripts, and LncCytB-siRNA further reduces their transcripts (Figs. 1 and 2), suggesting a significant role of LncCytB in CYTB transcription. In support, antisense RNAs can transcriptionally control the sense messenger RNA via various mechanisms, including pairing with the complementary fragment of mRNA to prevent/inhibit translation, or by controlling gene regulation at pretranscriptional, transcriptional, and post-transcriptional levels (Faghihi and Wahlestedt, 2009; Guttman and Rinn, 2012; Villegas and Zaphiropoulos, 2015), raising the possibility that LncCytB could be regulating CYTB transcription in diabetic retinopathy by one or more of these mechanisms.
Superoxide radicals are primarily produced as byproducts of mitochondrial respiration when electrons leak from the electron transport chain, but in stressful conditions, their production is significantly increased (Wellen and Thompson, 2010). Although both complexes I and III of the electron chain are considered to be involved directly in superoxide production (Bénit et al., 2009; Brand, 2016), in diabetes the majority of mitochondrial superoxide production is associated with complex III (Brownlee, 2005).
Complex III itself is a major multisubunit, membrane-bound enzyme, and depending on the species it contains up to 11 subunits, of which only three are essential for its enzymatic activity (Berry et al., 2004). Among the three essential catalytic subunits, cytochrome B is an integral membrane protein, and is the only protein transcribed by mtDNA (Gil Borlado et al., 2010). Here, we show that in addition to regulation of CYTB gene transcripts, LncCytB overexpression modulates complex III activity and regulates mitochondrial ROS levels (Fig. 3).
Decrease in the mitochondrial respiration including basal, maximal, and spare respiration rates, observed in high glucose environment, is also ameliorated by LncCytB overexpression, but is further worsened by LncCytB-siRNA. Our results also demonstrate that LncCytB-siRNA further reduces glucose-induced decrease in mitochondrial membrane potential (Fig. 4); in support, mitochondrial complex III is implicated in maintaining mitochondrial membrane potential (van Raam et al., 2008).
Similar temporal relationship between duration of diabetes and LncCytB and CYTB expression is also observed in our in vivo model; at the early stages of diabetes there is no change in LncCytB and CYTB, but as the duration of diabetes is extended to 4 months, LncCytB and CYTB levels decrease (Fig. 5). In support, diabetic rodents do not show any retinal mitochondrial dysfunction at the early stages of diabetes, but mitochondria become dysfunctional and mtDNA is damaged with increased duration of diabetes (Kowluru and Abbas, 2003; Madsen-Bouterse et al., 2010; Santos et al., 2013).
Our results also demonstrate that retinal microvessels from diabetic mice have decreased LncCytB and CYTB interactions, further supporting the role of LncCytB in CYTB expression. Superoxide radicals produced by complex III are quickly scavenged by manganese superoxide dismutase, and H2O2 formed is detoxified by the enzymes in the mitochondrial matrix (Blokhina and Fagerstedt, 2010). Here, we also show that diabetic mice overexpressing Sod2 are also protected from reduction in LncCytB-CYTB interactions and CYTB expression, and their retinal oxygen consumption and complex III activity are comparable with nondiabetic mice, further supporting the role of LncCytB in maintaining cytochrome B–complex III activity (Figs. 5 and 6).
Consistent with this, Sod2 overexpressing diabetic mice do not show any downregulation of LncCytB expression. In addition, Sirt1 overexpressing mice, a model that is protected from diabetes-induced mitochondrial damage (Mishra et al., 2018), show similar protection from diabetes-induced decrease in LncCytB-CYTB interactions and complex III activity (Fig. 7). In support, diabetic mice overexpressing Sod2 or Sirt1 are protected from mtDNA damage and the development of retinopathy (Kanwar et al., 2007; Mishra et al., 2018).
Our study was performed in retinal microvascular cells; we recognize that retinal nonvascular cells are also damaged in diabetes, and their role in the pathogenesis of diabetic retinopathy is now well appreciated (Antonetti et al., 2021; Coughlin et al., 2017). The use of isolated retinal endothelial cells in culture, however, has allowed us to relate these results to the results from mouse retinal microvessels, the site of retinal histopathology characteristic of diabetic retinopathy. However, in support of our results from vascular cells, in retinal Müller cells, Sirt1 is shown to regulate glucose-induced glial reaction (Duarte et al., 2016; Duarte et al., 2015). Furthermore, we cannot rule out the possibility that alteration in LncCytB in the photoreceptors, one of the key cell types with increased oxidative stress in diabetes (Du et al., 2013), could also be contributing to the development of diabetic retinopathy.
In summary, LncCytB is closely associated with the transcription of CYTB and maintenance of mitochondrial functional stability in diabetic retinopathy. Due to its downregulation in diabetes, gene transcription of CYTB is decreased, resulting in the inhibition of complex III activity, and the electron transport chain system is compromised (Fig. 8). Thus, preventing downregulation of LncCytB in diabetes, in addition to preventing mtDNA stability (Kumar et al., 2023), is expected to protect electron transport chain function and mitochondrial respiration, which may help inhibit the development/progression of diabetic retinopathy.
FIG. 8.
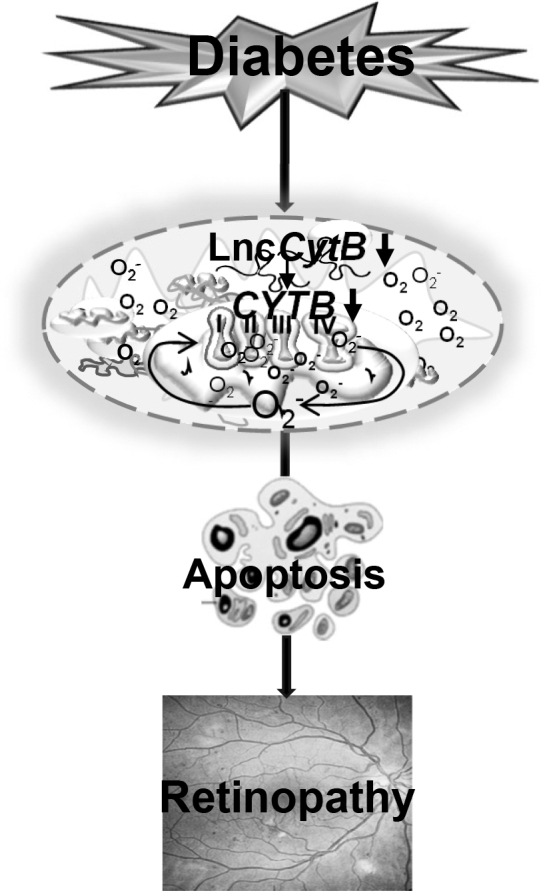
Summary graphic illustration. Downregulation of mtDNA-encoded LncCytB in diabetes decreases the transcription of CYTB, a gene encoded by mtDNA and critical in the functioning of complex III. The compromised electron transport chain results in increased mitochondrial ROS generation and impaired OCR, and this leads to the development of diabetic retinopathy. LncCytB, long noncoding RNA cytochrome B; mtDNA, mitochondrial DNA; OCR, oxygen consumption rate.
Materials and Methods
Retinal endothelial cells
HRECs (Cat. No. ACBRI 181; Cell Systems Corp., Kirkland, WA) were cultured in Dulbecco's modified Eagle's medium (Cat No. D5523; Sigma-Aldrich, St. Louis, MO) supplemented with 12% heat-inactivated fetal bovine serum, 15 μg/mL endothelial cell growth supplement, and 1% each insulin, transferrin, selenium, glutamax, and antibiotic/antimitotic.
Cells from fifth to eighth passage were incubated with 5 mM d-glucose (NG) or 20 mM d-glucose (HG) for 12–96 h to investigate temporal relationship between duration of high glucose insult and LncCytB and CYTB expressions, and for 96 h for rest of the experiments. Each experiment had an osmotic/metabolic control where 20 mM d-glucose was replaced by 20 mM l-glucose (Kumar et al., 2023; Mohammad and Kowluru, 2022; Mohammad and Kowluru, 2021).
Regulation of LncCytB (overexpression or silencing) was performed in cells from passage fifth or sixth using LncCytB constructs in pCMV6-AC vector (Cat No. PS100020; OriGene Technologies, Rockville, MD), or Antisense LNA GapmeR LncCytB-siRNAs (Cat No. ID: 339511; Seq.: 5′-GTCTGCGGCTAGGAGTCAA-3′; Qiagen, Valencia, CA), respectively (Kumar et al., 2023). Each transfection experiment included controls where the cells were transfected with either an empty vector (pCMV6-AC) or scrambled control RNA. LncCytB transcripts were quantified by strand-specific polymerase chain reaction (PCR) to evaluate the transfection efficiency. Each experiment was performed with HRECs from the same batch and was repeated in three to four different cell preparations.
Mice
Mice (20 g BW, C57BL/6J, or overexpressing Sod2 and/or their WT, or overexpressing Sirt1) were made diabetic by injecting streptozotocin (55 mg/kg body weight, i.p.) for four consecutive days (Kanwar et al., 2007; Kumar et al., 2023; Mishra et al., 2018). Three days after the last injection, mice presenting blood glucose >250 mg/dL were considered diabetic. Both male and female had similar severity of hyperglycemia (blood glucose 350–500 mg/dL). At the end of desired duration of diabetes (1, 4, and 6 months for C57BL/6, and 6 months for WT and transgenic), mice were euthanized by carbon dioxide, and their retina was immediately harvested. Age-matched normal, nondiabetic C57BL/6, WT, and transgenic mice were used as their respective controls. Each group and each time point had a total of 10–12 mice, with similar numbers of both males and females. Initial measurements quantifying the expression of LncCytB and CYTB in retinal microvessels from male and female mice showed very comparable results, and thus the data are not presented separately. These procedures conformed to the Association for Research in Vision and Ophthalmology Resolution on the Use of Animals in Research, and are approved by Wayne State University's Animal Care and Use Committee.
Retinal microvessels
Retinal microvessels were prepared by hypotonic shock method by incubating one mouse retina in 5–10 mL of deionized water for 60 min at 37°C in a shaking water bath. The tissue debris was removed under a dissecting microscope, and the retinal microvessels were rinsed in phosphate-buffered saline (PBS) and used for analysis (Duraisamy et al., 2019; Mohammad and Kowluru, 2022).
Gene expression
Gene expression was quantified by SYBR green-based real-time quantitative PCR (qRT-PCR) using β-actin (human) or 18S rRNA (mouse) as a housekeeping gene (Table 1). LncCytB primer sequence (human and mouse) was based on the antisense of CYTB gene, and these primers have been previously used by us and others (Kumar et al., 2023; Rackham et al., 2011).
Table 1.
Primers
| Species | Accession number | Sequence |
|---|---|---|
| Human | ||
| ssLncCytB antisense | NA | 5′-GGTATCTGGACTTCGAAGGCACGAATGACCAACAGGAGGCTAA-3′ |
| ssLncCytB | NA | Forward 5′-CCATAGACCTGAAGCTTCCGT-3′ |
| Reverse 5′-TATTATAAAGCGGGTGATTCG-3′ | ||
| CYTB | ENSG00000198727 | Forward 5′-ATGGTAGATGTGGCGGGTTT-3′ |
| Reverse 5′-TCTCCGATCCGTCCCTAACA-3′ | ||
| β-actin | NM_001101.5 | Forward 5′-AGCCTCGCCTTTGCCGATCCG-3′ |
| Reverse 5′-TCTCTTGCTCTGGGCCTCGTCG-3′ | ||
| Mouse | ||
| ssLncCytB antisense | NA | 5′-GGTATCTGGACTTCGAAGGCAACCCACAAGATGACCAACCG-3′ |
| ssLncCytB | Forward 5′-CCATAGACCTGAAGCTTCCGT-3′ | |
| Reverse 5′-AATCACACAAATTTTGTACTG-3′ | ||
| CYTB | AB819918.1 | Forward 5′-ACCCGCCCCATCCAACATCTCAT-3′ |
| Reverse 5′-TTGAGGCTCCGTTTGCGTGT-3′ | ||
| 18S rRNA | NR_003278.3 | Forward 5′-GCCCTGTAATTGGAATGAGTCCACTT-3′ |
| Reverse 5′-CTCCCCAAGATCCAACTACGAGCTTT-3′ | ||
NA, not available; LncCytB, long noncoding RNA cytochrome B; ssLncCytB, strand-specific LncCytB.
LncCytB expression was measured by strand-specific RT-PCR, using 2 μg RNA mixed with 10 μM each of the forward primers of LncCytB (antisense strand specific) and β-actin/18S rRNA (human/mouse), as described previously (Kumar et al., 2023).
RNA fluorescence in situ hybridization
RNA-FISH was performed using two independent RNA probes, fuorescein-12-dUTP incorporated LncCytB and aminoallyl-dUTP-Texas Red incorporated CYTB. These probes were synthesized by asymmetric PCR and purified using QIAquick gel extraction kit (Cat No. 28704; Qiagen). In brief, HRECs were fixed with paraformaldehyde (4% w/v) and dehydrated with 70%–100% ethanol. After air drying, the cells were incubated at 37°C for 3 h with the denatured probes in the probe hybridization buffer (10% dextran sulfate, 10% formamide, and 4 × saline-sodium citrate buffer, pH 7.0). The cells were then washed with the hybridization buffer, followed by PBS, and were mounted in DAPI containing VECTASHIELD mounting medium (Cat No. H-1000; Vector Laboratories, Burlingame, CA). The images were captured by Zeiss microscope using a 40 × objective and the Apotome module. The fluorescence intensity and Pearson's coefficient were quantified using Zeiss software module (Kumar et al., 2023; Mohammad and Kowluru, 2022; Radhakrishnan and Kowluru, 2021).
Chromatin isolation by RNA purification
ChIRP was performed to determine the binding of LncCytB at CYTB as described previously (Kumar et al., 2023; Radhakrishnan and Kowluru, 2021). Crosslinked samples in 1% formaldehyde were neutralized with 0.13 M glycine, and resuspended in the lysis buffer supplemented with protease and RNase inhibitors. Chromatin extract was prepared by sonication, and was incubated with biotin-labeled LncCytB probe in the hybridization buffer (750 mM NaCl, 50 mM tris HCl pH 7.0, 1 mM ethylenediaminetetraacetic acid, 1% sodium dodecyl sulfate [SDS], and 15% formamide) at 37°C for 3 h; 50 μL chromatin sample was used for input. RNA–chromatin complex was precipitated using streptavidin-agarose beads (Cat. No. PI20347; Thermo Fisher Scientific), and after collecting the beads by centrifugation, they were washed. DNA was isolated from the beads and from the input samples, and analyzed by qRT-PCR. As a negative control, cells without biotin-labeled LncCytB were used. Results were normalized using the input values (Kumar et al., 2023; Radhakrishnan and Kowluru, 2021).
Complex III activity
Mitochondrial complex III activity was assayed in isolated mitochondria (5 μg protein) using a kit (Cat No. MAK360; Sigma-Aldrich), and following the manufacturer's instructions. Absorbance of the reduced cytochrome c was recorded at 550 nm for 10 min. Antimycin A inhibitor and DMSO were used as negative and background controls, respectively (Ismaeel et al., 2022).
Mitochondrial ROS
ROS were quantified fluorometrically by incubating mitochondria (5 μg protein) with 4 μM 2′-7′dichlorofluorescein diacetate (DCFH-DA) in the dark for 30 min, and measuring the resultant fluorescence at 485 nm excitation and 530 nm emission wavelengths. The values are represented as percentage, considering normal glucose as 100%.
Mitochondrial membrane potential
Mitochondrial membrane potential was measured using mitochondrial binding dye tetraethyl benzimidazolyl carbocyanine iodide, JC-I (Cat. No. MP03168; Molecular Probes, Carlsbad, CA). Cells washed with Dulbecco's modified Eagle's medium (DMEM) were incubated with 5 μM JC-1 for 30 min at 37°C, and after removing the excess dye by washing with PBS, they were visualized under a Zeiss microscope using a 20 × objective. Carbonyl cyanide 3-chlorophenylhydrazone was used as a positive control. The fluorescence intensities of J-monomers (green, at 485 nm excitation and 530 nm emission) and J-aggregates (red, at 525 nm excitation and 590 nm emission) were measured using Zeiss software module, and the ratio of red fluorescent J-aggregates to green J-monomers was calculated (Mohammad and Kowluru, 2021).
Mitochondrial OCR by flux analysis
OCR was measured by Seahorse XF analyzer (Agilent Technologies, Santa Clara, CA) using oligomycin (ATP synthase blocker), FCCP (mitochondrial uncoupler), rotenone (inhibitor of complex I), and antimycin A (a blocker of complex III) (Kowluru and Alka, 2023; Numa et al., 2020). In brief, the cells were seeded into a 96-well cell culture plate and incubated with the respective treatment media; for background, the corner wells were left empty. After completion of the experimental treatments, cells were washed two times with 100 μL assay medium (Seahorse XF DMEM medium supplemented with 1 mM pyruvate, 2 mM glutamine, and 10 mM glucose), followed by addition of 180 μL assay medium in each well, and the plate was incubated at 37°C for 30–45 min. OCR was determined using Seahorse XF Cell Mito Stress Test Kit (Cat. No. 103015-100; Agilent Technologies) according to the manufacturer's protocol by injecting 1.5 μM oligomycin, 2.0 μM FCCP, and 0.5 μM rotenone/antimycin A in the ports A, B, and C, respectively. The assay protocol consisted of 3 min mixing, followed by 8 min of wait time, and then measuring for 3 min. This cycle was repeated three times for each measurement point. The data were collected and analyzed using the Wave software (Agilent Technologies).
For retina, freshly isolated mouse retina was transferred into the cell culture dish containing prewarmed (37°C) Hank's balanced salt solution, and retinal punches, removed from the central retina under a dissecting microscope using 1.5 mm biopsy puncher (Integra Miltex, York, PA), were transferred into the wells of the Seahorse XFe96 culture microplate containing Seahorse assay medium. Each punch was adjusted in the center of the well under a dissecting microscope, and the microplate was then incubated for 45–60 min at 37°C before running the assay. Each well had 1 retina punch, and each retina had ∼10 punches/plate. OCR was measured using Seahorse XF Cell Mito Stress Test Kit, as described above (Shetty et al., 2021; Shosha et al., 2022).
Retinal vascular histopathology
Retinal vasculature was prepared by trypsin digestion, stained with periodic acid–Schiff–hematoxylin, and degenerative capillaries were identified by light microscopy (Kanwar et al., 2007; Kowluru et al., 2016; Mishra et al., 2018).
Statistical analysis
Electronic laboratory notebook was not used for data collection, and the results are presented as mean ± standard deviation. Statistical analysis was performed using GraphPad Prism (GraphPad Software, San Diego, CA), and significance of variance was calculated by one-way ANOVA. A p value <0.05 was considered as statistically significant.
Acknowledgments
The authors acknowledge the grant support from the National Institutes of Health (R01-EY014370, R01-EY017313, R01-EY022230, and R01-EY333516) and from The Thomas Foundation to RAK, and an unrestricted grant from Research to Prevent Blindness to the Department of Ophthalmology, Wayne State University.
Abbreviations Used
- AMI
arithmetic mean intensity
- CCCP
carbonyl cyanide 3-chlorophenylhydrazone
- ChIRP
chromatin isolation by RNA purification
- CYTB
cytochrome B
- DCFH-DA
2′-7′dichlorofluorescein diacetate
- DMEM
Dulbecco's modified Eagle's medium
- EV
empty vector
- FCCP
carbonyl cyanide 4-[trifluoromethoxy] phenylhydrazone
- HG
high glucose
- HRECs
human retinal endothelial cells
- JC-I
tetraethyl benzimidazolyl carbocyanine iodide
- LncCytB
long noncoding RNA cytochrome B
- LncRNA
long noncoding RNA
- mtDNA
mitochondrial DNA
- NG
normal glucose
- OCR
oxygen consumption rate
- PBS
phosphate-buffered saline
- RNA-FISH
RNA fluorescence in situ hybridization
- ROS
reactive oxygen species
- qRT-PCR
real-time quantitative polymerase chain reaction
- SC
scrambled control RNA
- SD
standard deviation
- SDS
sodium dodecyl sulfate
- Sir-D
Sirt1 overexpressing diabetic mice
- Sir-N
Sirt1 overexpressing normal mice
- Sirt1
sirtuin 1
- Sod2
gene encoding for manganese superoxide dismutase
- Sod-D
Sod2 overexpressing diabetic mice
- Sod-N
Sod2 overexpressing normal mice
- ssLncCytB
strand-specific LncCytB
- TCA
tricarboxylic acid
- WT-D
wildtype diabetic mice
- WT-N
wildtype normal mice
Authors' Contributions
G.M. and J.K. researched data, data interpretation, and article editing; R.A.K. contributed to experimental plan, data interpretation, literature search, article writing and editing.
Author Disclosure Statement
No competing financial interests exist.
Funding Information
Grant support from the National Institutes of Health (R01-EY014370, R01-EY017313, R01-EY022230, and R01-EY333516) and from The Thomas Foundation to RAK, and an unrestricted grant from Research to Prevent Blindness to the Department of Ophthalmology, Wayne State University.
References
- Antonetti DA, Silva PS, Stitt AW. Current understanding of the molecular and cellular pathology of diabetic retinopathy. Nat Rev Endocrinol 2021;17:195–206. [DOI] [PMC free article] [PubMed] [Google Scholar]
- Bénit P, Lebon S, Rustin P. Respiratory-chain diseases related to complex III deficiency. Biochim Biophys Acta Mol Cell Res 2009;1793:181–185. [DOI] [PubMed] [Google Scholar]
- Berry EA, Huang LS, Saechao LK, et al. . X-ray structure of rhodobacter capsulatus cytochrome bc (1): Comparison with its mitochondrial and chloroplast counterparts. Photosynth Res 2004;81:251–275. [DOI] [PubMed] [Google Scholar]
- Blokhina O, Fagerstedt KV. Reactive oxygen species and nitric oxide in plant mitochondria: origin and redundant regulatory systems. Physiol Plant 2010;138:447–462. [DOI] [PubMed] [Google Scholar]
- Brand MD. Mitochondrial generation of superoxide and hydrogen peroxide as the source of mitochondrial redox signaling. Free Radic Biol Med 2016;100:14–31. [DOI] [PubMed] [Google Scholar]
- Brownlee M. The pathobiology of diabetic complications: A unifying mechanism. Diabetes 2005;54:1615–1625. [DOI] [PubMed] [Google Scholar]
- Cheung N, Mitchell P, Wong TY. Diabetic retinopathy. Lancet 2010;376:124–136. [DOI] [PubMed] [Google Scholar]
- Coughlin BA, Feenstra DJ, Mohr S. Müller cells and diabetic retinopathy. Vision Res 2017;139:93–100. [DOI] [PMC free article] [PubMed] [Google Scholar]
- De Paepe B, Lefever S, Mestdagh P. How long noncoding RNAs enforce their will on mitochondrial activity: Regulation of mitochondrial respiration, reactive oxygen species production, apoptosis, and metabolic reprogramming in cancer. Curr Genet 2018;64:163–172. [DOI] [PubMed] [Google Scholar]
- Du Y, Veenstra A, Palczewski K, et al. . Photoreceptor cells are major contributors to diabetes-induced oxidative stress and local inflammation in the retina. Proc Natl Acad Sci U S A 2013;110:16586–16591. [DOI] [PMC free article] [PubMed] [Google Scholar]
- Duarte DA, Papadimitriou A, Gilbert RE, et al. . Conditioned medium from early-outgrowth bone marrow cells is retinal protective in experimental model of diabetes. PLoS One 2016;11:e0147978. [DOI] [PMC free article] [PubMed] [Google Scholar]
- Duarte DA, Rosales MA, Papadimitriou A, et al. . Polyphenol-enriched cocoa protects the diabetic retina from glial reaction through the sirtuin pathway. J Nutr Biochem 2015;26:64–74. [DOI] [PubMed] [Google Scholar]
- Duraisamy AJ, Mohammad G, Kowluru RA. Mitochondrial fusion and maintenance of mitochondrial homeostasis in diabetic retinopathy. Biochim Biophys Acta Mol Basis Dis 2019;1865:1617–1626. [DOI] [PubMed] [Google Scholar]
- Faghihi MA, Wahlestedt C. Regulatory roles of natural antisense transcripts. Nat Rev Mol Cell Biol 2009;10:637–643. [DOI] [PMC free article] [PubMed] [Google Scholar]
- Gil Borlado MC, Moreno Lastres D, Gonzalez Hoyuela M, et al. . Impact of the mitochondrial genetic background in complex III deficiency. PLoS One 2010;5:e12801. [DOI] [PMC free article] [PubMed] [Google Scholar]
- Guttman M, Rinn JL. Modular regulatory principles of large non-coding RNAs. Nature 2012;482:339–346. [DOI] [PMC free article] [PubMed] [Google Scholar]
- Ismaeel A, Laudato JA, Fletcher E, et al. . High-fat diet augments the effect of alcohol on skeletal muscle mitochondrial dysfunction in mice. Nutrients 2022;14:1016. [DOI] [PMC free article] [PubMed] [Google Scholar]
- Kanwar M, Chan PS, Kern TS, et al. . Oxidative damage in the retinal mitochondria of diabetic mice: Possible protection by superoxide dismutase. Invest Ophthalmol Vis Sci 2007;48:3805–3811. [DOI] [PubMed] [Google Scholar]
- Kopp F, Mendell JT. Functional classification and experimental dissection of long noncoding RNAs. Cell 2018;172:393–407. [DOI] [PMC free article] [PubMed] [Google Scholar]
- Kowluru RA. Diabetic retinopathy: Mitochondrial dysfunction and retinal capillary cell death. Antioxid Redox Signal 2005;7:1581–1587. [DOI] [PubMed] [Google Scholar]
- Kowluru RA. Mitochondrial stability in diabetic retinopathy: Lessons learned from epigenetics. Diabetes 2019;68:241–247. [DOI] [PMC free article] [PubMed] [Google Scholar]
- Kowluru RA. Long noncoding RNAs and mitochondrial homeostasis in the development of diabetic retinopathy. Front Endocrinol 2022;13:915031. [DOI] [PMC free article] [PubMed] [Google Scholar]
- Kowluru RA, Abbas SN. Diabetes-induced mitochondrial dysfunction in the retina. Invest Ophthalmol Vis Sci 2003;44:5327–5334. [DOI] [PubMed] [Google Scholar]
- Kowluru RA, Alka K. Mitochondrial quality control and metabolic memory phenomenon associated with continued progression of diabetic retinopathy’. Int J Mol Sci 2023;24:8076. [DOI] [PMC free article] [PubMed] [Google Scholar]
- Kowluru RA, Kowluru A, Mishra M, et al. . Oxidative stress and epigenetic modifications in the pathogenesis of diabetic retinopathy. Prog Retin Eye Res 2015;48:40–61. [DOI] [PMC free article] [PubMed] [Google Scholar]
- Kowluru RA, Mishra M. Oxidative stress, mitochondrial damage and diabetic retinopathy. Biochim Biophys Acta 2015;1852:2474–2483. [DOI] [PubMed] [Google Scholar]
- Kowluru RA, Mishra M, Kowluru A, et al. . Hyperlipidemia and the development of diabetic retinopathy: Comparison between type 1 and type 2 animal models. Metabolism 2016;65:1570–1581. [DOI] [PMC free article] [PubMed] [Google Scholar]
- Kumar J, Mohammad G, Alka K, et al. . Mitochondrial genome-encoded long noncoding RNA and mitochondrial stability in diabetic retinopathy. Diabetes 2023;72:520–531. [DOI] [PMC free article] [PubMed] [Google Scholar]
- Kvist L, Martens J, Nazarenko AA, et al. . Paternal leakage of mitochondrial DNA in the great tit (Parus major). Mol Biol Evol 2003;20:243–247. [DOI] [PubMed] [Google Scholar]
- Long Y, Wang X, Youmans DT, et al. . How do lncRNAs regulate transcription? Sci Adv 2017;3:eaao2110. [DOI] [PMC free article] [PubMed] [Google Scholar]
- Madsen-Bouterse SA, Mohammad G, Kanwar M, et al. . Role of mitochondrial DNA damage in the development of diabetic retinopathy, and the metabolic memory phenomenon associated with its progression. Antioxid Redox Signal 2010;13:797–805. [DOI] [PMC free article] [PubMed] [Google Scholar]
- Mishra M, Duraisamy AJ, Kowluru RA. Sirt1—A guardian of the development of diabetic retinopathy. Diabetes 2018;67:745–754. [DOI] [PMC free article] [PubMed] [Google Scholar]
- Mizutani M, Kern TS, Lorenzi M. Accelerated death of retinal microvascular cells in human and experimental diabetic retinopathy. J Clin Invest 1996;97:2883–2890. [DOI] [PMC free article] [PubMed] [Google Scholar]
- Mohammad G, Kowluru RA. Nuclear genome-encoded long noncoding RNAs and mitochondrial damage in diabetic retinopathy. Cells 2021;10:3271. [DOI] [PMC free article] [PubMed] [Google Scholar]
- Mohammad G, Kowluru RA. Mitochondrial dynamics in the metabolic memory of diabetic retinopathy. J Diab Res 2022;2022:3555889. [DOI] [PMC free article] [PubMed] [Google Scholar]
- Musatov A, Robinson NC. Susceptibility of mitochondrial electron-transport complexes to oxidative damage. Focus on cytochrome c oxidase. Free Radic Res 2012;46:1313–1326. [DOI] [PubMed] [Google Scholar]
- Nemoto S, Fergusson MM, Finkel T. SIRT1 functionally interacts with the metabolic regulator and transcriptional coactivator PGC-1{alpha}. J Biol Chem 2005;280:16456–16460. [DOI] [PubMed] [Google Scholar]
- Nishikawa T, Edelstein D, Du XL, et al. . Normalizing mitochondrial superoxide production blocks three pathways of hyperglycaemic damage. Nature 2000;404:787–790. [DOI] [PubMed] [Google Scholar]
- Numa K, Ueno M, Fujita T, et al. . Mitochondria as a platform for dictating the cell fate of cultured human corneal endothelial cells. Invest Ophthalmol Vis Sci 2020;61:10. [DOI] [PMC free article] [PubMed] [Google Scholar]
- Olivares AM, Althoff K, Chen GF, et al. . Animal models of diabetic retinopathy. Curr Diab Rep 2017;17:93. [DOI] [PMC free article] [PubMed] [Google Scholar]
- Rackham O, Shearwood AMJ, Mercer TR, et al. . Long noncoding RNAs are generated from the mitochondrial genome and regulated by nuclear-encoded proteins. RNA 2011;17:2085–2093. [DOI] [PMC free article] [PubMed] [Google Scholar]
- Radhakrishnan R, Kowluru RA. Long noncoding RNA MALAT1 and regulation of the antioxidant defense system in diabetic retinopathy. Diabetes 2021;70:227–239. [DOI] [PMC free article] [PubMed] [Google Scholar]
- Rafiee A, Riazi-Rad F, Havaskary M, et al. . Long noncoding RNAs: Regulation, function and cancer. Biotechnol Genet Eng Rev 2018;34:153–180. [DOI] [PubMed] [Google Scholar]
- Santos JM, Tewari S, Lin JY, et al. . Interrelationship between activation of matrix metalloproteinases and mitochondrial dysfunction in the development of diabetic retinopathy. Biochem Biophys Res Commun 2013;438:760–764. [DOI] [PMC free article] [PubMed] [Google Scholar]
- Shetty T, Park B, Corson TW. Measurement of mitochondrial respiration in the murine retina using a Seahorse extracellular flux analyzer. STAR Protoc 2021;2:100533. [DOI] [PMC free article] [PubMed] [Google Scholar]
- Shosha E, Qin L, Lemtalsi T, et al. . Investigation of retinal metabolic function in type 1 diabetic Akita mice. Front Cardiovasc Med 2022;9:900640. [DOI] [PMC free article] [PubMed] [Google Scholar]
- Simion V, Haemmig S, Feinberg MW. LncRNAs in vascular biology and disease. Vasc Pharmacol 2019;114:145–156. [DOI] [PMC free article] [PubMed] [Google Scholar]
- Turrens JF. Mitochondrial formation of reactive oxygen species. J Physiol 2003;552:335–344. [DOI] [PMC free article] [PubMed] [Google Scholar]
- van Raam BJ, Sluiter W, de Wit E, et al. . Mitochondrial membrane potential in human neutrophils is maintained by complex III activity in the absence of supercomplex organisation. PLoS One 2008;3:e2013. [DOI] [PMC free article] [PubMed] [Google Scholar]
- Villegas VE, Zaphiropoulos PG. Neighboring gene regulation by antisense long non-coding RNAs. Int J Mol Sci 2015;16:3251–3266. [DOI] [PMC free article] [PubMed] [Google Scholar]
- Wellen KE, Thompson CB. Cellular metabolic stress: considering how cells respond to nutrient excess. Mol Cell 2010;40:323–332. [DOI] [PMC free article] [PubMed] [Google Scholar]


