Abstract
Women with germline BRCA1 mutations (BRCA1+/mut) have increased risk for hereditary breast cancer. Cancer initiation in BRCA1+/mut is associated with premalignant changes in breast epithelium; however, the role of the epithelium-associated stromal niche during BRCA1-driven tumor initiation remains unclear. Here we show that the premalignant stromal niche promotes epithelial proliferation and mutant BRCA1-driven tumorigenesis in trans. Using single-cell RNA sequencing analysis of human preneoplastic BRCA1+/mut and noncarrier breast tissues, we show distinct changes in epithelial homeostasis including increased proliferation and expansion of basal-luminal intermediate progenitor cells. Additionally, BRCA1+/mut stromal cells show increased expression of pro-proliferative paracrine signals. In particular, we identify pre-cancer-associated fibroblasts (pre-CAFs) that produce protumorigenic factors including matrix metalloproteinase 3 (MMP3), which promotes BRCA1-driven tumorigenesis in vivo. Together, our findings demonstrate that precancerous stroma in BRCA1+/mut may elevate breast cancer risk through the promotion of epithelial proliferation and an accumulation of luminal progenitor cells with altered differentiation.
The breast epithelium consists of a bilayer of outer basal and inner luminal cells forming a complex network of lobular units and ducts that ultimately connect to the nipple of the breast. Through the lens of single-cell RNA sequencing (scRNA-seq), three distinct epithelial cell types can be defined, one basal and two luminal cell types called secretory (here referred to as luminal 1) and hormone-responsive (luminal 2)1–4. Breast cancer arises within the epithelial system due to a cascade of protumorigenic genetic mutations, a process that can be accelerated through the inheritance of certain high-risk germline mutations such as in the DNA repair gene BRCA1 (refs. 5,6). Cancer initiation in BRCA1 mutation carriers (BRCA1+/mut) is associated with premalignant changes in the breast epithelium including altered differentiation7–9, proliferative stress10 and genomic instability11. Previous studies have implicated luminal progenitors (that is, luminal 1) as the cell-of-origin of cancer in BRCA1+/mut breast cancers 7,8,12–14. The vast majority of previous studies focused on the role of BRCA1 mutations in epithelial cells, which substantially expanded our understanding of changes in epithelial cell biology during BRCA1+/mut-associated cancer initiation. However, it remains elusive whether BRCA1 germline mutations can lead to changes within stromal cells surrounding the epithelium, and whether stromal cells may contribute to increased breast cancer risk by driving premalignant changes in epithelial cells via paracrine interactions.
The breast epithelium is embedded in a complex microenvironment consisting of fibroblasts, endothelium, pericytes and numerous immune cell populations, which may produce secreted regulators of tissue homeostasis and epithelial stem and progenitor cell function15. In particular, fibroblasts are critical and abundant niche cells that regulate normal breast epithelial homeostasis through the secretion of growth factors and extracellular matrix (ECM) molecules16 and contribute to tumor progression as cancer-associated fibroblasts (CAFs)17. Here we hypothesized that germline BRCA1+/mut carriers exhibit alterations in the breast stromal niche, which promotes premalignant epithelial changes and cancer initiation in a paracrine fashion. To address this, we used scRNA-seq to generate a transcriptomics atlas of cell types and states from a cohort of primary human breast tissue samples derived from BRCA1+/mut carriers and noncarriers (controls). To functionally study the interaction of stromal and epithelial cells in the human system, we established an in vitro coculture system using primary human epithelial and stromal cells that allow for lentiviral modulation of candidate factors, and we used an in vivo cotransplantation model for mutant BRCA1-driven breast cancer to determine the cancer-promoting activity of candidate stromal factors.
Results
To define the heterogeneous stromal cell types and their communication with epithelium in the premalignant human breast, we analyzed a cohort of nontumorigenic breast tissues from BRCA1 germline variant carriers (BRCA1+/mut; n = 20) and noncarriers (n = 33) using a combination of scRNA-seq, in situ analysis and functional in vitro and in vivo experiments. For scRNA-seq (BRCA1+/mut: n = 11; noncarrier: n = 11), we used differential centrifugation to enrich for breast epithelium18 following tissue dissociation, then isolated epithelial (Lin−/EpCAM+) and stromal (Lin−/EpCAM−) cells by fluorescence-activated cell sorting (FACS) and sequenced altogether 230,100 cells (Fig. 1a, Extended Data Fig. 1a and Supplementary Table 1). We used Seurat19 to identify the main cell types and their marker genes in a combined analysis of all samples (Fig. 1b,c and Supplementary Tables 2 and 3). Notably, cell type clusters contained cells from all individuals, and all samples demonstrated comparable quality metrics (Extended Data Fig. 1b–d) and showed expected variation in cell type composition (Extended Data Fig. 1e). Within epithelium, we identified three cell types corresponding to basal (63,002 cells), luminal 1 (26,122 cells) and luminal 2 epithelial cells (28,045 cells), as previously described in ref.1. Within the epithelium-associated stroma, we found three main cell types corresponding to fibroblasts (55,428 cells), endothelial cells (31,819 cells) and pericytes20 (22,917 cells) (Fig. 1b).
Fig. 1 |. Single-cell transcriptomics analysis of human breast tissues from BRCA1+/mut and noncarriers.
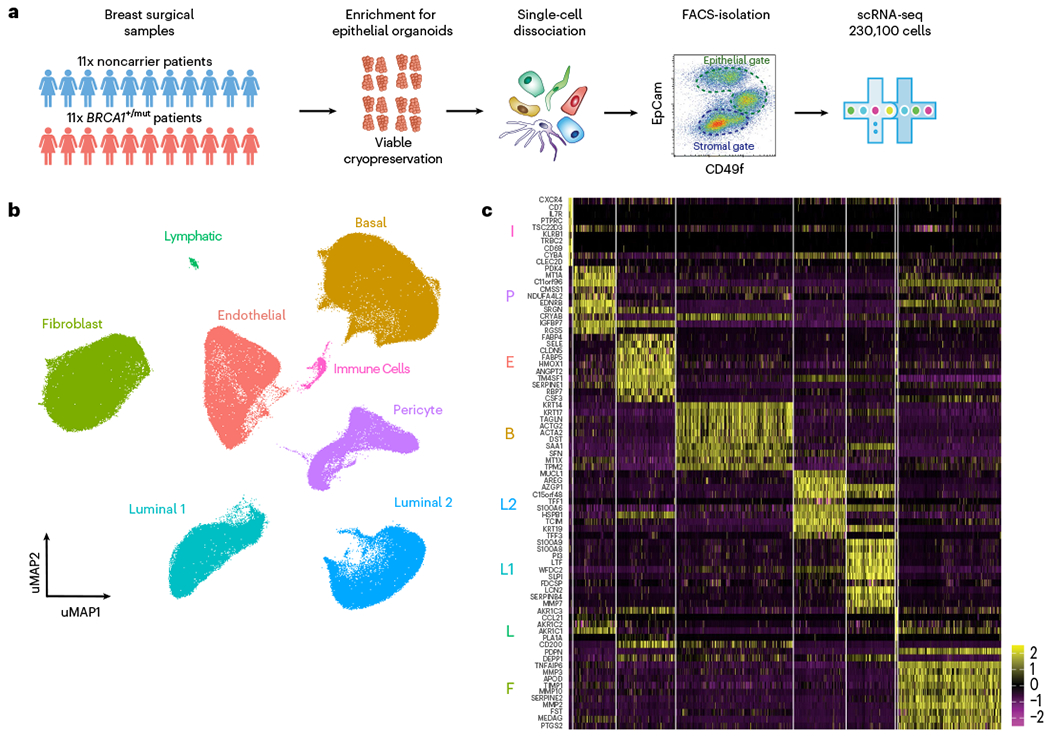
a, Schematic depiction of single-cell analysis workflow using human breast tissue samples that are mechanically and enzymatically dissociated into single-cell suspensions that are subjected to FACS to isolate stromal (EpCAM−) and epithelial (EpCAM+) cells for scRNA-seq analysis. b, Integrated clustering analysis of n = 11 noncarrier and n = 11 BRCA1+/mut scRNA-seq dataset in UMAP projection showing the main identified cell types. c, Top ten marker gene heatmap for each cell type identified by scRNA-seq analysis (rows = genes, columns = cells). The corresponding cell types are indicated with letter abbreviations as follows: basal epithelial cells (B), luminal 1 (L1) and luminal 2 (L2) epithelial cells, fibroblasts (F), pericytes (P), endothelial cells (E), lymphatic cells (L) and immune cells (I).
Because fibroblasts and pericytes have been historically difficult to distinguish21–23, we next defined molecular differences and commonalities between these breast stromal cell types through differential marker gene expression and gene ontology (GO) term analysis (Extended Data Fig. 2a–e). Among the commonalities were genes associated with mesenchymal biology including EDNRB, PDGFRB, ZEB2 and COL4A1 (ref. 24). Key differences were observed in genes encoding ECM molecules (COL1A2) and proteolytic remodelers (MMP2, MMP3, MMP10) in fibroblasts, and actin-binding (TAGLN, ACTA2) and factors related to vascular accessory function (PROCR, ESAM, MCAM, KCNE4) in pericytes (Extended Data Fig. 2b). Notably, we found that the cell surface markers PROCR and PDPN differentially labeled pericytes and fibroblasts (Extended Data Fig. 2f), thus allowing us to develop a FACS strategy to specifically enrich for pericytes (PROCR+ PDPN−) and fibroblasts (PDPN+ PROCRmid) (Extended Data Fig. 2g–i). Our approach for selective isolation of fibroblasts and pericytes from human tissues allows for prospective functional analyses and may help improve therapeutic approaches utilizing the regenerative capacity of pericytes21.
Previous studies have implicated luminal progenitors (that is, luminal 1) as the cell-of-origin of cancer in BRCA1+/mut-associated breast cancer7,8,12–14. To define premalignant aberrations within the epithelium of premalignant BRCA1+/mut tissues, we next performed subset epithelial cell clustering and classified all epithelial cells on the cell state level as previously described in ref. 1 and determined the differentially expressed genes between noncarriers and BRCA1+/mut within each epithelial cell type (Fig. 2a, Extended Data Fig. 3a and Supplementary Tables 4–7). To assess progenitor capacity, we used a statistical approach that quantifies increased cell state transition probabilities as single-cell energy (scEnergy)25. This analysis showed that BRCA1+/mut basal, luminal 1 and luminal 2 epithelial cells displayed substantially higher scEnergy than their noncarrier counterparts (Fig. 2b,c). In line with this notion, we also found indicators of altered epithelial differentiation, including enhanced transcription of genes encoding hallmark luminal cytokeratins such as KRT18, KRT8 and KRT19 in BRCA1+/mut basal epithelial cells (Extended Data Fig. 3b). To validate this, we performed single-cell western blot (scWB) analysis for dual expression of luminal (KRT19) and basal (KRT14) markers in isolated basal cells, which revealed an increased percentage of KRT19/KRT14-double positive basal cells in BRCA1+/mut (Extended Data Fig. 3c–e).
Fig. 2 |. Increased proliferation and accumulation of a luminal epithelial progenitor subset with altered differentiation in BRCA1+/mut breast tissues.
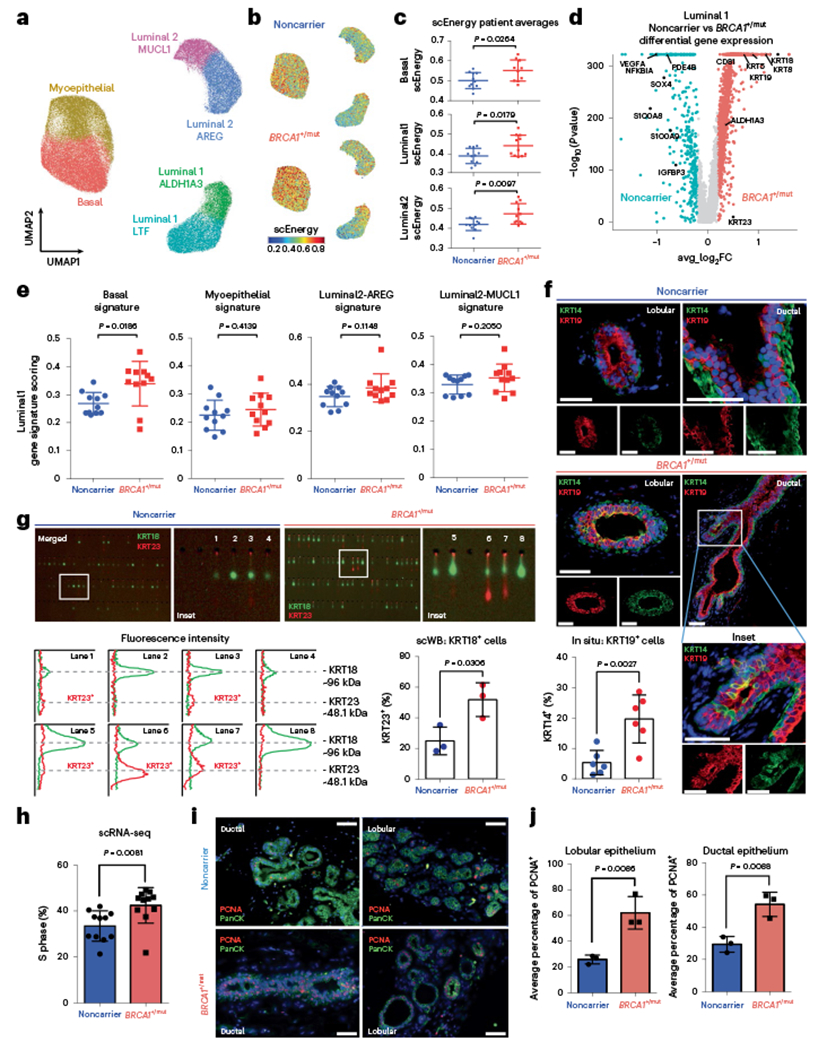
a, Unbiased clustering using UMAP projection of all patient epithelial cells. Cells are labeled by mammary epithelial cell state classification as indicated. b, UMAP feature plots displaying single-cell energy (scEnergy) in faceted plots for noncarrier (upper plot) and BRCA1+/mut cells (lower plot). c, scEnergy distributions are plotted as mean scEnergy values from an individual patient (expressed as mean ± s.e.m.) across basal (noncarrier basal = 0.5009 ± 0.01214, BRCA1+/mut basal = 0.5513 ± 0.01677), luminal 1 (noncarrier luminal 1 = 0.3910 ± 0.01150, BRCA1+/mut luminal 1 = 0.4420 ± 0.01590) and luminal 2 (noncarrier luminal 2 = 0.4150 ± 0.009314, BRCA1+/mut luminal 2 = 0.723 ± 0.01549) cell types from noncarrier and BRCA1+/mut samples. P values were determined by Welch’s two-sample t-test. d, Volcano plot displaying genes differentially expressed between noncarrier and BRCA1+/mut luminal 1 epithelial cells; genes greater than log2FC > 0.25 are colored. The Wilcoxon rank sum test (two sided) is used to determine differentially expressed genes; adjusted P values are determined using the Bonferroni method for multiple testing correction. e, Gene signature scoring of luminal 1 cells from noncarrier and BRCA1+/mut epithelial cells plotted as mean signature score values from individual patients (expressed as mean ± s.e.m.) for basal (noncarrier luminal 1 = 0.2685 ± 0.01195, BRCA1+/mut luminal 1 = 0.3396 ± 0.02406), myoepithelial (noncarrier luminal 1 = 0.2250 ± 0.01616, BRCA1+/mut luminal 1 = 0.3396 ± 0.02406), luminal 2-AREG (noncarrier luminal 1 = 0.3481 ± 0.01287, BRCA1+/mut luminal 1 = 0.3848 ± 0.01801) and luminal 2-MUCL1 (noncarrier luminal 1 = 0.3299 ± 0.01016, BRCA1+/mut luminal 1 = 0.3535 ± 0.01473) marker gene signatures. P values were determined by Welch’s two-sample t-test. f, In situ IF analysis of KRT14/KRT19-double positive cells of lobular and ductal regions in noncarrier and BRCA1+/mut tissues with representative images shown. Scale bar = 50 μm. Bar chart (bottom left) indicates the percentage of KRT14/KRT19-double positive cells in noncarrier (n = 6) and BRCA1+/mut (n = 6). Values are expressed as mean ± s.d. quantified from at least five random fields per patient sample. P value was determined using an unpaired two-tailed t-test. g, Single-cell Western blot (ScWB)-based quantification of KRT23-positive luminal epithelial cells isolated by FACS from noncarrier (n = 3) and BRCA1+/mut (n = 3). Images are representative regions of scWB chips post electrophoresis and antibody probing. Bar chart values are represented as mean ± s.d. from at least 1,000 cells per individual; n = 3 noncarrier, and n = 3 BRCA1+/mut. P value was determined using an unpaired two-tailed t-test. h, Bar chart shows the percentage (expressed as mean ± s.e.m.) of each patient’s noncarrier (0.3346 ± 0.01990, n = 11) and BRCA1+/mut (0.4245 ± 0.2323, n = 11) epithelial cells in S phase as identified by Seurat cell-cycle scoring analysis. P value was calculated by an unpaired two-tailed t-test. i, Representative images from IF analysis of pan-cytokeratin (PanCK, green) and PCNA (red) expression in ductal and lobular regions of noncarrier and BRCA1+/mut breast tissues. Scale bar = 50 μm. j, Bar graphs showing the average percentage (expressed as mean ± s.e.m.) of PCNA + cells in five regions each from noncarrier (n = 3) and BRCA1+/mut (n = 3) patients by in situ IF analysis of lobular (noncarrier = 25.89 ± 1.957, BRCA1+/mut = 62.11 ± 7.286) and ductal (noncarrier = 29.40 ± 2.812, BRCA1+/mut = 54.23 ± 4.366) areas. P values were determined by unpaired two-tailed t-test.
Because luminal progenitors (that is, luminal 1) are particularly involved in BRCA1+/mut-associated breast cancer7,8,12–14, we next performed detailed differential gene expression analyses within luminal 1 cells, which similarly revealed indicators of altered differentiation such that basal hallmark genes (for example, KRT5, KRT14) and luminal progenitor genes (for example, ALDH1A3) were upregulated in BRCA1+/mut luminal 1 cells (Fig. 2d). Furthermore, luminal 1 cells exhibited increased gene scores for basal, but not other epithelial cell type-associated gene signatures (Fig. 2e and Supplementary Table 3). This observation was corroborated using in situ immunofluorescence (IF), as the percentage of KRT14/KRT19-double positive luminal cells was substantially increased in BRCA1+/mut tissues (Fig. 2f, Extended Data Fig. 4a,b and Supplementary Table 8) in line with recent work14. The same subset of luminal 1-ALDH1A3-positive cells was also found to express mRNA high levels of KRT23 (Fig. 2d). To validate this finding on protein level, we performed scWB analysis of primary epithelial cells isolated from noncarrier (n = 3) and BRCA1+/mut tissues (n = 3), showing that BRCA1+/mut patients have a greater percentage of KRT23-positive luminal cells (Fig. 2g). This was further corroborated by in situ IF, showing increased numbers of KRT23-positive luminal cells in BRCA1+/mut (Extended Data Fig. 5a,b and Supplementary Table 9). We next performed cell-cycle scoring analysis26 of epithelial cells in scRNA-seq data, which revealed an increased percentage of BRCA1+/mut epithelial cells in S phase (Fig. 2h). To validate this finding in situ, we performed IF staining for PCNA in additional noncarrier (n = 3) and BRCA1+/mut (n = 3) samples, which confirmed an increased number of proliferating epithelial cells (Fig. 2i,j). Taken together, these findings demonstrate that the premalignant epithelium in BRCA1+/mut displays increased proliferation and an expansion of luminal progenitors with altered differentiation characterized by a basal-luminal intermediate phenotype.
Because stromal cells have key roles in regulating epithelial progenitor cell function through paracrine and juxtacrine interactions16, we next explored ligand–receptor interactions that displayed enhanced expression patterns in BRCA1+/mut compared to noncarrier samples (Supplementary Table 10). Based on the expression of genes encoding ligands and receptors, respectively, pericytes and fibroblasts in noncarriers were predicted to engage in a number of collagen–integrin interactions with epithelium, which were underrepresented in BRCA1+/mut (Fig. 3a,b and Extended Data Fig. 6a,b). Intriguingly, we found several genes encoding tumor-promoting and proliferation-inducing growth factors enriched in BRCA1+/mut, including FGF2 (ref. 27) and HGF28 from fibroblasts, and NGF29 and INHBA30 from pericytes (Fig. 3a). Indeed, GO term analysis showed that BRCA1+/mut samples exhibit an overall increase in pro-proliferative cues from both pericytes and fibroblasts, while endothelial cells exhibited increases in inducing mitogen-activated protein kinase signaling (Fig. 3b), suggesting that alterations in the stromal niche drive the observed epithelial proliferation in premalignant breast tissues.
Fig. 3 |. Receptor–ligand interaction analysis reveals increased stromal cell-induced epithelial proliferation in BRCA1+/mut breast tissue.
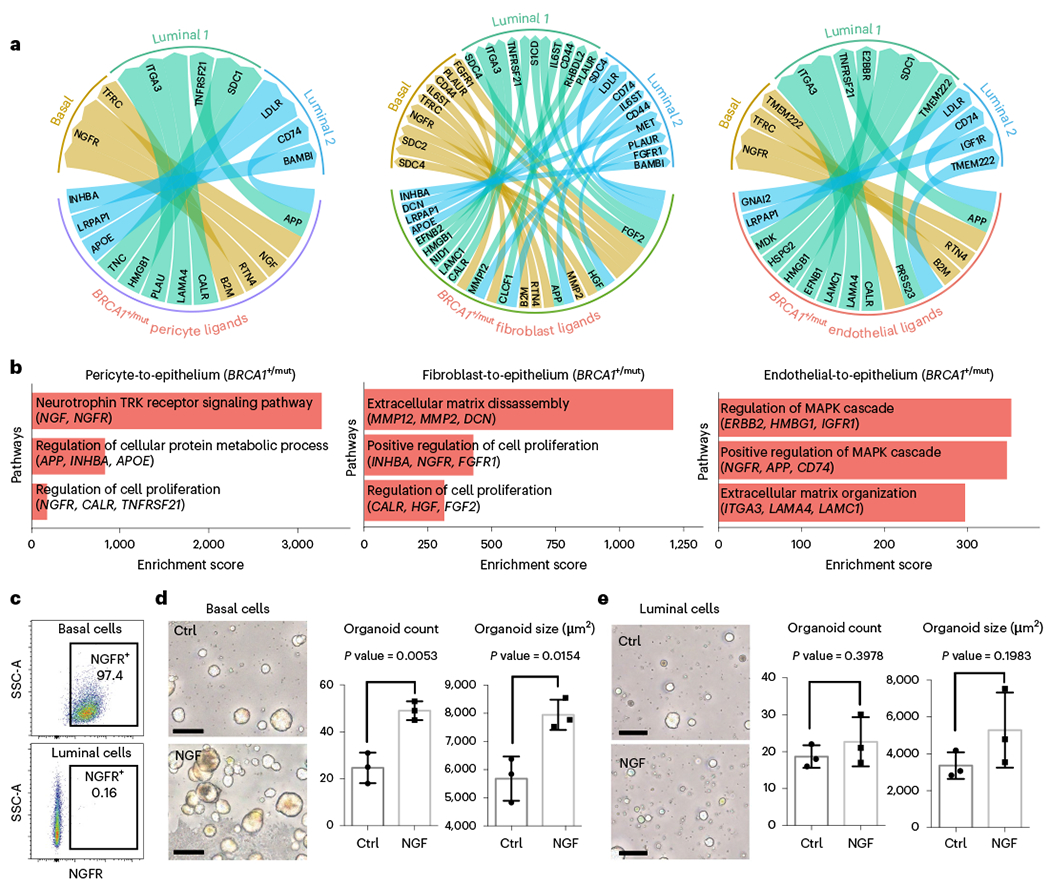
a, Circos plots showing ligand–receptor interactions enhanced in BRCA1+/mut tissues with ligands expressed by pericytes (left), fibroblasts (center) and endothelial cells (right) and receptors expressed by the three epithelial cell types basal, luminal 1 and luminal 2. b, Enrichment scores of GO terms (GO-Biological Processes 2018) of BRCA1+/mut pericyte (left), fibroblast (center) and endothelial (right) ligands and epithelial receptors are shown. c, Representative FACS plots showing gating for NGFR+ basal (top: gated on EpCAM+, CD49f-high) and luminal cells (bottom: gated on EpCAM-high, CD49f−). d, Mammosphere assay using FACS-isolated primary human NGFR+ basal epithelial cells grown in the presence of recombinant NGF (100 ng ml−1) compared to untreated Ctrl. Representative images are shown on the left, and bar charts showing the number (left) and size (right) of mammospheres in each condition. Data are presented as the mean ± s.d.; each point represents one matrigel mammosphere culture (n = 3 Ctrl, n = 3 NGF). P values were determined by unpaired two-tailed t-tests. Scale bars = 50 μm. e, Mammosphere assay using FACS-isolated primary human luminal epithelial cells grown in the presence of recombinant NGF (100 ng ml−1) compared to untreated Ctrl. Representative images are shown on the left, and bar charts showing the number (left) and size (right) of mammospheres in each condition. Data are presented as the mean ± s.d.; each point represents one matrigel mammosphere culture (n = 3 Ctrl, n = 3 NGF). P values were determined by unpaired two-tailed t-tests. Scale bars = 50 μm. Ctrl, control cells.
Our ligand–receptor analysis revealed nerve growth factor (NGF) as a pro-proliferative factor enriched in BRCA1+/mut pericytes interacting with NGF receptor (NGFR) on basal cells (Fig. 3a). We performed a more detailed analysis of vascular cell states (endothelial cells and pericytes; Extended Data Fig. 7a,b), which confirmed that NGF was expressed at higher levels in BRCA1+/mut pericytes (Extended Data Fig. 7c and Supplementary Table 11). NGF is known to induce proliferation in cancer cells29 ; however, NGF has not been known to act as a microenvironmental growth factor in the precancerous breast. With our ligand–receptor analysis, we predicted that NGF has a pro-proliferative effect on basal cells, which was supported by flow cytometric analysis showing that only basal cells, but not luminal cells, express NGFR (Fig. 3c). To functionally test NGF–NGFR interaction, we investigated whether FACS-isolated NGFR-positive basal cells display increased proliferation when stimulated with exogenous NGF in mammosphere formation assays31. Indeed, the addition of NGF induced substantially increased number and size of mammospheres of basal, but not luminal cells (Fig. 3d,e), and enhanced mammary branching morphogenesis32 in a physiologically relevant ECM hydrogel assay33 (Extended Data Fig. 7d–f). Together, these findings reveal the NGF–NGFR pathway as a molecular mechanism involved in the microenvironmental induction of epithelial proliferation in preneoplastic BRCA1+/mut breast tissues.
Fibroblasts are critical and abundant niche cells that regulate normal breast epithelial homeostasis through secretion of growth factors and ECM molecules16 and contribute to tumor progression as CAFs17. Our subset analysis of fibroblast cell density showed striking changes between noncarrier and BRCA1+/mut tissues (Fig. 4a), indicating shifts of fibroblasts in transcriptional space. We next performed differential gene expression analysis, which revealed substantially altered gene expression signatures between BRCA1+/mut and noncarrier fibroblasts (Fig. 4b and Supplementary Table 12). Interestingly, gene scoring analysis showed elevated expression of CAF34 and inflammatory CAF35 signature genes (Fig. 4c) in BRCA1+/mut fibroblasts, suggesting that BRCA1+/mut fibroblasts acquire a CAF phenotype already at the premalignant stage (‘pre-CAF’ phenotype). This pre-CAF signature, as defined by the top 100 BRCA1+/mut fibroblast differentially expressed genes, correlated with poor survival in Her2+ and ER+/PR+ breast cancers, while in contrast, the gene signature from noncarrier fibroblasts correlated with improved survival in ER+/PR+ breast cancers (Extended Data Fig. 8b). Gene scoring analysis on a by-sample basis showed that the pre-CAF phenotype is consistent with this and substantially elevated in the BRCA1+/mat cohort compared to noncarriers (Fig. 4d) and is unaffected by parity status (Extended Data Fig. 8a). Future studies are needed to dissect the association of specific germline BRCA1 mutations with cell state changes in fibroblasts and other stromal cells in more detail.
Fig. 4 |. Expansion of CAF-like, MMP3-expressing fibroblasts in premalignant BRCA1+/mut breast tissues.
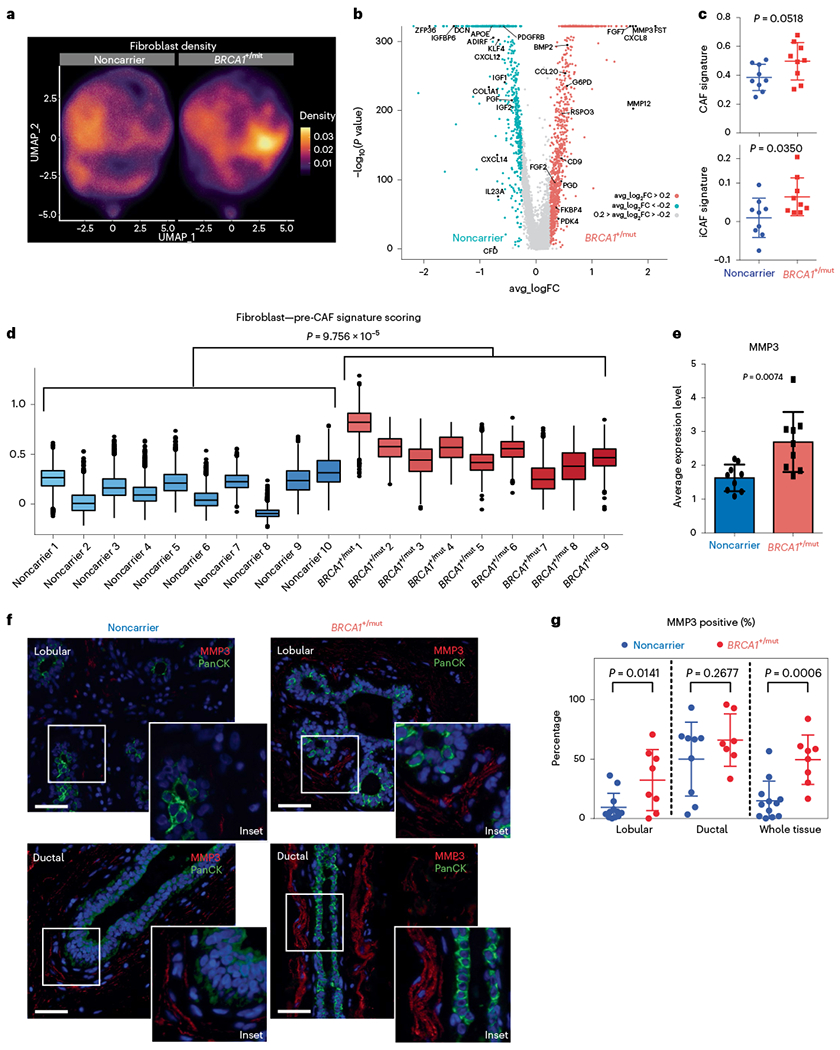
a, UMAP projection of cell density in noncarrier and BRCA1+/mut fibroblasts. b, Volcano plot with all differentially expressed genes between noncarrier and BRCA1+/mut fibroblasts. The Wilcoxon rank sum test is used to determine differentially expressed genes. Adjusted P values are determined using the Bonferroni method for multiple testing correction. Top 50 BRCA1+/mut genes were used to define pre-CAF signature. Top 50 noncarrier genes were used to define noncarrier fibroblast signature. c, Gene signature scoring of all noncarrier (n = 9 patients) and BRCA1+/mut (n = 9 patients) fibroblasts CAF and iCAF signatures. Each point represents the average score from one patient’s fibroblasts. Data are presented as the mean ± s.d. P values were determined by Welch’s two-sample t-tests. Patient scRNA-seq libraries with less than ~250 fibroblasts (<10% of mean number of fibroblasts) were excluded. d, Pre-CAF gene signature scoring in fibroblasts from individual patients. Patient scRNA-seq libraries with less than ~250 fibroblasts (<10% of mean number of fibroblasts) were excluded. Boxplots indicate median and 25 and 75% quantiles, respectively; minima and maxima represent the 10th and 90th percentile, respectively. P value was determined by Welch two-sample t-test comparing mean pre-CAF signature scores between noncarrier and BRCA1+/mut patients. e, Bar chart of the average MMP3 expression in noncarrier (n = 9 patients) and BRCA1+/mut (n = 9 patients) fibroblasts. Each point represents the average score from one patient’s fibroblasts, data are presented as the mean ± s.d. P values were determined by Welch’s two-sample t-test. f, Representative images of in situ IF analysis of MMP3 (red) and PanCK (green) expression in lobular and ductal regions of breast epithelium from noncarrier and BRCA1+/mut human tissue sections. Scale bar = 50 μm. DAPI signal is shown in blue. g, Percentages of MMP3-positive stromal cells in noncarrier (blue) and BRCA1+/mut (red) samples as manually quantified from IF images. PanCK-positive epithelial cells were excluded from counts. Values are expressed as mean ± s.d. quantified from at least five random fields per patient sample. P value was determined using an unpaired two-tailed t-test.
We next sought to identify stromal factors that may induce the observed alterations in epithelial differentiation such as the expansion of basal-luminal intermediate cells (Fig. 2e,f). Interestingly, expression levels of the gene encoding secreted protease matrix metalloproteinase 3 (MMP3) were one of the top pre-CAF markers found to be elevated in BRCA1+/mut fibroblasts compared to noncarriers across all individuals (Fig. 4e). This was striking because we and others previously demonstrated that MMP3 can regulate mammary differentiation through Wnt signaling31,36, and promote breast cancer during aging37, for example, via production of reactive oxygen species and increased genomic instability38. However, our current work unraveled a potential role of fibroblast-derived MMP3 in the initiation human BRCA1+/mut-associated cancer, which had been previously unknown. To validate whether MMP3 expression is increased in BRCA1+/mut fibroblasts at the protein level in situ, we performed IF on noncarrier (n = 12) and BRCA1+/mut (n = 8) samples. This analysis revealed an expansion of MMP3-positive stromal cells in close proximity to epithelial structures in BRCA1+/mut tissues (Fig. 4e,f, Extended Data Fig. 9a,b and Supplementary Table 7), suggesting a direct link of tumor-promoting MMP3 with increased breast cancer risk in human BRCA1+/mut. The expansion of MMP3-expressing pre-CAFs in BRCA1+/mut was particularly significant in lobular regions, which could indicate that BRCA1-driven tumor initiation occurs predominantly in lobular rather than ductal regions.
To functionally determine the effects of fibroblast-derived MMP3 on human breast epithelial biology, we established a 3D stromal-epithelial coculture assay using primary human breast fibroblasts and mammary epithelial cells (MECs; Fig. 5a,b). We used lentiviral transduction to induce MMP3 overexpression in noncarrier fibroblasts (+MMP3), which yielded increased MEC growth compared to control-GFP fibroblasts (+GFP) in our coculture assay (Fig. 5c, Extended Data Fig. 10a–d and Supplementary Fig. 1a). Conversely, deleting MMP3 using CRISPR/Cas9-mediated knockout in BRCA1+/mut fibroblasts (−MMP3) resulted in substantial reduction of mammosphere growth (Fig. 5d and Supplementary Fig. 1b). To determine whether MMP3 directly promotes epithelial growth, we next added recombinant MMP3 to epithelial cells in 3D culture in the absence of fibroblasts. We found that exogenous MMP3 was sufficient to induce increased mammosphere growth in a concentration-dependent manner (Fig. 5e and Extended Data Fig. 10e,f). These results show that fibroblast-derived MMP3 acts in trans to promote human breast epithelial growth. To determine if stromal MMP3 directly induces altered differentiation, we performed IF analysis for basal (KRT14) and luminal (KRT19) markers on MMP3-treated mammospheres and observed a striking expansion of KRT14/KRT19-double positive cells upon MMP3 treatment (Fig. 5f). Additionally, as MMP3 can function through promotion of canonical Wnt signaling9, we examined the expression of the Wnt/proliferation-associated markers Cyclin D1 and c-Myc, respectively, by IF. Indeed, we observed increased levels of both Cyclin 1 and c-Myc in MMP3-treated mammospheres (Fig. 5g,h). Taken together, these findings highlight MMP3 as a key pre-CAF factor promoting epithelial proliferation and altered differentiation in breast epithelial cells in BRCA1+/mut through paracrine interactions.
Fig. 5 |. MMP3-expressing pre-CAFs promote breast epithelial proliferation and altered differentiation in primary human cocultures in vitro.
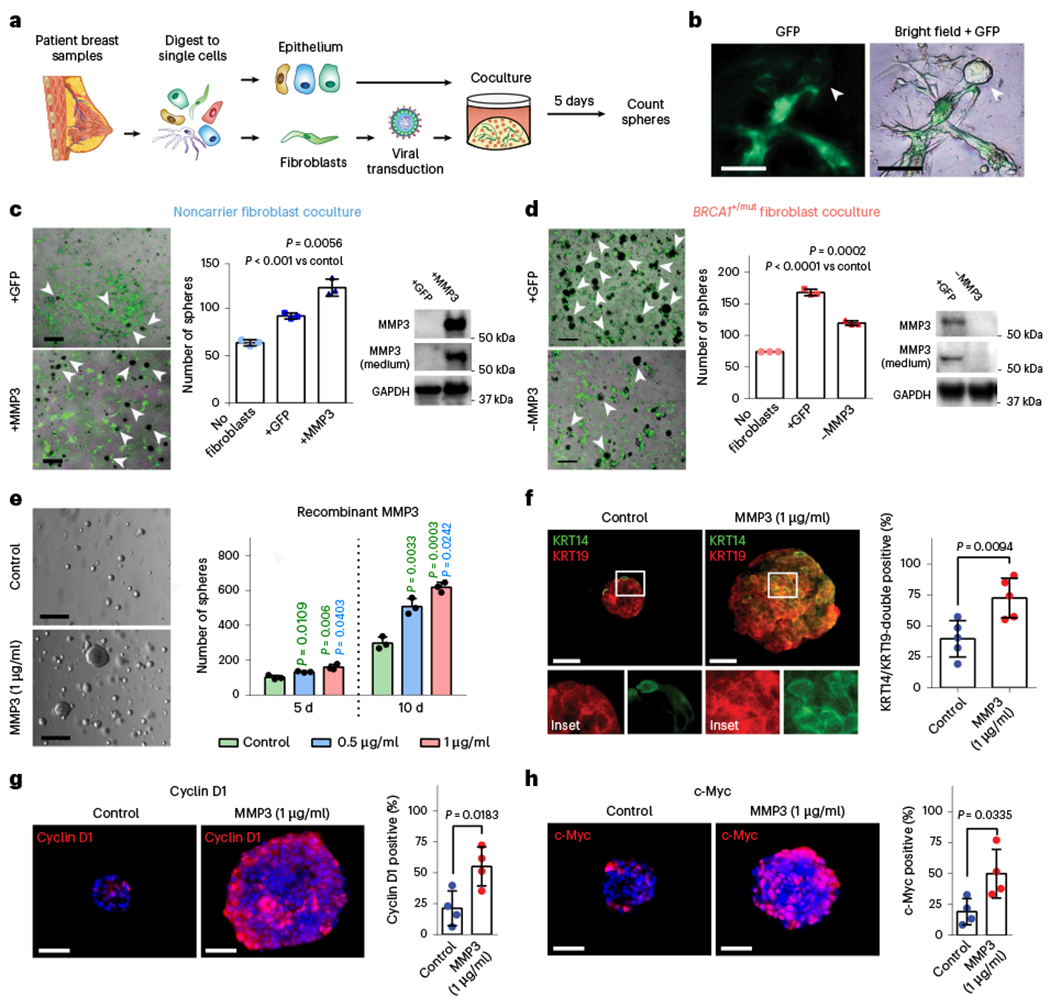
a, Schematic depicting experimental set-up for sphere assays of primary human 3D coculture using FACS-isolated epithelial cells and lentivirally transduced fibroblasts. b, Representative images depicting green fluorescent protein (GFP) expression in transduced fibroblasts in close proximity to epithelial organoids (arrow). Scale bar = 100 μm. c, Cocultures (5 d) of 4,000 breast epithelial cells seeded alone (no fibroblasts) or with 1 × 10⁵ noncarrier fibroblasts transduced with lentivirus (+GFP) or transduced to express MMP3 and GFP (+MMP3). Western blots show increased expression of MMP3 in cells and cultured supernatant of +MMP3 fibroblasts. Representative merged bright-field and GFP images of cocultures (scale bar = 400 μm) with arrows indicating epithelial mammospheres (GFP-negative). Bar charts (right) represent the number of mammospheres per well; values expressed as mean ± s.d. from three separate experiments with three triplicate wells from each. P values were determined using unpaired two-tailed t-tests. No fibroblasts versus +GFP, P = 0.0004; no fibroblasts versus +MMP3, P = 0.0005. d, Cocultures (5 d) of 4,000 breast epithelial cells seeded alone (No fibroblasts) or with 1 × 10⁵ BRCA1+/mut fibroblasts transduced with lentivirus to express CRISPR–Cas9 and MMP3 gRNA (−MMP3) and GFP or GFP only (+GFP) vectors. Western blots show decreased expression of MMP3 in cells and medium from MMP3-deficient fibroblast cultures. Representative overlay bright-field and GFP images of cocultures (scale bar = 400 μm) with arrows indicating mammospheres (GFP-negative). Bar charts (right) represent the number of mammospheres per well; values expressed as mean ± s.d. from triplicates of three independent experiments. P values were determined using unpaired two-tailed t-tests. e, 1 × 10⁵ FACS-isolated epithelial cells from patient sample ‘noncarrier 36’ were seeded in Matrigel and treated with 0.5 μg ml−1 or 1 μg ml−1 recombinant MMP3 and spheres were counted after 5 d and 10 d. Representative bright-field images of mammospheres after 10 d of culture (scale bar = 400 μm). Bar chart depicts mean ± s.d. from triplicates of three independent experiments. P values were determined using unpaired two-tailed t-tests. f, 1 × 10⁴ primary breast epithelial cells were seeded and cultured in Matrigel for 10 d with or without human recombinant MMP3. After 10 d, mammospheres were collected and subjected to IF staining for basal (KRT14; green) and luminal (KRT19; red) markers. Representative fluorescence images of mammospheres are shown. Scale bar = 50 μm. Bar chart shows the percentage of KRT14/KRT19-double positive cells. Data are presented as mean ± s.d. from four different patient epithelial cell donors per group (n = 4), with five random fields quantified per sample. P values were determined by unpaired two-tailed t-tests. g, IF staining for Cyclin D1 (red) of organoids with and without exogenous MMP3 after 10 d of mammosphere culture. DAPI staining is shown in blue. Representative fluorescence images of mammospheres are shown. Scale bar = 50 μm. Bar chart shows the percentage of Cyclin D1-positive cells. Data are presented as mean ± s.d. from four different patient epithelial cell donors per group (n = 4), with five random fields quantified per sample. P values were determined by unpaired two-tailed t-tests. h, IF staining for c-Myc (red) of organoids with and without exogenous MMP3 after 10 d of mammosphere culture. DAPI staining is shown in blue. Representative fluorescence images of mammospheres are shown. Scale bar = 50 μm. Bar chart shows the percentage of c-Myc-positive cells. Data are presented as mean ± s.d. from four different patient epithelial cell donors per group (n = 5), with five random fields quantified per sample. P values were determined by unpaired two-tailed t-tests.
To evaluate the effect of fibroblast-derived MMP3 on tumor initiation in vivo, we established a fibroblast-epithelial cotransplantation mouse model for BRCA1-driven tumor initiation (Fig. 6a). In brief, we first isolated precancerous mammary cells from Brca1fl1/fl1p53f5&6/f5&6Crec mice9. We then FACS-isolated human breast fibroblasts (PDPN+) and lentivirally modulated them to express GFP only (+GFP) or both MMP3 and GFP (+MMP3) (Extended Data Fig. 10g). We then performed orthotopic mammary fat pad cotransplantation into immunocompromised mice in three experimental groups (n = 12 each) as follows: (1) mammary cells only (control), (2) mammary cells with control +GFP fibroblasts and (3) mammary cells with +MMP3 fibroblasts. After 6 weeks, increased tumor initiation frequency was observed in the +MMP3 group (12/12) compared to mammary cells only (4/12), and the +GFP control groups (8/12), demonstrating that fibroblast-derived MMP3 promotes mutant BRCA1-mediated tumor initiation in vivo (Fig. 6b). Additionally, comparing tumor volume and mass showed substantially increased tumor growth in the +MMP3 group compared to both control groups (Fig. 6c,d). These results demonstrate that fibroblast-derived MMP3 drives BRCA1-associated breast tumorigenesis in a paracrine fashion in vivo.
Fig. 6 |. MMP3-expressing fibroblasts promote mutant BRCA1-driven breast cancer initiation in vivo.
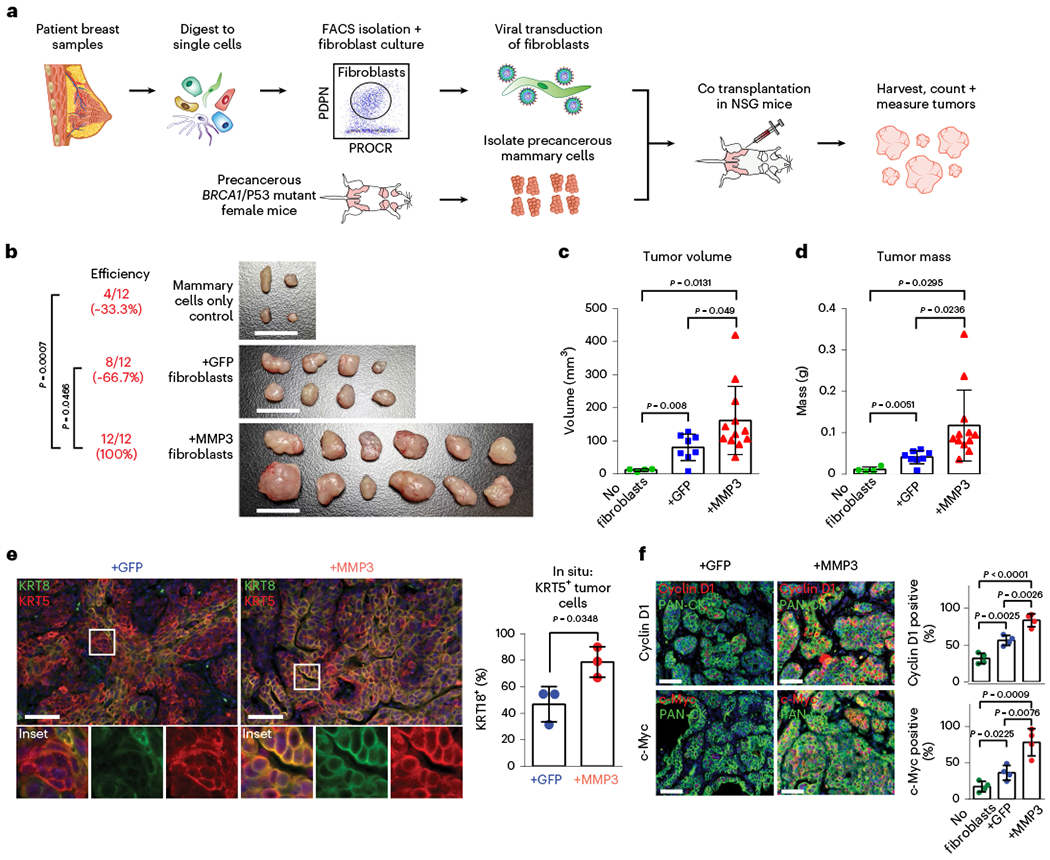
a, Schematic of mouse model to evaluate the effects of pre-CAFs on mutant BRCA1-mediated breast tumorigenesis in vivo. b, Images of dissected tumors after 6 weeks of growth with reported tumor formation efficiencies. Scale bar = 1 cm. P values were determined using one-sided Fisher’s exact test. c, Volumes of dissected tumors. Values are represented as mean ± s.d. No fibroblasts n = 4; +GFP n = 8, +MMP3 n = 12. P values were determined using unpaired two-tailed t-tests. d, Masses of dissected tumors. Values are represented as mean ± s.d. No fibroblasts n = 4; +GFP n = 8, +MMP3 n = 12. P values were determined using unpaired two-tailed t-tests. e, IF analysis of mouse tumor tissues from samples cotransplanted with control (+GFP) or MMP3-overexpressing fibroblasts (+MMP3) probed antibodies against basal (KRT5; red) and luminal (KRT8; green) markers. Representative images are shown. Scale bar = 50 μm. Bar chart shows the percentage of KRT5/KRT8-double positive cells quantified in five random fields of view from three tumor samples each (dots on bar chart). P values were determined using unpaired two-tailed t-tests. f, IF analysis for Cyclin D1 (top panel) and c-Myc (bottom panel) in mouse tumor tissues from samples cotransplanted with control (+GFP) or MMP3-overexpressing fibroblasts (+MMP3) probed with antibodies against basal (KRT5; red) and luminal (KRT8; green) markers. Representative images are shown. Scale bar = 50 μm. Bar chart shows the percentage of KRT5/KRT8-double positive cells quantified in five random fields of view from three tumor samples each (dots on bar chart). P values were determined using unpaired two-tailed t-tests.
To further establish the effect of stromal MMP3 on epithelial differentiation, we performed in situ analyses on tumors derived from cotransplantation of MMP3-overexpressing or control (GFP) fibroblasts, which revealed a significant increase of tumor cells with coexpression of basal (KRT5) and luminal (KRT8) markers when stromal MMP3 was overexpressed (Fig. 6e). Further, in line with in vitro mammosphere results (Fig. 5g,h), increased numbers of Cyclin D1-and c-Myc-positive tumor cells were observed in the presence of MMP3-expressing fibroblasts (Fig. 6f). Together, our work corroborates the tumor-promoting function of MMP3 in the context of mutant BRCA1-driven breast cancer initiation in vivo and shows that this altered differentiation phenotype can be induced in a paracrine fashion by stromal cells through secreted MMP3.
Finally, we sought to assess the effect of stromal cell-induced epithelial proliferation on breast cancer risk in BRCA1+/mut. BRCA1 haploinsufficiency is associated with increased genomic instability during proliferation39, thus stromal cell-induced proliferation may further accelerate the process of acquiring loss of BRCA1 heterozygosity and second oncogenic hits. We used a mathematical modeling approach simulating the population dynamics of cancer progenitors based on a previously developed mammary stem and progenitor hierarchal model40. We simulated the development of sequential mutations in BRCA1 and other oncogenes (for example, p53) during cancer initiation (Fig. 7a). Our results predict that twofold stromal-induced proliferation increase leads to marked accumulation of a potential cancer progenitor population (Fig. 7b and Extended Fig. 11a), which is in line with our finding of basal-luminal intermediate progenitor expansion in BRCA1+/mut (Fig. 2e–g). To achieve a realistic prediction of cancer risk over human lifespan, we used a random mutation model41 that assumes acquired mutations induce stochastic changes in cancer cell fitness42. Our model predicts that twofold increase in proliferation leads to a markedly higher overall risk of cancer (Fig. 7c and Supplementary Data). This suggests that stromal cell-induced epithelial proliferation may be directly linked with increased breast cancer risk in BRCA1+/mut.
Fig. 7 |. Mathematical modeling predicts that stromal cell-induced epithelial proliferation leads to increased lifetime breast cancer risk in BRCA1+/mut.
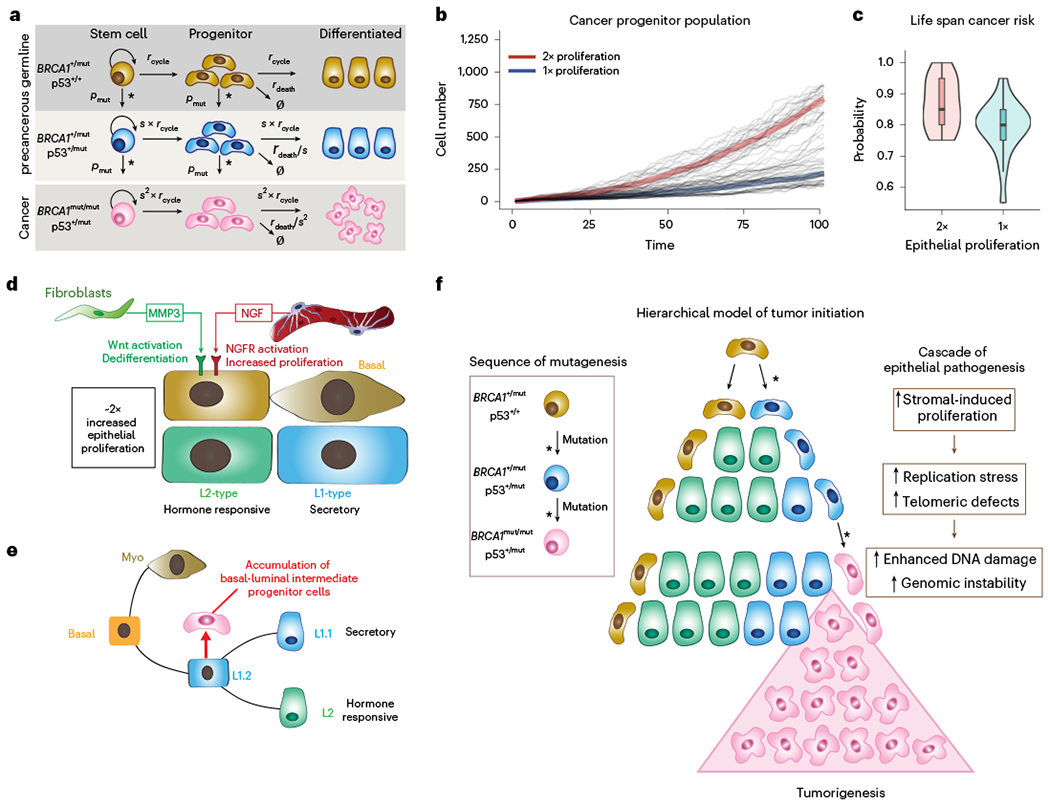
a, Schematic model illustrating the assumptions and parameters used to simulate the sequential mutations in oncogenes in BRCA1+/mut cells. rcycle is the baseline cell division rate, rdeath is the cell date rate, s is the proliferation scale factor and pmut is the probability of acquiring a variant in a driver oncogene. Parameters are further defined in Supplementary Table 17. b, Comparison between cancer progenitor population dynamics as predicted by a hierarchical model34. Thick lines: Average population dynamics of proliferation in a population with a twofold increase in proliferation and control group (blue). Gray thin lines: The stochastic simulation trajectories (sample n = 50 for each group). c, Comparison of predicted risk ratio of cancer initiation between twofold (red) and onefold epithelial proliferation rate (blue) over human lifespan. The samples are collected from the simulation of n = 40 patients in two groups, with the risk ratio of each patient estimated from n = 20 simulations of a random mutation model36. Violin plots show the distribution of risk ratios over n = 20 patients in each group, and boxplots indicate median and 25 and 75% quantiles, respectively; minima and maxima represent the 10th and 90th percentile, respectively. Wilcoxon test: P = 0.011. d, Schematic illustrating the concept of a pro-proliferative stromal niche in preneoplastic BRCA1+/mut breast tissues. BRCA1+/mut stromal cells express increased levels of pro-proliferative cues including NGF in pericytes and protumorigenic MMP3 in fibroblasts. e, We propose that stromal cues act in concert during the preneoplastic phase to promote the expansion of a subset of basal-luminal intermediate progenitor cells as potential cancer cells of origin. f, Concept illustration of hierarchical model of cancer initiation in BRCA1+/mut. Sequences of mutations are indicated in differently colored cells in box on the left; an asterisk represents a mutagenic event. Center schematic summarizes the outcome of mathematical modeling results, indicating expansion of cancer progenitors and ultimately leading to tumorigenesis. Cascade of epithelial cell-intrinsic events promoting tumorigenesis in BRCA1+/mut is shown on the right. Due to increased stromal cell-induced proliferation and replication stress, BRCA1+/mut breast epithelial stem cells accumulate mutations and become genomically instable, which ultimately drives tumor initiation.
Discussion
Other studies have characterized BRCA1+/mut preneoplastic tissues including using scRNA-seq7,8,12,43–45. While these studies primarily focused on epithelial cells, our current work revealed the distinct preneoplastic changes within various stromal cell populations such as pre-CAFs, thus prompting future research to focus on the genetic alterations occurring within stromal cell populations. Taken together, our work identifies premalignant alterations in stromal cell populations, which provide a conducive, protumorigenic niche in human BRCA1+/mut inducing the expansion of a basal-luminal intermediate subpopulation of luminal progenitors (Fig. 7d–f).
Our findings add granularity to previous reports highlighting luminal progenitors (that is, luminal 1) as the cancer cell-of-origin in BRCA1+/mut breast cancers7,8,12–14. We show that the premalignant epithelium in BRCA1+/mut displays increased proliferation and an expansion of a subset of luminal progenitors with altered differentiation characterized by a basal-luminal intermediate phenotype, which has also been observed by other recent studies2,14. It remains to be determined whether these subsets of luminal progenitors are true cancer cells of origin, for example, using mouse models of mutant BRCA1-driven breast cancer in combination with lineage tracing.
In addition, the finding that stromal cells drive hereditary breast cancer in trans may help to pave the way toward new disease monitoring and therapeutic strategies to improve BRCA1+/mut patient management. For example, our results indicate that MMPs, in particular MMP3, may be a potential drug target for primary cancer prevention in BRCA1+/mut carriers. Although MMP inhibitors have been tested as anti-cancer drugs in previous clinical trials with mostly disappointing results, poor study design focusing on late-stage cancer patients may have contributed to the lack of success in these trials46. Our study implies that targeting stromal-epithelial interactions, for example, with MMP inhibitors, should be investigated for primary cancer prevention treatment in women with high-risk BRCA1 mutations.
Methods
Collection and processing of primary human breast tissues
Nontumorigenic noncarrier and BRCA1+/mut breast tissue samples were acquired after ethical approval by the research center’s Institutional Review Boards (IRB) from the University of California, Irvine, Chao Family Comprehensive Cancer Center (approved IRB protocol UCI 17-05), the Co-operative Human Tissue Network (CHTN) and City of Hope Cancer Center (IRB protocol 17185) (see Supplementary Table 1). All patients gave written, informed consent to these studies and shared the respective metadata included in Supplementary Table 1. Inclusion criteria for both noncarrier and BRCA1+/mut samples were that they were histopathologically normal (that is, nontumorigenic samples from reduction mammoplasty, prophylactic mastectomy or contralateral mastectomy surgeries). For samples used in single-cell RNA sequencing, the respective BRCA1 variant or absence thereof was confirmed by DNA sequencing; for samples procured through CHTN, confirmation of BRCA1 mutations was provided by the respective clinical center. Tissues were processed as previously reported in ref.1. Surgical specimens were washed in PBS, mechanically dissociated with scalpels, digested with 2 mg ml−1 collagenase I (Life Technologies, 17100-017) in DMEM (Corning, 10-013-CV) overnight, digested in 20 U ml−1 DNase I (Sigma-Aldrich, D4263-5VL) for 5 min, and centrifuged for 2 min ×150g; for tissue samples noncarrier 1–3, and BRCA+/mut 1–3, supernatant was collected and centrifuged for 5 min ×500g to isolate epithelial tissue chunks in the pellet. These were viably cryopreserved in DMEM with 50% FBS (Omega Scientific, FB-12) and 10% DMSO (vol/vol) before processing into single cells for scRNA-seq or functional cell-based assays.
Single-cell transcriptomics
Primary human organoids were digested with 0.05% trypsin (Corning, 25-052-CI) containing 20 U ml−1 DNase I to generate single-cell suspensions. Cells were stained for FACS using fluorescently labeled antibodies for CD31 (eBiosciences, 48-0319-42), CD45 (eBiosciences, 48-9459-42), EpCAM (eBiosciences, 50-9326-42), CD49f (eBiosciences, 12-0495-82), SytoxBlue (Life Technologies, S34857). Only samples with at least 80% viability (assessed using SytoxBlue with FACS) were included in this study. For scRNA-seq, we excluded doublets, dead cells (Sytox-Blue+), lin+ (CD31+/CD45+), and isolated epithelial (EPCAM+) and stromal (EPCAM−) cells separately (complete list of antibodies in Supplementary Table 14). Flow cytometry sorted cells were washed with 0.04% BSA in PBS and suspended at approximately 1,000 cells per μl. Each sample was generated as an individual scRNA-seq library. Generation of libraries for 10X Genomics v1 chemistry (sample IDs: noncarrier 1; BRCA1+/mut 1) was performed following the Chromium Single Cell 3’ Reagents Kits User Guide: CG00026 Rev B. Library generation for 10X Genomics v2 chemistry (sample IDs: noncarrier 2–11; BRCA1+/mut 2–11) was performed following the Chromium Single Cell 3’ Reagents Kits v2 User Guide: CG00052 Rev B. cDNA library quantification was performed using Qubit dsDNA HS Assay Kit (Life Technologies, Q32851) and high-sensitivity DNA chips (Agilent. 5067-4626). Quantification of library construction was performed using KAPA qPCR (Kapa Biosystems, KK4824). The Illumina HiSeq4000 and NovaSeq6000 platforms were used to achieve an average of 50,000 reads per cell and alignment was performed using 10X Cell Ranger v3.1 to the GRCh38 reference.
Seurat analysis of scRNA-seq data
The Seurat pipeline (version 4.0.4) was used for dimensionality reduction and clustering of scRNA-seq data. In brief, the combined count matrix data was loaded into R (version 4.1.0) scaled by a size factor of 10,000 and subsequently log transformed. Gene expression cutoffs were at a minimum 200 and a maximum of 6,000 genes per cell for each dataset. Cells with greater than 20% mitochondrial genes were removed. Individual epithelial and stromal libraries were analyzed to create cell type labels based on the known marker gene expression.
Seurat’s integration was then used to group cell types from disparate patients, integration anchors were identified across all individual patient library samples, as previously described in ref. 47. Specific markers for each cell type was determined using the ‘FindAllMarkers’ function using logfc.threshold = 0.25 and min.pct = 0.25. For epithelial subset analysis, epithelial cells from all patients integrated and cell states were clustered and classified using gene scoring according to the previously described cell states1, namely for basal, myoepithelial, luminal 1-ALDH1A3, luminal 1-LTF, luminal 2-MUCL1 and luminal 2-AREG (see marker genes in Supplementary Table 3). Single-cell energy (scEnergy) analysis was done in R as recently described in ref. 25. For gene scoring analysis, we used Seurat’s ‘AddModuleScore’ function. Differential gene expression analysis was performed for each of the cell types, comparing the transcriptome of cells from noncarrier and BRCA1+/mut cells using the ‘FindMarkers’ function, using the Wilcoxon rank sum test.
Ligand–receptor interaction analysis
To quantify potential cell–cell paracrine interactions, we utilized a list of receptor–ligand interactions compiled by ref. 48 that was generated from ref. 49. A ligand or receptor is defined as ‘expressed’ if 20% of cells in a particular cell type expressed the ligand/receptor at an average level of 0.1. Therefore, a receptor–ligand interaction was considered to be expressed when both the receptor and ligand were expressed in 20% of cells at a level equal or greater than 0.1. To define these networks of interaction, we connected any two cell types where the ligand was expressed in one and the receptor in the other. ‘Enhanced’ receptor–ligand interactions were defined as interactions that were unique within BRCA1+/mut or noncarrier cells. To plot networks, we used the chord diagram function in the R package ‘circilize’. GO term analysis from receptor–ligand interactions was determined using the gene list enrichment analysis tool ‘Enrichr’50, analyzing unique BRCA or noncarrier receptor–ligand pairs.
Primary cell isolation and culture
Fibroblasts/stromal cells were cultured in fibroblasts medium (Science-Cell, 2301) and mammary epithelial cells were cultured in EpiCult-B medium (STEMCELL Technologies, 05610) supplemented with 10 ng ml−1 human recombinant EGF (PeproTech, AF-100-15), 10 ng ml−1 human recombinant bFGF (PeproTech, 100-18B), 5% FBS (vol/vol), and 1% Pen Strep (Hyclone, SV30010; vol/vol). Primary human mammary epithelial cells were seeded in Corning Matrigel Matrix–Growth Factor Reduced (Corning, 354230) and immersed in EpiCult-B Medium for coculture studies. For cultures with human recombinant NGF (Peprotech, 450-01) and human recombinant MMP3 (Peprotech, 420-03), 100 ng ml−1 and 0.5 μg ml−1 or 1 μg ml−1 were used in Mammary Epithelial Growth Medium (Lonza, CC-3150), respectively. All cells were grown at 37 °C and at 5% CO2. Antibodies used for FACS Isolation are listed in Supplementary Table 14.
Human breast morphogenesis assay
Hydrogel branching assays were adapted from a previously described protocol24,44. On ice, Rat Tail Collagen (Millipore, 08-115; Lot 3026722) was diluted with Lonza Mammary Epithelial Growth Medium (MEGM, CC-3150) to a concentration of 1.7 mg ml−1, in NGF treatment group, 100 ng ml−1 of recombinant NGF (Peprotech, 450-01) was supplemented to the media. 0.1 N NaOH was added to a final pH of 7.2. ECM components were added at final concentrations of 0.5 mg ml−1 of Laminin (Thermo Fisher Scientific, 2301-015), 0.25 mg ml−1 of Hyaluronan (R&D, GLR004) and 0.5 mg ml−1 of Fibronectin (Thermo Fisher Scientific, PHE0023). Patient breast tissue that was processed as described above, was thawed and washed and loaded into the hydrogel. Hydrogels were plated in 96-well glass bottom dishes (Thermo Fisher Scientific, 164588) and then incubated for 1 h at 37 °C. After hydrogels were solidified, MEGM media was added to the hydrogel, and then incubated at 37 °C at 5% CO2. Primary branch lengths were measured using ImageJ software. Statistical significance of differences between groups of growth curves was determined by the Comparing Groups of Growth Curves permutation test, as described previously in ref. 51.
Gene expression analysis by quantitative PCR
Cells were sorted by FACS as described above and RNA was extracted using the Quick-RNA Microprep Kit (Zymo Research, R1050) according to the manufacturer’s instructions. RNA concentration and purity were measured using a Pearl nanospectrophotometer (Implen). Quantitative real-time PCR was conducted using the PowerUp SYBR green master mix (Thermo Fisher Scientific, A25742) and primer sequences were found in Harvard primer bank and designed from Integrated DNA Technologies. Gene expression was normalized to the GAPDH housekeeping gene. For relative gene expression, 2^negΔΔCt values were used and for statistical analysis ΔCt was used. Statistical significance of differences between groups was determined by unpaired t-tests using Prism 6 (GraphPad Software). Primers are listed in Supplementary Table 15.
In situ IF analysis
Tissues were fixed in 4% formaldehyde or 10% Formalin for 24 h, dehydrated in increasing concentrations of ethanol, cleared with Histo-Clear and embedded in paraffin. Five to 10 μm tissue sections were prepared using a Leica SM2010 R Sliding Microtome (Leica Biosystems). Slides were baked at 65 °C overnight, cleared with Histo-Clear (National Diagnostics, HS-200) with 2 × 5 min incubations, rehydrated with decreasing concentrations of ethanol, washed in ddH2O and subjected to heat-mediated antigen retrieval using a steamer with 10 mM citric acid buffer (pH 6.0; Sigma-Aldrich, C9999) for 20 min. Tissues were washed and permeabilized in PBST (0.1% Tween-20) for 10 min, blocked in BlockAid Blocking Solution (Thermo Fisher Scientific, B10710; Lot: 2456938) for 60 min at room temperature, incubated with primary antibodies in blocking solution at 4 °C overnight, washed in PBS, incubated with secondary antibodies diluted in PBS for 1 h and washed in PBS. The following primary antibodies were used: anti-MMP3 (Abcam, Ab53015; Lot: GR3364427-1, used at 1:100), anti-pan Cytokeratin (PanCK) (Genetex, GTX26401; Lot: 822000222, used at 1:500). The following secondary antibodies were used at 1:250 dilution: Donkey anti-rabbit IgG (H + L) Alexa Fluor 647 (Thermo Fisher Scientific, A31573; Lot: 1826679), donkey anti-mouse IgG (H + L) Alexa Fluor 488 (Thermo Fisher Scientific, A21202; Lot: 1820538). Secondary antibody-only negative controls were included, in which primary antibodies were omitted in tissue sections (adding blocking buffer only). Slides were mounted with VECTASHIELD Antifade Mounting Medium with DAPI (Vector Laboratories, H-1200), and images were taken on a BZ-X710 Keyence All-in-One Fluorescence Microscope (Keyence Corporation, BZ-X Viewer Software) with a 20× objective (PlanFluor, NA 0.45, Ph1). Image acquisition settings for all antibody marker channels were kept constant throughout the study and secondary-only control sections were used to confirm the absence of background fluorescence. Specifically, exposure times were 1/3 s for GFP channel (detection of PanCK) and 1/5 s for Cy5 channel (detection of MMP3). DAPI exposure times were around 1/30 s, but adjusted where necessary in tissue sections to account for variances in nuclear staining intensity. Post acquisition, images were processed using BZ-X Analyzer software version 1.4.1.1. All images were processed using the following parameters: GFP channel (PanCK signal) brightness 200/contrast 5. CY5 channel (MMP3 signal) was not modified in any image. To quantify percentages of MMP3+ stromal cells in BRCA1+/mut versus noncarrier breast tissues, the number of MMP3-positive stromal cells (PanCK negative cells) was manually counted from at least five random fields or more when possible; only the noncarrier 26 and BRCA1+/mut four samples had less than five fields counted (4 and 3 fields, respectively) due to the scarcity of epithelial structures in these tissues. See Supplementary Table 7 for all manual counts of MMP3-positive stromal cells and the total number of stromal cells counted. PCNA quantification was performed using ImageJ, calculating for the percentage of PCNA-positive in DAPI-identified nuclei. All other in situ IF images were manually counted as described in Fig. 2i,j legends using at least five random fields of view per group or sample. Images were cropped and composed into figures using Adobe Illustrator software. All antibodies are listed in Supplementary Table 14.
Lentiviral transduction of primary human stromal cells
Primary mammary fibroblasts were transfected with lentiviral particles for 48 h with a multiplicity of infection of ten with 10 μg ml−1 polybrene (Sigma-Aldrich, TR-1003-G). Lentiviral particles were purchased from VectorBuilder Inc. and contain the following vectors: a GFP expression vector (VB190812-1255tza), a human MMP3 expression vector (VB170623-1025nbv), a mouse MMP3 expression vector (VB190814-1162wgk), a gRNA expression vector targeting human MMP3 (VB170623-1031qnn) and a Cas9 expression vector (VB170830-1178xap). Transfected cells were isolated by FACS with a BD FACSAria Fusion (Becton Dickinson). For CRISPR/Cas9-mediated MMP3 knockout studies, human primary mammary fibroblasts were first transduced to express Cas9 and were isolated by FACS using the mCherry marker. Subsequently, these cells were expanded and transduced a second time to express a gRNA targeting human MMP3 and were isolated by FACS using the GFP marker.
Western blot analyses
Protein samples were subjected to gel electrophoresis, transferred to a PVDF membrane and blocked with a 5% wt/vol BSA PBST (0.1% Tween-20) solution for 1 h. Membranes were incubated with primary antibodies overnight at 4 °C; MMP3 pAb diluted 1:1,000 (Proteintech Group, 17873-1-AP), GAPDH mAb diluted 1:1000 (Cell Signaling Technology, 2118S). Membranes were washed with PBST (0.1% Tween-20) and incubated with secondary antibodies for 1 h at room temperature; horseradish peroxidase-conjugated goat anti-rabbit IgG secondary antibody diluted 1:2,000 (Thermo Fisher Scientific, G-21234). Membranes were washed with PBST (0.1% Tween-20) and imaged with a chemiluminescence reagent (Thermo Fisher Scientific, 34095). Densitometry analyses were performed using ImageJ software.
Mouse strains
NSG mice were purchased from The Jackson Laboratory. BRCA1/p53-deficient mice (BRCA1f11/f11p53f5&6/f5&6Crec) were established and genotyped as previously described in ref. 5. All mice were maintained in a pathogen-free facility. All mouse procedures were approved by the University of California, Institutional Animal Care and Use Committee. Animals were housed with a 12-h light/12-h dark cycle in ambient temperatures (~20 to 23 °C) and humidity (40–60% humidity).
Stromal-epithelial cotransplantation for mutant BRCA1-driven cancer initiation in vivo BRCA1-driven cancer initiation in vivo
Brca1f11/f11p53f5&6/f5&6Crec mice have a median tumor latency of 6.6 months5. Thus, preneoplastic primary mammary cells were isolated from all mammary glands of 6-month-old Brca1f11/f11p53f5&6/f5&6Crec female donor mice. Mammary glands were mechanically dissociated, digested in 2 mg ml−1 collagenase type 4 (Sigma-Aldrich) for 1 h at 37°C, subjected to differential centrifugation and digested to single cells with trypsin. Primary human fibroblasts were isolated by FACS (PDPN+) and subjected to lentiviral transduction to express GFP only (+GFP) or both GFP and mouse MMP3 (+MMP3). Transduced fibroblasts were isolated by FACS based on GFP expression and further expanded in vitro. Three cohorts of recipient NSG mice (n = 12 per cohort) were transplanted with 5 × 10⁵ preneoplastic mammary cells, 5 × 10⁵ preneoplastic mammary cells with 5 × 10⁵ +GFP fibroblasts, or 5 × 10⁵ preneoplastic mammary cells with 5 × 10⁵ +MMP3 fibroblasts. Transplantations were done with 100 μl cell solutions of 1:1 PBS and growth factor reduced Matrigel (Corning) into each of the four inguinal mammary glands (bilateral injections) in 4- to 8-week-old female NSG mice. Tumors were collected after 6 weeks and measured with calipers and a scale. The results of Fisher’s exact test were generated using SAS software (Copyright 2020 SAS Institute). All other statistics were performed with GraphPad Prism software. The maximal tumor size permitted by the University of California, Institutional Animal Care and Use Committee is 1.7 cm in diameter, which was not exceeded in our studies.
Kaplan–Meier survival analysis
For overall survival analysis, Kaplan–Meier survival curves were generated using microarray data of primary tumors from n = 1,764 patients in the KM Plotter database42. For the overall survival analysis for the pre-CAF gene signature, we used the top 100 marker genes as generated by the ‘FindMarkers’ function in Seurat (Supplementary Table 9). For overall survival analysis of pre-CAF and noncarrier gene signatures, a weighted average was calculated with the ‘Use Multiple Genes’ function in KM Plotter. All Kaplan–Meier plots were generated with the top 100 genes using the ‘auto select best cutoff’ parameter.
Single-cell western blots
Single-cell western blot assays were performed using the ProteinSimple Milo platform with the standard scWest Kit (ProteinSimple). scWest chips were rehydrated and loaded with cells at a concentration of ~1 × 10⁵ of cells in 1 ml suspension buffer. Doublet/multiplet capture rate in scWest chip microwells was determined with light microscopy (<2%, established from > 1,000 microwells). Cells loaded on scWest chips were lysed for 10 s and electrophoresis immediately followed at 240 V. Protein was immobilized with UV light for 4 min and scWest chips were probed sequentially with primary and secondary antibodies for 1 h each. Primary antibodies were rabbit anti-KRT23 (1:20; Sigma-Aldrich), mouse anti-KRT18 (1:10, Invitrogen), mouse anti-KRT14 (1:10, Invitrogen) and rabbit anti-KRT19 (1:10, GeneTex). Secondary antibodies were donkey anti-mouse Alexa Fluor 647 (1:10; Thermo Fisher Scientific) and donkey anti-rabbit Alexa Fluor 555 (1:10; Thermo Fisher Scientific). Slides were washed, centrifuge-dried and imaged with the GenePix 4,000B Microarray Scanner (Molecular Devices). Data were analyzed using Scout Software (ProteinSimple) and ImageJ. Debris, artifacts and false-positive signals were manually excluded during data analyses.
IF analysis of mammospheres
Mammospheres were liberated from Matrigel using dispase (5 U ml−1; Stemcell Technologies, 07913), washed in PBS and fixed in 4% formaldehyde for 15 min. Spheres were washed in PBS, permeabilized with 0.5% Triton X-100 in PBS for 10 min, washed in PBS and blocked in 10% FBS in PBS with 0.1% Tween-20 for 1 h. Spheres were incubated with primary antibody in blocking solution overnight at 4 °C, washed with PBS and incubated with secondary antibody in blocking solution for 1 h. Spheres were washed with PBS, mixed with VECTASHIELD Antifade Mounting Medium with DAPI (Vector Laboratories, H-1200) and coverslipped on slides. Fluorescent images were taken with the BZ-X700 Keyence fluorescent microscope (Keyence Corporation).
Mathematical modeling of breast cancer initiation
For hierarchical model with sequential mutations in oncogenes, we adopted a cancer stem cell model40 with sequential mutations of cancer-driver genes to simulate the progress of tumors. Assumptions of the model include (1) within the same genotype, stem cells self-renew and give rise to cancer progenitor cells through cell division; (2) cancer progenitor cells differentiate through asymmetric divisions for a limited number of cell cycles and (3) epithelial stem cells and cancer progenitor cells can switch their genotypes by acquiring mutations in oncogenes, and these driver mutations further increase the cell division rate. Cancer cell populations were considered to be initiated upon the accumulation of driver mutations. To investigate the pro-proliferative effect of MMP3, we roughly estimated the effect of increased proliferation rate of stem and progenitor cells by twofold, based on in situ staining for PCNA to mark proliferative cells (Fig. 2i,j).
For the random mutation model with stochastic fitness shift, we modified a cancer stem cell model41 to allow for stochastic changes of individual cell fitness during cell division, induced by both cancer driver and passenger mutations. We assume that the wild-type fitness score is one, and the advantageous mutations to cell fitness score (that is, cancer driver mutations) are far less frequent than silent and deleterious mutations to the cell fitness score. We assume that the stem cell population follows the Moran process, where cells with high fitness are more likely to proliferate. Stromal cues such as NGF and MMP3 enhance cell proliferation. In this model, the populations with larger proportion of high-fitness progenitor cells are more likely to initiate cancer.
To calculate relative cancer risk ratio, for each patient i, in the jth simulation of random mutation model over the lifespan, we first calculated high-fitness ratio pij as the percentage of progenitor cells with fitness score larger than one in the final fitness distribution. The relative risk ratio Ri for patient i is then defined as the likelihood that pij is greater than 0.5 in n = 20 simulations. We computed the Ri for a population of n = 20 patients in each condition with noncarrier and twofold proliferation rate.
For numerical simulation, we used the R package DIFFpop40 to simulate both the hierarchical and random mutation models. In the hierarchical model, the BRCA1+/mut stem cells are treated as the FixPop class with n = 10 cells, all other stem cells and progenitor populations are treated as the GrowingPop class, and the differentiated cells are treated as the DiffTriangle class. In the random mutation model, epithelial stem cells are treated as the FixPop class with n = 10 cells, cancer progenitor cells with GrowingPop class and terminally differentiated cells with DiffTriangle class. The stochastic change in fitness induced by mutations is assumed to follow the double exponential.
Statistics and reproducibility
Statistics were performed as described in the respective figure legends and methods sections. No statistical method was used to predetermine sample sizes. No data were excluded from the analyses of all studies. The experiments in this study were not randomized. The investigators were not blinded to allocation during experiments and outcome assessment.
Reporting summary
Further information on research design is available in the Nature Portfolio Reporting Summary linked to this article.
Extended Data
Extended Data Fig. 1 |. Flow cytometry gating strategy and quality control metrics for scRNA-seq analysis of breast tissues.
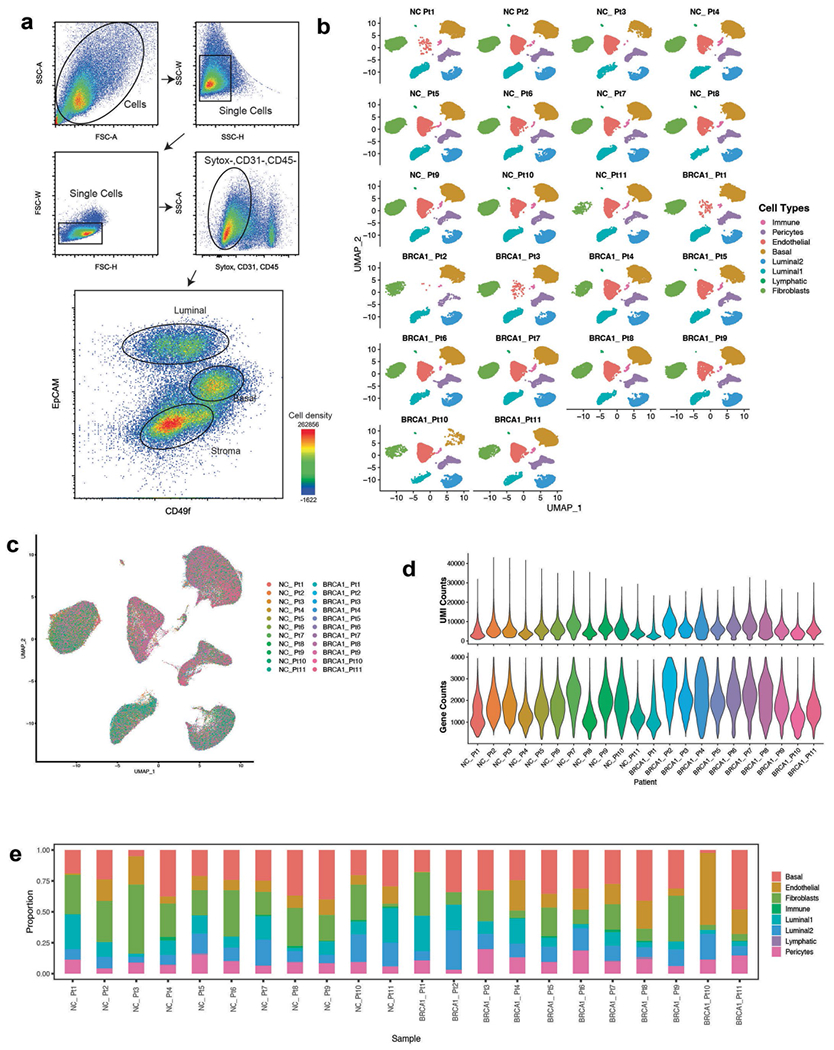
a) FACS plots showing gating strategy of mammary epithelial cells in forward and side scatter, singlets gate, dead cell (Sytox + ) and lineage (CD31 + , CD45 + ) exclusion gate. FACS plot on the right-hand side shows gating strategy for basal (Epcam + , CD49f-high) and luminal (Epcam-high, CD49f-low) epithelial cells as well as for stromal cells (Epcam-). b) Faceted UMAP projections of n = 22 NonCarrier and BRCA1+/mut patient scRNA-seq libraries. Each faceted UMAP projection represents all cells per individual patient. NC – NonCarrier, BRCA1 – BRCA1 germline mutation carrier. c) Combined UMAP projection of all cells colored by patient. d) Violin plots depicting UMI counts (number of individual molecules interrogated/droplet) (top) and gene counts (number of unique genes detected/droplet) (bottom) of each individual patient scRNA-seq library. e) Stacked bar plots indicating proportions of cell types detected in individual BRCA1+/mut or NonCarrier samples.
Extended Data Fig. 2 |. Differential gene expression analysis between fibroblasts and pericytes in the human breast.
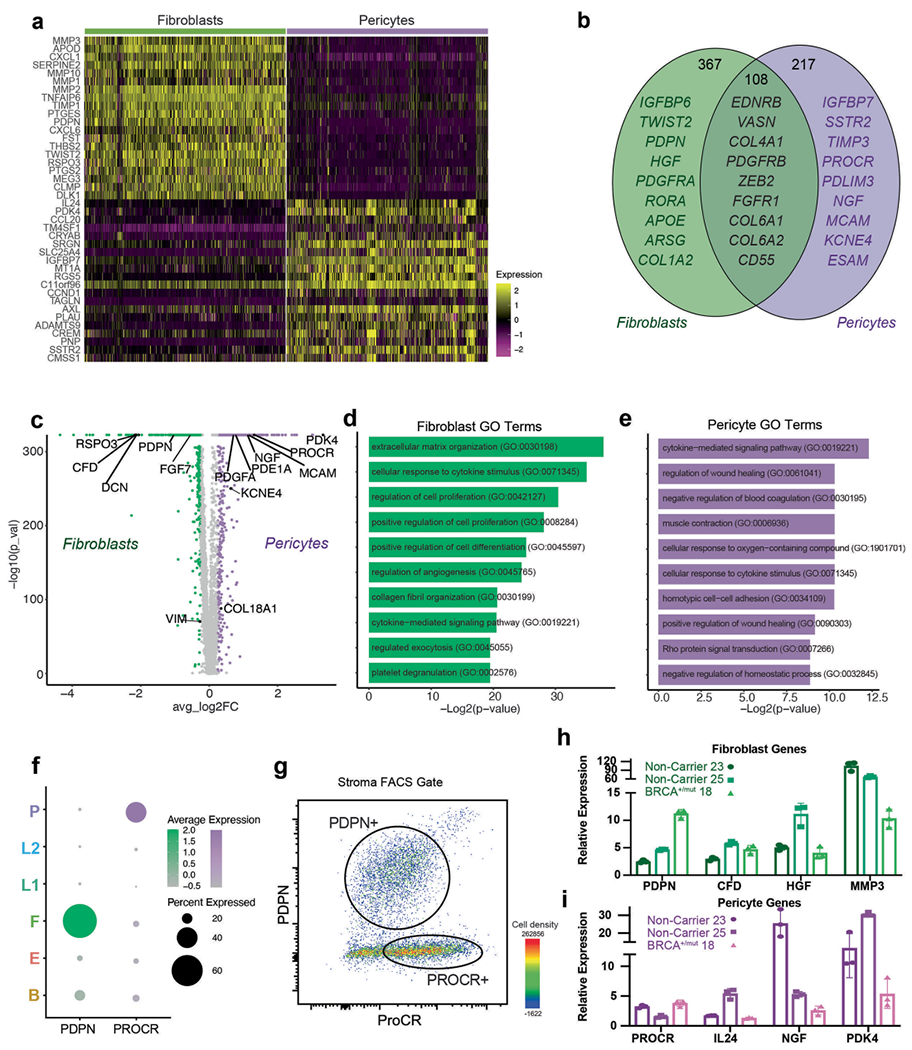
a) Heatmap showing expression of top 20 marker genes specifically expressed in fibroblasts and pericytes from scRNA-seq dataset (rows=genes, columns=cells). Yellow represents a positive z-score, purple represents a negative z-score. b) Venn diagram illustrating the number of genes that are mutually or exclusively expressed in fibroblasts and pericytes. Selected marker genes for each category are shown. c) Volcano plot depicting differential gene expression analysis of fibroblasts (green) and pericytes (violet), the Wilcoxon rank sum test is used to determine differentially expressed genes, adjusted p values are determined using the Bonferroni method for multiple testing correction. d) Bar chart showing top 10 GO Terms enriched in all 367 fibroblast-specific genes. e) Bar chart showing top 10 GO Terms enriched in all 217 pericyte-specific genes. f) Dot plot illustrating mRNA expression levels of PDPN and PROCR by fibroblasts and pericytes, respectively. g) FACS plot gated on live cells, singlets, lin-, EpCAM− stromal cells showing distinct populations of PDPN + and PROCR + stromal cells. h) Gene expression analysis of FACS-isolated PROCRmid PDPN + stromal cells by qPCR for selected fibroblast-specific genes. Gene expression normalized to GAPDH and relative expression versus PDPN-PROCR + stromal cells from FACS is shown. Each bar graph shows three points (n = 3), each point represents 1 biologically independent patient’s averaged fold change of a technical triplicate (n = 3), Whisker plots represent the mean and the 25th and 75th quantiles. i) Gene expression analysis of FACS-isolated PROCR + PDPN- stromal cells by qPCR for selected pericyte-specific genes. Gene expression normalized to GAPDH and relative expression versus PROCRmidPDPN + stromal cells from FACS is shown. Each bar graph shows three points (n = 3), each point represents 1 biologically independent patient’s averaged fold change of a technical triplicate (n = 3), Whisker plots represent the mean and the 25th and 75th quantiles.
Extended Data Fig. 3 |. High-resolution scRNA-seq analysis of BRCA1+/mut epithelial cells shows increase of basal epithelial cells with altered differentiation.
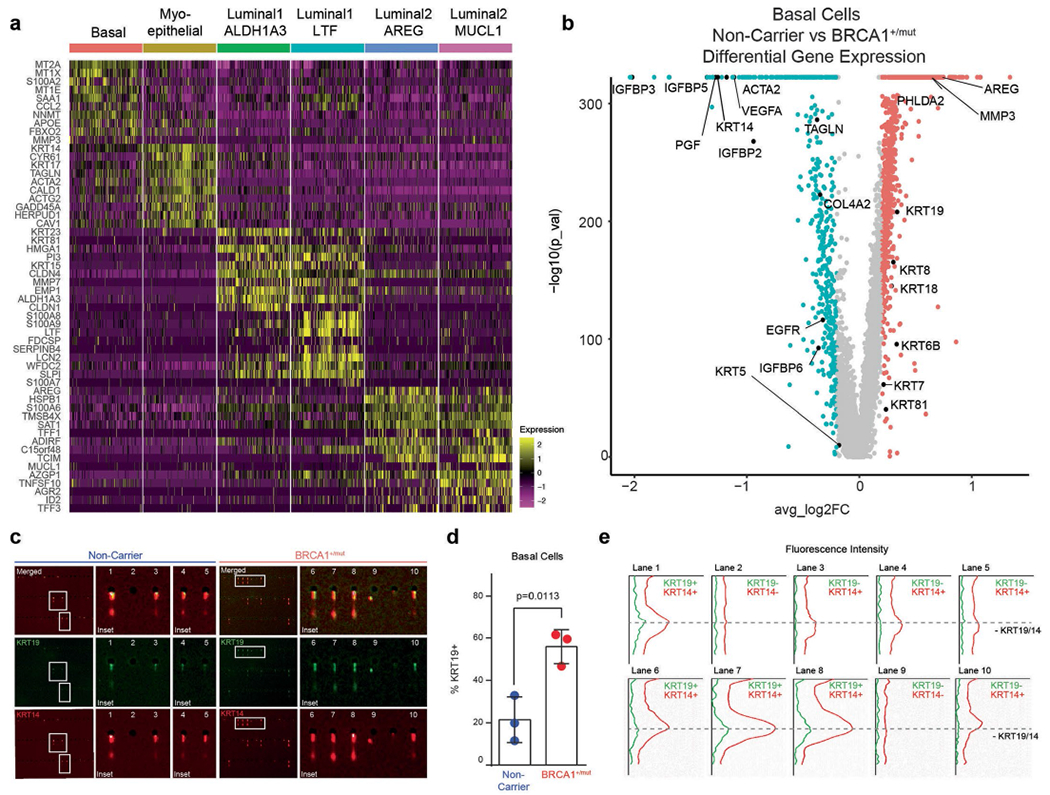
a) Top 10 marker gene heatmap for epithelial cell states in BRCA1+/mut breast tissues. b) Volcano plot showing differentially expressed genes between NonCarrier and BRCA1+/mut basal epithelial cells. P values were determined using the Seurat tobit likelihood-ratio test, the wilcoxon rank sum test is used to determine differentially expressed genes, adjusted p values are determined using the Bonferroni method for multiple testing correction. c) Single-cell western blot (scWB) analyses for KRT14 and KRT19 on FACS-isolated basal epithelial cells from NonCarrier and BRCA1+/mut individuals. Representative regions of scWB chips post electrophoresis and antibody probing. d) Quantification of scWBs of all basal cells analyzed. Data is represented as mean ± SD from at least 1000 cells/individual; NonCarrier n = 3, BRCA1+/mut n = 3. P value was determined with an unpaired two-tailed t-test. e) Relative fluorescence intensity of KRT14 and KRT19 of selected lanes in scWB as indicated in c).
Extended Data Fig. 4 |. BRCA1+/mut tissues harbor increased numbers of KRT19 + cells that co-express KRT14.
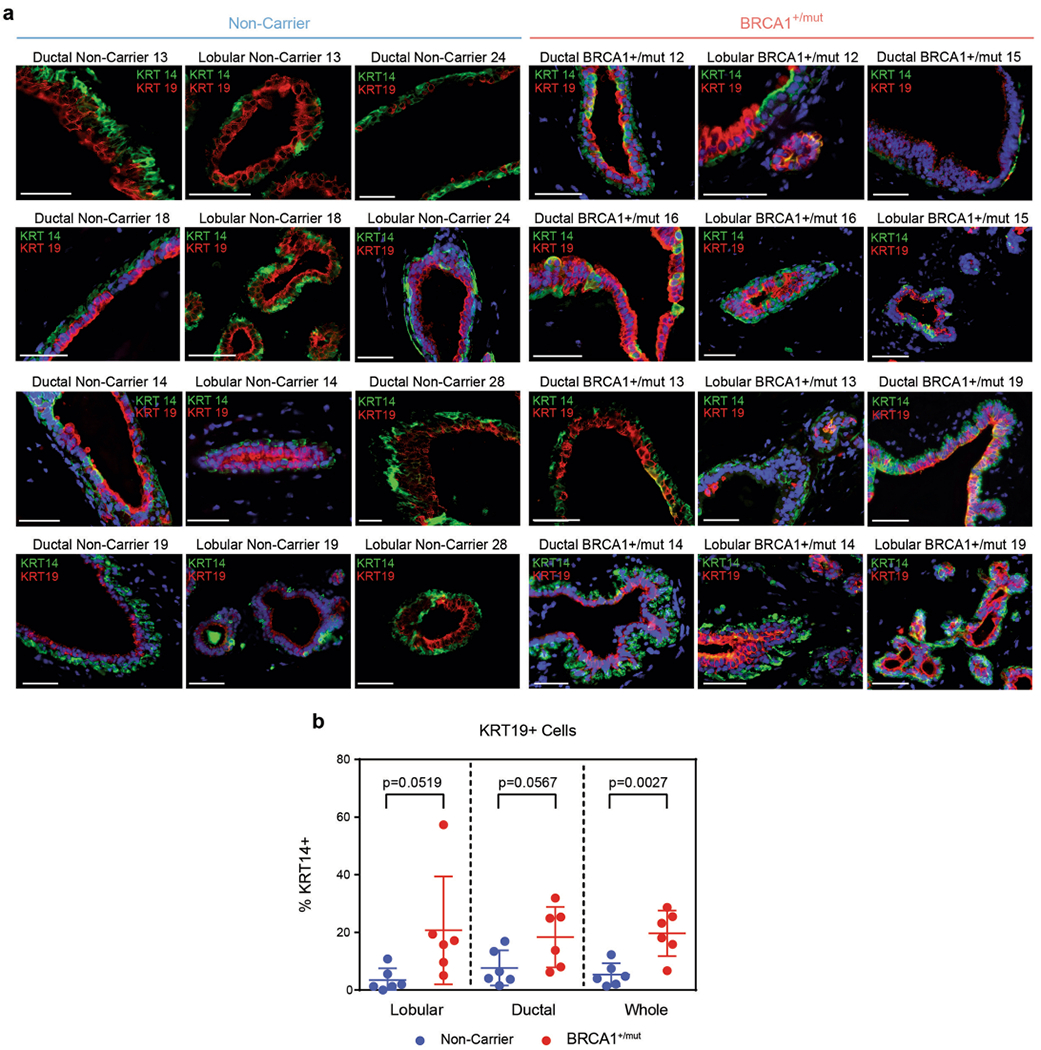
a) Representative IF staining for KRT14 (green) and KRT19 (red) in human mammary tissues from NonCarrier (n = 6) and BRCA1+/mut (n = 6) individuals. Yellow staining indicates epithelial cells that are KRT14/KRT19-double-positive. Scale bar= 50 μm. b) Bar graph depicting percentages of KRT14/KRT19-double-positive cells in lobular and ductal epithelial regions and whole tissue (lobular + ductal regions) of human mammary tissues from NonCarrier (n = 6) and BRCA1+/mut (n = 6) individuals. Values are represented as mean ± SD from counts of at least 5 different random fields per tissue. P values were determined by unpaired two-tailed t-tests.
Extended Data Fig. 5 |. BRCA1+/mut tissues harbor increased numbers of KRT19 + cells that co-express KRT23.
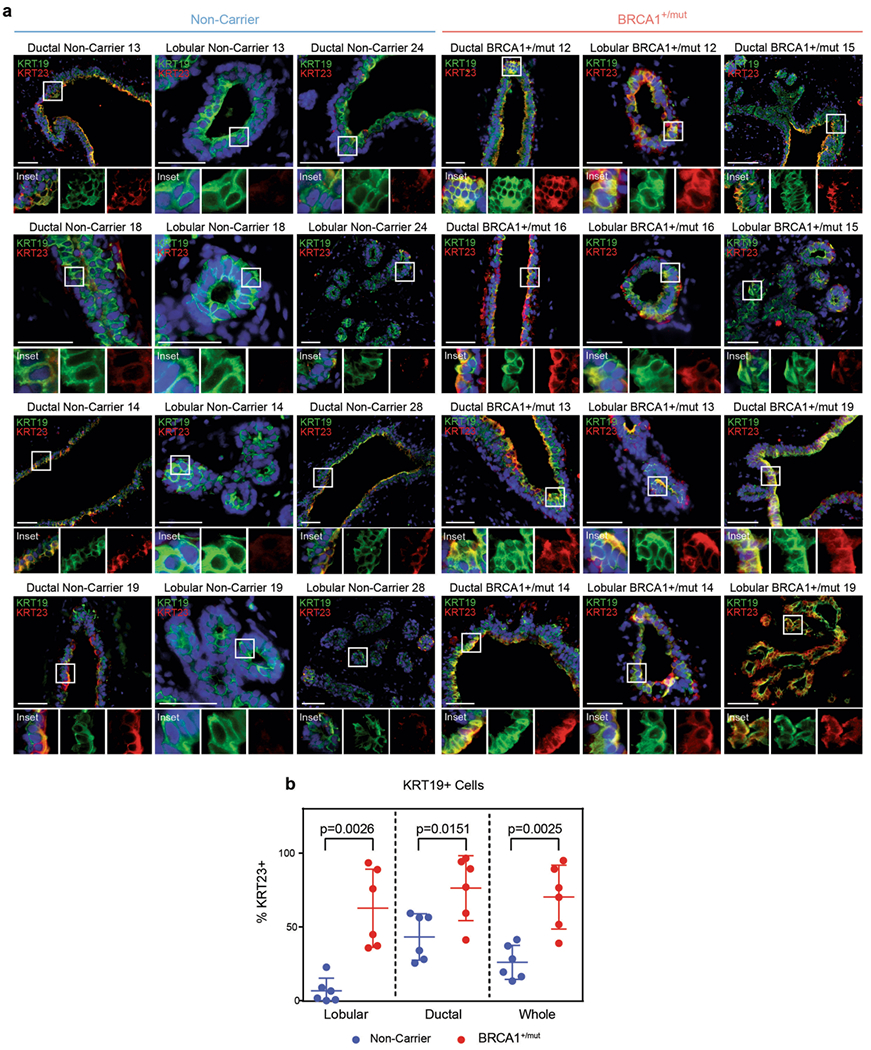
a) Representative immunofluorescence staining for KRT23 (red) and KRT19 (green) in human mammary tissues from NonCarrier (n = 6) and BRCA1+/mut (n = 6) individuals. Yellow staining indicates epithelial cells that are KRT19/KRT23 double-positive. Scale bar = 50 μm. b) Bar graph depicting percentages of KRT19/KRT23 double-positive cells in lobular and ductal regions of epithelial tissues and whole tissue (lobular + ductal regions) of human mammary tissues from NonCarrier (n = 6) and BRCA1+/mut (n = 6) individuals. Values are represented as mean ± SD from counts of at least 5 different random fields per tissue. P values were determined by unpaired two-tailed t-tests.
Extended Data Fig. 6 |. Ligand–receptor interaction analysis in NonCarrier breast tissues.
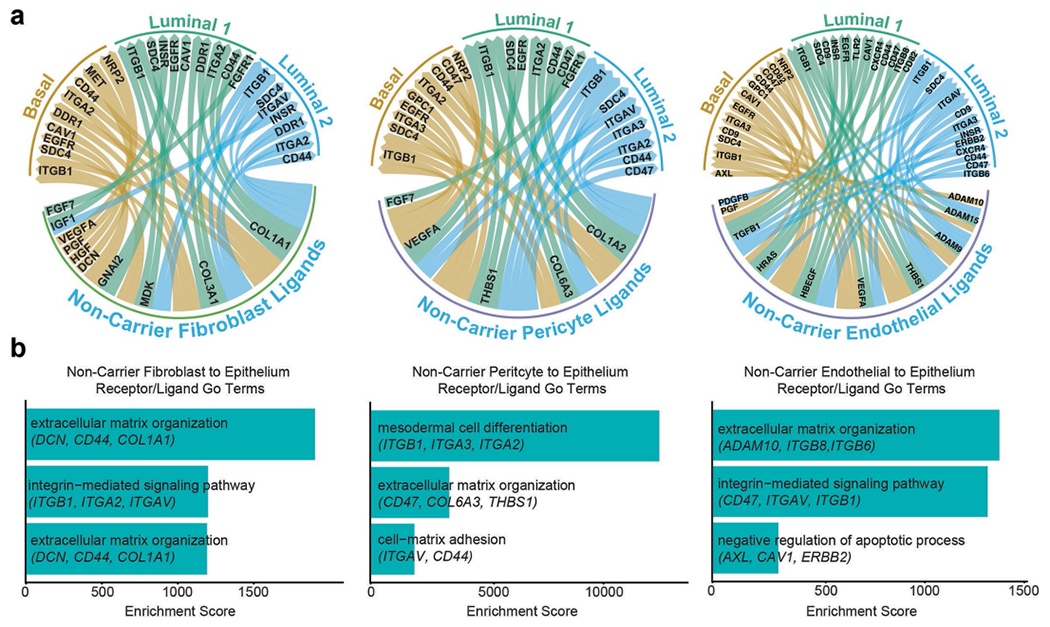
a) Ligand–receptor interactions depicted in Circos plots of ligands expressed by fibroblasts, pericytes or endothelial cells interacting with receptors on epithelial cells in NonCarrier breast tissues. b) Receptor–ligand interaction enrichment scores of GO Terms (GO-Biological Processes 2018) of ligands from NonCarrier fibroblasts (left), pericytes (center), and endothelial cells (right), and epithelial receptors are shown.
Extended Data Fig. 7 |. BRCA1+/mut vascular cells express elevated levels of NGF which increases branching morphogenesis.
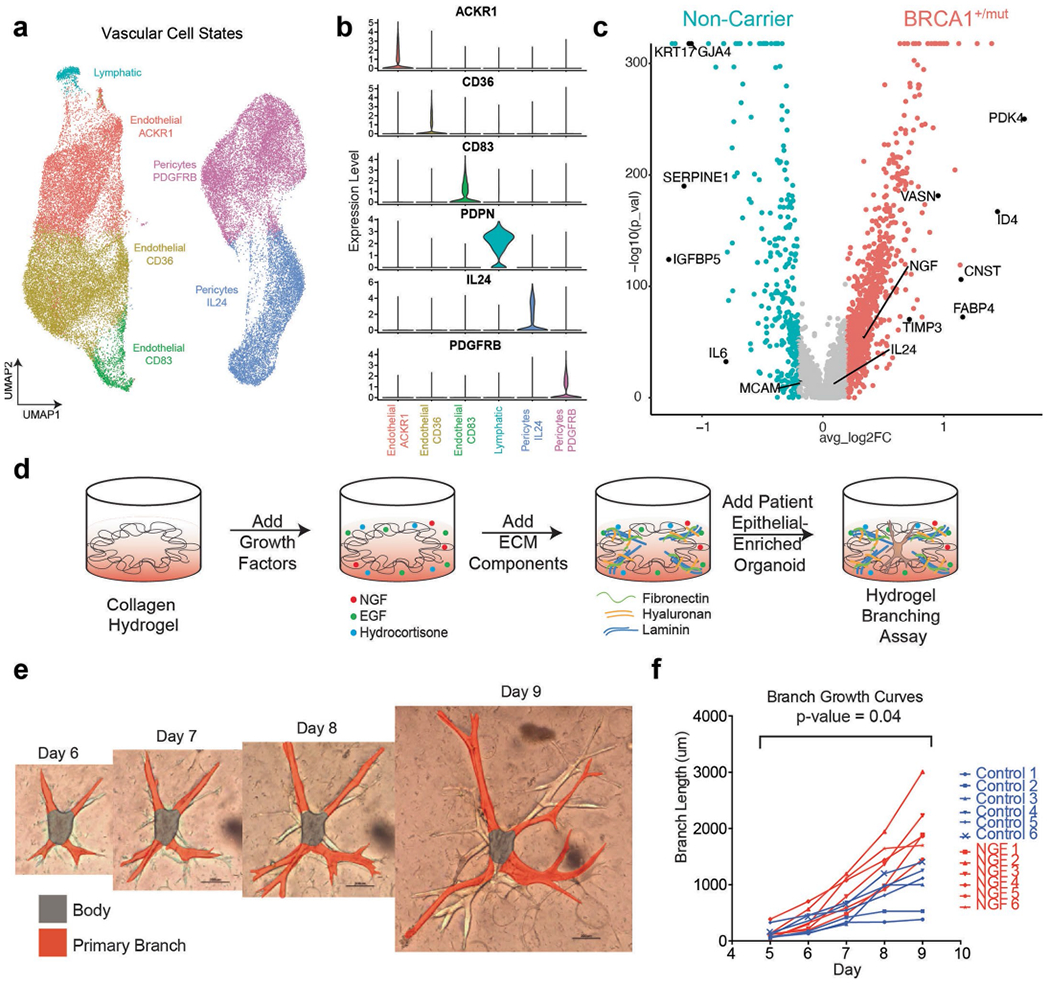
a) UMAP projection of vascular cell states identifying 3 endothelial cell states, 2 pericyte cell states, and lymphatic cells. b) Violin plots of marker genes with enhanced expression in each vascular cell state cluster. c) Volcano plot showing differentially expressed genes between NonCarrier and BRCA1+/mut pericytes, the Wilcoxon rank sum test is used to determine differentially expressed genes, adjusted p values are determined using the Bonferroni method for multiple testing correction. d) Schematic for the generation of hydrogel branching assays. e) Representative images of a BRCA1+/mut organoid in hydrogel branching assay at days 6-9 after seeding. Scale bars = 200 μm. f) Branch growth curves of n = 6 control and n = 6 NGF (100 ng/ml) treated hydrogel branching assay. P value was calculated using CGGC permutation (two-sided) test43.
Extended Data Fig. 8 |. Additional analyses of pre-CAF signature by type of BRCA1 mutation, parity status and using Kaplan–Meier survival analysis in breast cancer.
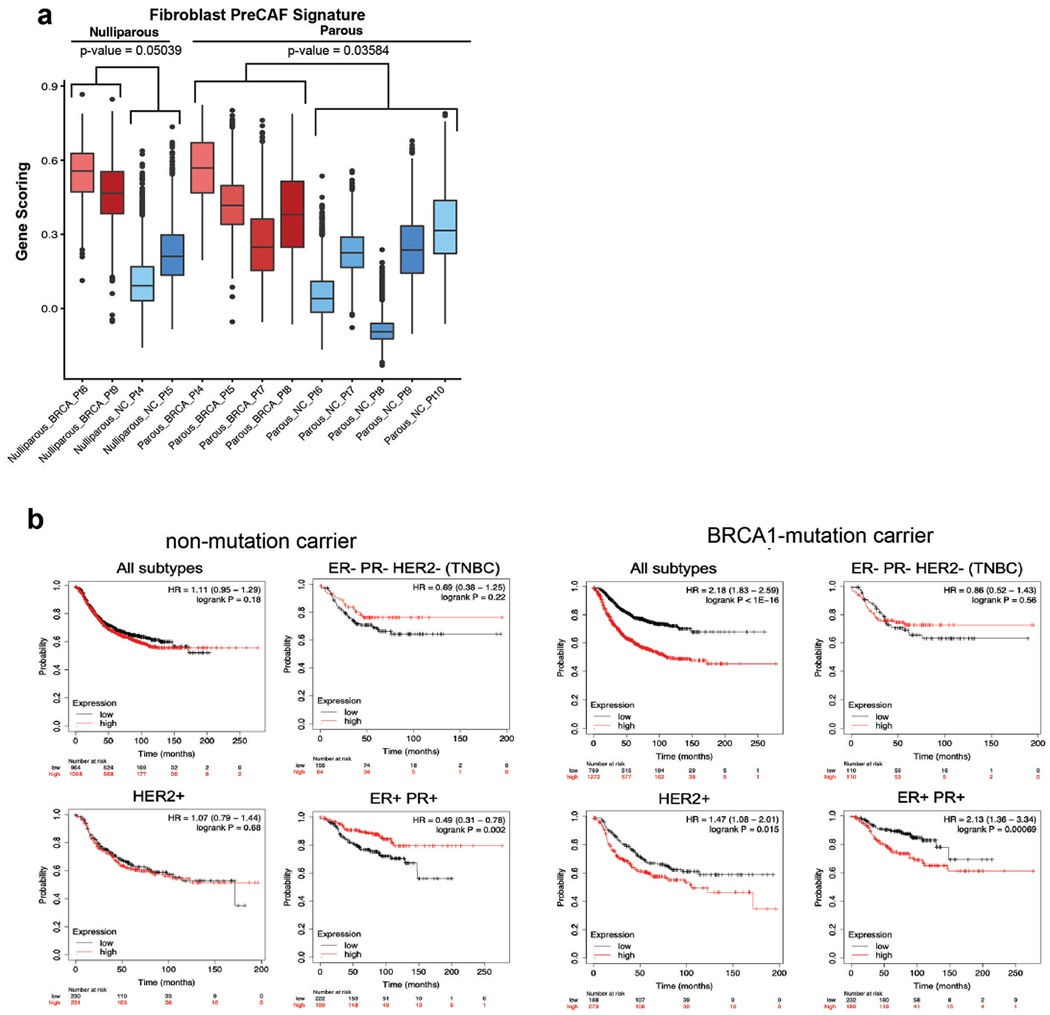
a) Pre-CAF gene signature scoring in fibroblast from nulliparous versus parous NonCarrier and BRCA1+/mut patients. Libraries with representation of less than 250 fibroblasts were excluded. Boxplots indicate median and 25% and 75% quantiles respectively, minima and maxima represent the 10th and 90th percentile respectively, p values were determined by Welch two sample t-test. b) Kaplan–Meier (KM) analyses in breast cancer patients, associating the NonCarrier fibroblast signature (left) or pre-CAF fibroblast signature (right) with overall survival. Auto cutoff was used to group samples into signature low and high. HR hazard ratio. P values were determined by log-rank test. KM plots are shown for breast cancer patients with all subtypes, TNBC (ER-,PR-,HER2-), HER2 + , or ER + PR + breast cancers.
Extended Data Fig. 9 |. Additional data from in situ analysis of MMP3-expressing stromal cells in BRCA1+/mut and NonCarrier samples.
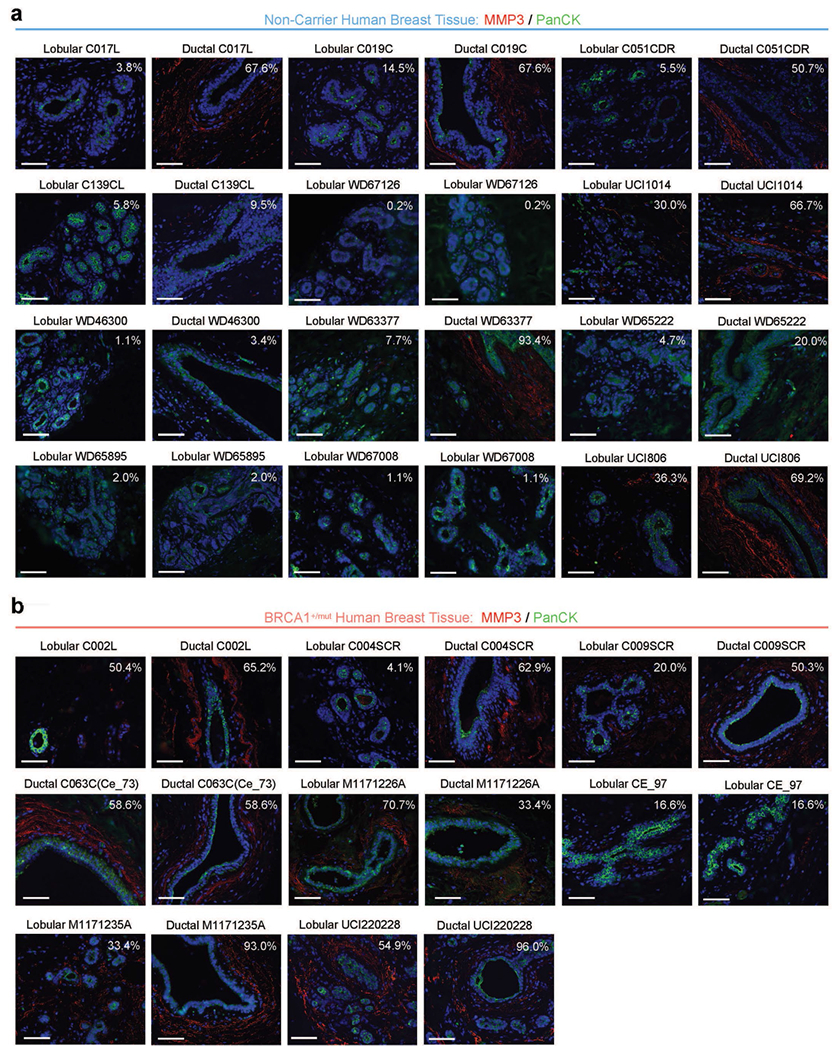
a) Additional representative IF images from ductal and lobular regions in NonCarrier breast tissues stained with anti-MMP3 (red) and anti-PanCK (green) antibodies. DAPI staining is shown in blue. Percentages are indicated of stromal cells that are positive for MMP3. Scale bar = 50 μm. b) Additional representative IF images from ductal and lobular regions in BRCA1+/mut breast tissues stained with anti-MMP3 (red) and anti-PanCK (green) antibodies. DAPI staining is shown in blue. Percentages are indicated of stromal cells that are positive for MMP3. Scale bar = 50 μm.
Extended Data Fig. 10 |. Fibroblast-derived MMP3 promotes epithelial growth in vitro.
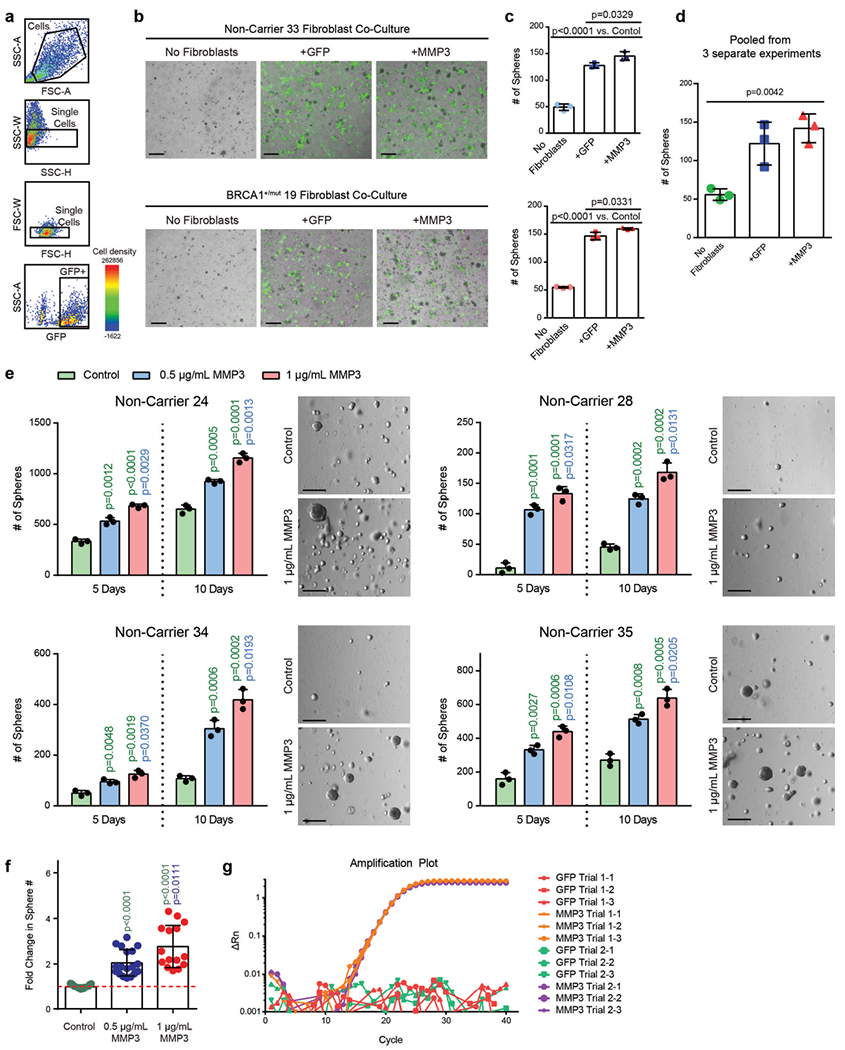
a) FACS plots showing gating strategy for isolation of GFP-transduced human fibroblasts isolated from patient breast tissue in forward and side scatter, singlets gate, and GFP gate. b) Representative images of cocultures after 5 days of seeding. 4000 primary mammary epithelial cells (NonCarrier 32) were cultured alone (No Fibroblasts) or with 1×10⁵ primary mammary fibroblasts (NonCarrier 33 or BRCA1+/mut 19) transduced with lentivirus to express GFP only (+GFP) or GFP and MMP3 ( + MMP3) in Matrigel for 5 days. Fibroblasts are distinguished from epithelial spheres (GFP-negative) with GFP fluorescence. Scale bar = 400 μm. c) Quantification of spheres after 5 days. Values are represented as mean ± SD from 3 separate experiments with 3 triplicate wells per experiment. P values were determined by unpaired two-tailed t-tests. d) Mean values of sphere counts pooled from 3 separate experiments from (c) and Fig. 5c. Values are represented as mean ± SD. Statistical significance between all groups was determined with a one-way ANOVA test. e) 10×105 FACS-isolated epithelial cells from 4 patient samples were seeded in Matrigel and treated with 0.5 μg/mL or 1 μg/mL recombinant MMP3 and spheres were counted after 5 and 10 days. Bar chart values are represented as mean ± SD from triplicates from three separate experiments. P values were determined using unpaired two-tailed t-tests. Representative bright field images of mammospheres after 10 days of culture are shown on the right (scale bar = 400 μm). f) Bar graph depicting fold change in sphere count after 10 days of culture with human recombinant MMP3 compared to control (dotted red line). Values are displayed as mean ± SD from 15 independent experiments (5 different patient samples with 3 separate experiments each). P values were determined using unpaired two-tailed t-tests. g) Primary human breast fibroblasts isolated by FACS from patient sample “NonCarrier 27” were transduced to express mouse MMP3 (mMMP3) and GFP or GFP only. qPCR analysis was performed on transduced fibroblasts in two separate trials with three replicates per group. Amplification plot is shown with the difference in the normalized reporter value of the experimental reaction minus the normalized reporter value generated by the instrument (ΔRn) on the y-axis and the cycle number on the x-axis.
Supplementary Material
Acknowledgements
We thank D. Lawson and X. Dai for carefully reading the manuscript. Thank you to L. Hosohama, S.M.-Q. Nguyen and N.R. James for their assistance on this project. This study was supported by funds from the National Institutes of Health (NIH)/National Cancer Institute (NCI) (1R01CA234496; 4R00CA181490 to K.K., and T32CA009054; T32GM008620; F30CA243419 to K.N.), the American Cancer Society (132551-RSG-18-194-01-DDC to K.K.), the NSF (DMS1763272 to Q.N.), The Simons Foundation (594598 to Q.N.), and a grant from Breast Cancer Research Foundation joint with Jayne Kosinas Ted Giovanis Foundation for Health and Policy (to Q.N.). D.M. was supported by the Canadian Institutes of Health Research Postdoctoral Fellowship, and the NIH/NCI K99/R00 Transition to Independence Award (1K99CA267160-01). S.S. and M.A.L. were supported by the Department of Defense (CDMRP BC181737). M.P. was supported by a fellowship from the CIRM Training Grant (EDUC4-12822). The content is solely the responsibility of the authors and does not necessarily represent the official views of the California Institute for Regenerative Medicine. J.I.R. was supported by a Feodor-Lynen fellowship from the Alexander-von-Humboldt Stiftung. We also wish to acknowledge the support of the Chao Family Comprehensive Cancer Center (CFCCC) at the University of California, Irvine, which is supported by the NIH/NCI (grant P30CA062203). Shared resources utilized through the CFCCC include the Experimental Tissue Resource (ETR) as well as the Optical Biology Core (OBC). Finally, we are grateful to the late Z. Werb for her continuous interest and support of this project.
Footnotes
Online content
Any methods, additional references, Nature Portfolio reporting summaries, source data, extended data, supplementary information, acknowledgements, peer review information; details of author contributions and competing interests; and statements of data and code availability are available at https://doi.org/10.1038/s41588-023-01298-x.
Code availability
No specific code was developed in this study and all data was processed and analyzed using existing code and software whose full details are provided in the Methods section.
Competing interests
All the other authors declare no competing interests.
Supplementary information The online version contains supplementary material available at https://doi.org/10.1038/s41588-023-01298-x.
Data availability
Reagents and resources generated in this study are available upon request. All data are available at Gene Expression Omnibus (GEO) database, including raw fastq files and quantified data matrices under accession code GSE174588. Source data are provided with this paper.
References
- 1.Nguyen QH et al. Profiling human breast epithelial cells using single cell RNA sequencing identifies cell diversity. Nat. Commun 9, 2028 (2018). [DOI] [PMC free article] [PubMed] [Google Scholar]
- 2.Gray GK et al. A human breast atlas integrating single-cell proteomics and transcriptomics. Dev. Cell 57, 1400–1420 (2022). [DOI] [PMC free article] [PubMed] [Google Scholar]
- 3.Pal B et al. A single-cell RNA expression atlas of normal, preneoplastic and tumorigenic states in the human breast. EMBO J. 40, e107333 (2021). [DOI] [PMC free article] [PubMed] [Google Scholar]
- 4.Murrow LM et al. Mapping hormone-regulated cell-cell interaction networks in the human breast at single-cell resolution. Cell Syst. 13, 644–664 (2022). [DOI] [PMC free article] [PubMed] [Google Scholar]
- 5.Wooster R & Weber BL Breast and ovarian cancer. N. Engl. J. Med 348, 2339–2347 (2003). [DOI] [PubMed] [Google Scholar]
- 6.Schlacher K et al. Double-strand break repair-independent role for BRCA2 in blocking stalled replication fork degradation by MRE11. Cell 145, 529–542 (2011). [DOI] [PMC free article] [PubMed] [Google Scholar]
- 7.Proia TA et al. Genetic predisposition directs breast cancer phenotype by dictating progenitor cell fate. Cell Stem Cell 8, 149–163 (2011). [DOI] [PMC free article] [PubMed] [Google Scholar]
- 8.Lim E et al. Aberrant luminal progenitors as the candidate target population for basal tumor development in BRCA1 mutation carriers. Nat. Med 15, 907–913 (2009). [DOI] [PubMed] [Google Scholar]
- 9.Poole AJ et al. Prevention of Brca1-mediated mammary tumorigenesis in mice by a progesterone antagonist. Science 314, 1467–1470 (2006). [DOI] [PubMed] [Google Scholar]
- 10.Pathania S et al. BRCA1 haploinsufficiency for replication stress suppression in primary cells. Nat. Commun 5, 5496 (2014). [DOI] [PMC free article] [PubMed] [Google Scholar]
- 11.Rosen EM BRCA1 in the DNA damage response and at telomeres. Front. Genet 4, 85 (2013). [DOI] [PMC free article] [PubMed] [Google Scholar]
- 12.Molyneux G et al. BRCA1 basal-like breast cancers originate from luminal epithelial progenitors and not from basal stem cells. Cell Stem Cell 7, 403–417 (2010). [DOI] [PubMed] [Google Scholar]
- 13.Sedic M et al. Haploinsufficiency for BRCA1 leads to cell-type-specific genomic instability and premature senescence. Nat. Commun 6, 7505 (2015). [DOI] [PMC free article] [PubMed] [Google Scholar]
- 14.Shalabi SF et al. Evidence for accelerated aging in mammary epithelia of women carrying germline BRCA1 or BRCA2 mutations. Nat. Aging 9, 838–849 (2021). [DOI] [PMC free article] [PubMed] [Google Scholar]
- 15.Fu NY, Nolan E, Lindeman GJ & Visvader JE Stem cells and the differentiation hierarchy in mammary gland development. Physiol. Rev 100, 489–523 (2020). [DOI] [PubMed] [Google Scholar]
- 16.Inman JL, Robertson C, Mott JD & Bissell MJ Mammary gland development: cell fate specification, stem cells and the microenvironment. Development 142, 1028–1042 (2015). [DOI] [PubMed] [Google Scholar]
- 17.Shiga K et al. Cancer-associated fibroblasts: their characteristics and their roles in tumor growth. Cancers 7, 2443–2458 (2015). [DOI] [PMC free article] [PubMed] [Google Scholar]
- 18.Speirs V et al. Short-term primary culture of epithelial cells derived from human breast tumours. Br. J. Cancer 78, 1421–1429 (1998). [DOI] [PMC free article] [PubMed] [Google Scholar]
- 19.Macosko EZ et al. Highly parallel genome-wide expression profiling of individual cells using nanoliter droplets. Cell 161, 1202–1214 (2015). [DOI] [PMC free article] [PubMed] [Google Scholar]
- 20.Crisan M et al. A perivascular origin for mesenchymal stem cells in multiple human organs. Cell Stem Cell 3, 301–313 (2008). [DOI] [PubMed] [Google Scholar]
- 21.Armulik A, Genove G & Betsholtz C Pericytes: developmental, physiological and pathological perspectives, problems and promises. Dev. Cell 21, 193–215 (2011). [DOI] [PubMed] [Google Scholar]
- 22.Denu RA et al. Fibroblasts and mesenchymal stromal/stem cells are phenotypically indistinguishable. Acta Haematol. 136, 85–97 (2016). [DOI] [PMC free article] [PubMed] [Google Scholar]
- 23.Sahai E et al. A framework for advancing our understanding of cancer-associated fibroblasts. Nat. Rev. Cancer 20, 174–186 (2020). [DOI] [PMC free article] [PubMed] [Google Scholar]
- 24.Agajanian M, Runa F & Kelber JA Identification of a PEAK1/ZEB1 signaling axis during TGFβ/fibronectin-induced EMT in breast cancer. Biochem. Biophys. Res. Commun 465, 606–612 (2015). [DOI] [PubMed] [Google Scholar]
- 25.Jin S, MacLean AL, Peng T & Nie Q scEpath: energy landscape-based inference of transition probabilities and cellular trajectories from single-cell transcriptomic data. Bioinformatics 34, 2077–2086 (2018). [DOI] [PMC free article] [PubMed] [Google Scholar]
- 26.Tirosh I et al. Dissecting the multicellular ecosystem of metastatic melanoma by single-cell RNA-seq. Science 352, 189–196 (2016). [DOI] [PMC free article] [PubMed] [Google Scholar]
- 27.Giulianelli S et al. FGF2 induces breast cancer growth through ligand-independent activation and recruitment of ERα and PRBΔ4 isoform to MYC regulatory sequences. Int. J. Cancer 145, 1874–1888 (2019). [DOI] [PubMed] [Google Scholar]
- 28.Matsumoto K, Umitsu M, De Silva DM, Roy A & Bottaro DP Hepatocyte growth factor/MET in cancer progression and biomarker discovery. Cancer Sci. 108, 296–307 (2017). [DOI] [PMC free article] [PubMed] [Google Scholar]
- 29.Descamps S et al. Nerve growth factor stimulates proliferation and survival of human breast cancer cells through two distinct signaling pathways. J. Biol. Chem 276, 17864–17870 (2001). [DOI] [PubMed] [Google Scholar]
- 30.Lyu S, Jiang C, Xu R, Huang Y & Yan S INHBA upregulation correlates with poorer prognosis in patients with esophageal squamous cell carcinoma. Cancer Manag. Res. 10, 1586–1596 (2018). [DOI] [PMC free article] [PubMed] [Google Scholar]
- 31.Kessenbrock K et al. A role for matrix metalloproteinases in regulating mammary stem cell function via the Wnt signaling pathway. Cell Stem Cell 13, 300–313 (2013). [DOI] [PMC free article] [PubMed] [Google Scholar]
- 32.Macias H & Hinck L Mammary gland development. Wiley Interdiscip. Rev. Dev. Biol 1, 533–557 (2012). [DOI] [PMC free article] [PubMed] [Google Scholar]
- 33.Sokol ES et al. Growth of human breast tissues from patient cells in 3D hydrogel scaffolds. Breast Cancer Res. 18, 19 (2016). [DOI] [PMC free article] [PubMed] [Google Scholar]
- 34.Puram SV et al. Single-cell transcriptomic analysis of primary and metastatic tumor ecosystems in head and neck cancer. Cell 171, 1611–1624 (2017). [DOI] [PMC free article] [PubMed] [Google Scholar]
- 35.Kieffer Y et al. Single-cell analysis reveals fibroblast clusters linked to immunotherapy resistance in cancer. Cancer Discov. 10, 1330–1351 (2020). [DOI] [PubMed] [Google Scholar]
- 36.Sternlicht MD et al. The stromal proteinase MMP3/stromelysin-1 promotes mammary carcinogenesis. Cell 98, 137–146 (1999). [DOI] [PMC free article] [PubMed] [Google Scholar]
- 37.Parrinello S, Coppe JP, Krtolica A & Campisi J Stromal-epithelial interactions in aging and cancer: senescent fibroblasts alter epithelial cell differentiation. J. Cell Sci 118, 485–496 (2005). [DOI] [PMC free article] [PubMed] [Google Scholar]
- 38.Radisky DC et al. Rac1b and reactive oxygen species mediate MMP-3-induced EMT and genomic instability. Nature 436, 123–127 (2005). [DOI] [PMC free article] [PubMed] [Google Scholar]
- 39.Konishi H. et al. Mutation of a single allele of the cancer susceptibility gene BRCA1 leads to genomic instability in human breast epithelial cells. Proc. Natl Acad. Sci. USA 108, 17773–17778 (2011). [DOI] [PMC free article] [PubMed] [Google Scholar]
- 40.Ferlic J, Shi J, McDonald TO & Michor F DIFFpop: a stochastic computational approach to simulate differentiation hierarchies with single cell barcoding. Bioinformatics 35, 3849–3851 (2019). [DOI] [PMC free article] [PubMed] [Google Scholar]
- 41.Eyre-Walker A & Keightley PD The distribution of fitness effects of new mutations. Nat. Rev. Genet 8, 610–618 (2007). [DOI] [PubMed] [Google Scholar]
- 42.Foo J, Leder K & Michor F Stochastic dynamics of cancer initiation. Phys. Biol 8, 015002 (2011). [DOI] [PMC free article] [PubMed] [Google Scholar]
- 43.Pal B. et al. A single-cell RNA expression atlas of normal, preneoplastic and tumorigenic states in the human breast. EMBO J. 40, e107333 (2021). [DOI] [PMC free article] [PubMed] [Google Scholar]
- 44.Hu L. et al. Single-cell RNA sequencing reveals the cellular origin and evolution of breast cancer in BRCA1 mutation carriers. Cancer Res. 81, 2600–2611 (2021). [DOI] [PubMed] [Google Scholar]
- 45.Bach K. et al. Time-resolved single-cell analysis of Brca1 associated mammary tumourigenesis reveals aberrant differentiation of luminal progenitors. Nat. Commun 12, 1502 (2021). [DOI] [PMC free article] [PubMed] [Google Scholar]
- 46.Coussens LM, Fingleton B & Matrisian LM Matrix metalloproteinase inhibitors and cancer: trials and tribulations. Science 295, 2387–2392 (2002). [DOI] [PubMed] [Google Scholar]
- 47.Stuart T & Satija R Integrative single-cell analysis. Nat. Rev. Genet 20, 257–272 (2019). [DOI] [PubMed] [Google Scholar]
- 48.Skelly DA et al. Single-cell transcriptional profiling reveals cellular diversity and intercommunication in the mouse heart. Cell Rep. 22, 600–610 (2018). [DOI] [PubMed] [Google Scholar]
- 49.Ramilowski JA et al. A draft network of ligand–receptor-mediated multicellular signalling in human. Nat. Commun 6, 7866 (2015). [DOI] [PMC free article] [PubMed] [Google Scholar]
- 50.Kuleshov MV et al. Enrichr: a comprehensive gene set enrichment analysis web server 2016 update. Nucleic Acids Res. 44, 90–97 (2016). [DOI] [PMC free article] [PubMed] [Google Scholar]
- 51.Elso CM et al. Leishmaniasis host response loci (lmr1-3) modify disease severity through a Th1/Th2-independent pathway. Genes Immun. 5, 93–100 (2004). [DOI] [PubMed] [Google Scholar]
Associated Data
This section collects any data citations, data availability statements, or supplementary materials included in this article.
Supplementary Materials
Data Availability Statement
Reagents and resources generated in this study are available upon request. All data are available at Gene Expression Omnibus (GEO) database, including raw fastq files and quantified data matrices under accession code GSE174588. Source data are provided with this paper.


