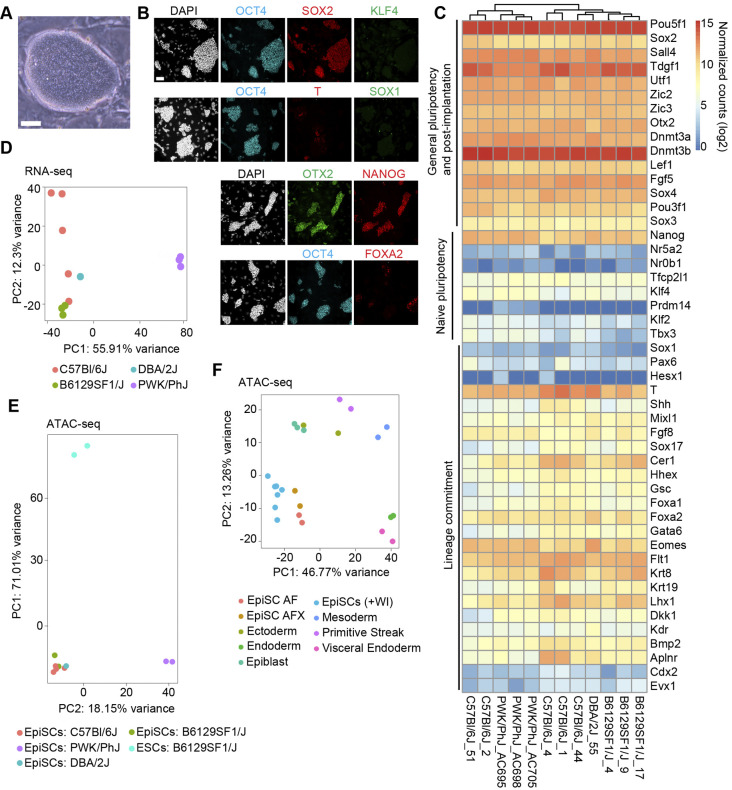
Fig. 1.
Derivation and characterization of mouse EpiSCs cultured in primed ground state conditions. (A) Phase-contrast image of an EpiSC (+WI) colony. Scale bar: 50 μm. (B) Immunofluorescence images of EpiSC (+WI) cultures showing markers of general pluripotency (SOX2, OCT4), primed pluripotency (OTX2), naive pluripotency (KFL4, NANOG) and lineage commitment (T, FOXA2, SOX1). Scale bar: 50 μm. (C) Gene expression heatmap of RNA-seq data from EpiSC (+WI) lines (n=12; biological replicates derived from distinct naïve mouse ESC lines) for selected genes associated with pluripotency and lineage commitment. (D) PCA plot of RNA-seq data (biological replicates; C57Bl/6J=5, B6129SF1/J=3, PWK/PhJ=3, DBA/2J=1) for EpiSC (+WI) lines. (E) ATAC-seq data (n=9 biological replicates; C57Bl/6J=3, B6129SF1/J=2, PWK/PhJ=3, DBA/2J=1) for EpiSC (+WI) and ESC lines (n=2; B6129SF1/J). (F) PCA plot of ATAC-seq data for EpiSC (+WI) lines (biological replicates; C57Bl/6J=4, PWK/PhJ=2, DBA/2J=1; all shown as light blue). For comparison, ATAC-seq data from an additional set of EpiSC lines EpiSC-AF (cultured with activin A and FGF2) and EpiSC-AFX (cultured with activin A, FGF2 and the Wnt inhibitor XAV939) (taken from Kinoshita et al., 2021) and from early embryonic lineages in vivo (E6.5 epiblast, E6.5 visceral endoderm, E7.5 ectoderm, E7.5 mesoderm, E7.5 endoderm, E7.5 primitive streak (taken from Xiang et al., 2020).

