Abstract
This cross-sectional study examines denials of Medicaid and Children’s Health Insurance Program coverage due to procedural reasons.
Introduction
Medicaid enrollment exceeded 93 million people during the COVID-19 pandemic, largely due to the Families First Coronavirus Response Act, which incentivized states to pause redeterminations of Medicaid eligibility.1,2,3 In April 2023, states could resume redeterminations, with estimates suggesting 17.4% of enrollees are at risk of losing coverage.4 Millions are projected to lose coverage for solely procedural reasons (eg, after missing a required renewal form following a change in address) despite remaining eligible.4 Coverage losses have been associated with reduced use of preventive care and worsened health outcomes.5
In this cross-sectional study, we describe the prevalence of procedural denials of coverage in Medicaid and the Children’s Health Insurance Program (CHIP) across states in 2019, before the pause on redeterminations. We also evaluate the association between rates of procedural denials and states’ renewal processes to determine whether states’ upstream operational investments may protect against high denial rates.
Methods
Data were obtained via a Freedom of Information Act Request for the Centers for Medicare & Medicaid Services (CMS) Medicaid and CHIP Eligibility and Enrollment Performance Indicators data set for calendar year 2019. We calculated the rate of procedural denials in each state as the proportion of total eligibility determinations in which individuals were deemed ineligible for Medicaid or CHIP because they “failed to complete or return renewal forms or other required documentation, or … were lost to follow up.”6 We also calculated the proportion of eligibility determinations for renewals vs new applications. We limited analysis to states with at least 6 months of data for these 2 measures in 2019 that CMS had not flagged for data quality concerns. This study followed the STROBE reporting guideline and was deemed not human participants’ research by the institutional review board at Weill Cornell Medical College.
We visualized mean rates of procedural denials across states for Medicaid and CHIP. We then used scatterplots and Wilcoxon rank sum tests to examine the association between procedural denial rates and 2 measures of states’ renewal processes in 2019—rates of automated renewals and use of renewal forms prepopulated with updated enrollee information—obtained from KFF.7 Analyses were performed using Stata, version 16 (StataCorp). With 2-sided testing, P < .05 was considered statistically significant. eMethods in Supplement 1 provides further details.
Results
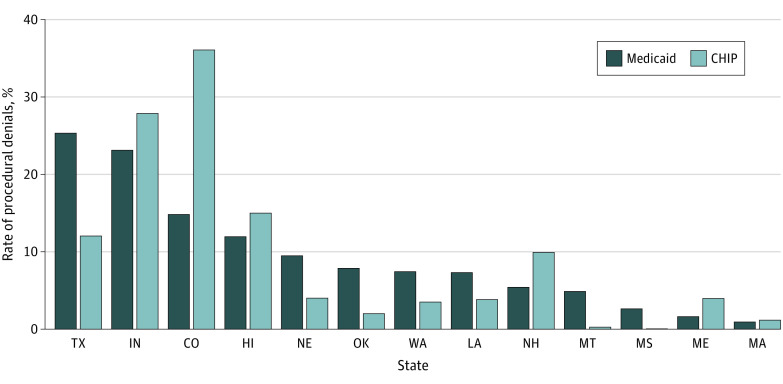
Only 13 states (comprising 20.0% of enrollees nationally) had sufficient data quality for inclusion. Among those states, most eligibility determinations involved renewals rather than new applications (median, 71.4% [IQR, 50.9%-83.1%]). Rates of procedural denials in Medicaid ranged from 0.9% to 25.4% (median, 7.4% [IQR, 4.9%-11.9%]); rates in CHIP ranged from 0.04% to 36.1% (median, 4.0% [IQR, 2.0%-12.0%]) (Figure 1).
Figure 1. Procedural Denial Rates in Medicaid and Children’s Health Insurance Program (CHIP) Across States, 2019.
State rank ordered by rate of procedural denials in Medicaid.
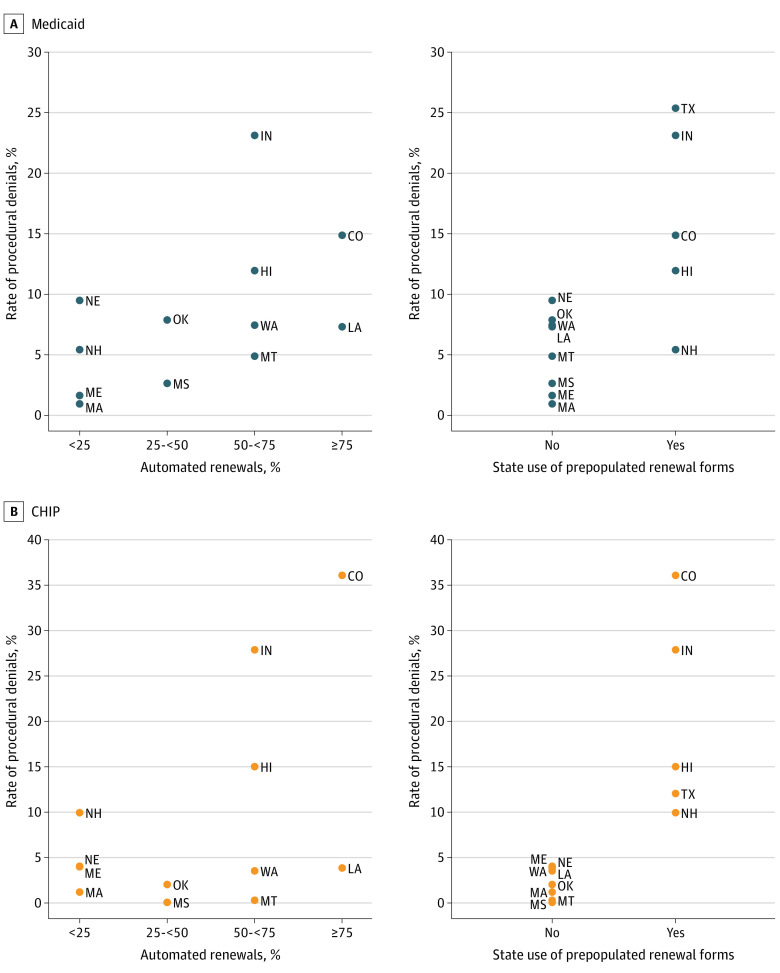
Median rate of procedural denials for Medicaid was 11.1% (IQR, 7.3%-14.9%) in states that automated 75% or more of renewals vs 3.5% (IQR, 1.3%-7.4%) in states that automated less than 25% of renewals, but the difference was not statistically significant (P = .16) (Figure 2A). Rates were significantly higher in states that used prepopulated and updated renewal forms (median, 14.9% [IRQ, 11.9%-23.2%]) compared with rates in states that did not (median, 6.1% [IQR, 2.1%-7.7%]) (P = .02). Similar associations were evident in CHIP (Figure 2B).
Figure 2. Association Between States’ Procedural Denial Rates in Medicaid and Children’s Health Insurance Program (CHIP) and Renewal Processes, 2019.
Automated renewals data not available for Texas.
Discussion
We found few states reported high-quality data on procedural denials before the COVID-19 pandemic. Among reporting states, there was wide variation; in certain states, more than 1 in 4 Medicaid determinations and 1 in 3 CHIP determinations resulted in ineligibility solely for procedural reasons; in others, procedural denials were close to 0. Procedural denials were higher in some states that had invested in processes designed to improve the renewal process, suggesting that these processes alone may be insufficient to protect against high denial rates.
This study was limited to a small subset of states due to data quality concerns in the remainder. We were also unable to separately examine denials for renewals vs new applications. These limitations highlight the need for CMS to work with states to improve quality and availability of data on determinations—and procedural denials, specifically—to monitor for potentially inappropriate denials of coverage and to enable corrective action, if necessary.
eMethods
Data Sharing Statement
References
- 1.Medicaid.gov. June 2023 Medicaid & CHIP Enrollment Data Highlights. June 2023. Accessed May 2, 2023. https://www.medicaid.gov/medicaid/program-information/medicaid-and-chip-enrollment-data/report-highlights/index.html
- 2.Dague L, Badaracco N, DeLeire T, Sydnor J, Tilhou AS, Friedsam D. Trends in Medicaid enrollment and disenrollment during the early phase of the COVID-19 pandemic in Wisconsin. JAMA Health Forum. 2022;3(2):e214752. doi: 10.1001/jamahealthforum.2021.4752 [DOI] [PMC free article] [PubMed] [Google Scholar]
- 3.Schpero WL, Ndumele CD. Medicaid disenrollment after the COVID-19 pandemic: avoiding a new crisis. JAMA Health Forum. 2022;3(2):e214743. doi: 10.1001/jamahealthforum.2021.4743 [DOI] [PubMed] [Google Scholar]
- 4.Assistant Secretary for Planning and Evaluation. Unwinding the Medicaid continuous enrollment provision: projected enrollment effects and policy approaches. August 19, 2022. Accessed May 2, 2023. https://aspe.hhs.gov/reports/unwinding-medicaid-continuous-enrollment-provision [PubMed]
- 5.Tello-Trillo DS. Effects of losing public health insurance on preventative care, health, and emergency department use: evidence from the TennCare disenrollment. South Econ J. 2021;88(1):322-366. doi: 10.1002/soej.12504 [DOI] [Google Scholar]
- 6.Medicaid and CHIP eligibility and enrollment performance indicators: data dictionary. Centers for Medicare and Medicaid Services. May 20, 2014. Accessed May 2, 2023. https://www.medicaid.gov/sites/default/files/2023-01/performance-indicators-datadictionary.pdf
- 7.Brooks T, Roygardner L, Artiga S. Medicaid and CHIP eligibility, enrollment, and cost sharing policies as of January 2019: findings from a 50-state survey. KFF. March 2019. Accessed May 2, 2023. https://files.kff.org/attachment/Report-Medicaid-and-CHIP-Eligibility-Enrollment-Renewal-and-Cost-Sharing-Policies-as-of-January-2019
Associated Data
This section collects any data citations, data availability statements, or supplementary materials included in this article.
Supplementary Materials
eMethods
Data Sharing Statement


