

Abstract
Adipocytes are critical for ovarian cancer (OvCa) cells to home to the omentum, but the metabolic changes initiated by this interaction are unknown. To this end, we carried out unbiased mass spectrometry-based metabolomic and proteomic profiling of cancer cells co-cultured with primary human omental adipocytes. Cancer cells underwent significant proteo-metabolomic alteration(s), typified by changes in the lipidome with corresponding upregulation of lipid metabolism proteins. FABP4, a lipid chaperone protein, was identified as the critical regulator of lipid responses in OvCa cells co-cultured with adipocytes. Subsequently, knockdown of FABP4 resulted in increased 5-hydroxymethylcytosine levels in the DNA, downregulation of gene signatures associated with OvCa metastasis and reduced clonogenic cancer cell survival. In addition, CRISPR-mediated knockout of FABP4 in high-grade serous OvCa cells reduced metastatic tumor burden in mice. Consequently, a small molecule inhibitor of FABP4 (BMS309403) not only significantly reduced tumor burden in a syngeneic orthotopic mouse model but also increased the sensitivity of cancer cells towards carboplatin both in vitro and in vivo. Taken together, these results show that targeting FABP4 in OvCa cells can inhibit their ability to adapt and colonize lipid-rich tumor microenvironments, providing an opportunity for specific metabolic targeting of OvCa metastasis.
Introduction
Peritoneal metastasis is a characteristic feature of epithelial ovarian cancers (OvCa) (1), and the primary site of metastasis is the omentum, a hormonally active fat pad of 20×15×3cm size that protects the small and large bowel (2). While the origin of OvCa is not certain, there is increasing evidence that transformed cells originating from the distal end of the fallopian tube or the surface epithelium of the ovary undergo an epithelial to mesenchymal transition (EMT), detach, and readily spread throughout the abdominal cavity (1,2). We have previously shown that - OvCa cells preferentially home to the omentum, guided by secreted factors such as IL6, IL8, and MCP1 (3). In addition, cancer cells with an active ERBB3-NGR1 axis are capable of colonizing the omentum via intravasation from the primary site (4). Irrespective of the mode of transmission, omental colonization marks an essential step in disease progression and in certain cases might even contribute to secondary metastasis (5).
Adipocytes, the major cell type of the omentum play an essential role in maintaining its tissue architecture and endocrine functions. Once cancer cells colonize the omentum, they initiate lipolytic signals in omental adipocytes, resulting in the release of long chain fatty acids (3). Subsequently, the cancer cells take up the adipocyte-derived lipids through the CD36 receptor (6). It is unclear which lipid species are affected by the cancer cell – adipocyte interactions. In addition, the effect that these lipids have on cancer cell lipidome and the mechanism by which these lipids are metabolized are still not known.
FABPs are a family of intracellular lipid chaperones (7) that coordinate cellular lipid responses in cells by binding to and redistributing intracellular fatty acids (FA). FABP4 is primarily expressed in adipocytes and macrophages and contributes to obesity-induced insulin resistance (8–10). Moreover, circulating FABP4 has also been found to regulate systemic glucose levels in mice (11) and is a marker of preclinical metabolic syndrome in humans (12). Hence, it is evident that FABP4 is inherently linked to both cellular and systemic metabolic processes.
Cancer cells engage in specific bidirectional communication with the surrounding tumor stroma, which affects their metabolism in the tumor microenvironment (13). While the metabolic consequences of fibroblast/cancer cell interactions have been studied (14–16), less is known about how the interaction of cancer cells with adipocytes affects global metabolism in cancer cells. This knowledge is important for understanding ovarian cancer metastasis since cancer cells in all patients with advanced or recurrent disease invade adipose-rich tissue such as the omentum, the bowel mesentery, and the fat appendages (“appendices epiploicae”) along the large bowel.
We have characterized the altered proteome and metabolome of ovarian cancer cells following adipocyte co-culture and report that FABP4 regulated metabolic changes are essential for cancer cells to adapt to lipid-rich microenvironments. Furthermore, targeting FABP4 in cancer cells reduced omental metastasis and sensitized tumor cells to platinum chemotherapy.
Materials and Methods
Cell lines and Reagents
SKOV3ip1 and HeyA8 cells were a gift from Dr. Gordon Mills and 293T cells were received from Dr. L. Godley (University of Chicago). OVCAR5, OVCAR8 and CAOV3 cells were purchased from American Type Culture Collection. These cell lines were grown in Dulbecco’s modified Eagle’s media (DMEM) supplemented with 10% fetal bovine serum (FBS), 100 U/ml penicillin, 100 μg/ml streptomycin and 1% non-essential amino acids and vitamins (NEAA and Vit). PE01 and PE04 cells (obtained from Scott Kauffman, Mayo Clinic, Rochester, Minnesota) were maintained in DMEM, and were grown according to recommended culture conditions. ID8 cells (obtained from Dr. Katherine Roby, University of Kansas Medical Center, Kansas City, KS) were maintained as described in (3). The cells lines were regularly tested for mycoplasma and genotyped (IDEXX Bioresearch short tandem repeat marker profiling) to determine authenticity.
Animal experiments
Xenograft experiment (Fig. 5C) was conducted using female immunocompromised athymic nude mice (Envigo) and syngeneic experiments were carried out using female C57/Bl6 mice (Envigo). OVCAR8 derived control CRISPR and FABP4 CRISPR cells were injected intraperitoneally (5 million cells/mouse) and tumor burden assessed after 44 days (ten mice/group). ID8 cells were injected intraperitoneally (5 million cells/mouse) or intrabursally (1 million cells/mouse) and tumor burden assessed after 66 days or 88 days respectively. Carboplatin treatments (administered intraperitoneally) were carried out once a week for 4 weeks at a concentration of 30mg/kg and FABP4 inhibitor (BMS309403) was delivered orally six days a week for 4 weeks at a concentration of 20mg/kg. BMS309403 compound was dissolved using the vehicle (5% ethanol, 10% 1-methyl-2-pyrrolidone, 5% cremophor EL and 80% water) for oral gavage. Tumor burden was determined by counting metastatic lesions, omental weight, and total metastatic tumor weight.
Figure 5. FABP4 promotes proliferation and in vivo metastasis.

(A) Ingenuity Pathway Analysis. Microarray analysis of FABP4 knock down SKOV3ip1 cells (control, scrambled shRNA) was performed (Illumina) and differentially expressed genes entered into pathway analysis software. Shown is the regulator effect analysis describing upstream signaling and downstream processes. (B) Colony formation assays after stable knock down of FABP4 in SKOV3ip1, and OVCAR5, parental cells. (C) Intraperitoneal xenograft tumor formation in nude mice using CRISPR knockout clones of FABP4 in OVCAR8 cells. Yellow lines highlight omental tumor, while black and green rectangles represent peritoneal and mesenteric metastasis, respectively. Number of metastasis and total weight of all metastases are shown (mean ± SEM). (D) Immunohistochemistry for 5-hydroxymethylcytosine (5-hmc) carried out on omental mouse tumors represented in panel C (mean ± SEM). Scale bar 100 μm (** p < .005, *** p ≤ 0.001, **** p < 0.0001).
Metabolomic analysis
Freshly isolated human omental adipocytes were co-cultured with SKOV3ip1 cells for 4hr and 18hr (1:5 PCV, adipocytes: SFM). For the 4hr time point, adipocytes were isolated from seven donors. For the 18hr time point, adipocytes from six donors were used for co-culture with SKOV3ip1. Post co-culture, adipocytes were removed and cancer cells washed with phosphate buffered saline (PBS) several times to remove any remaining adipocytes. Cancer cells were then trypsinized and an equal number of cells were frozen for metabolomic analysis at Metabolon. Metabolites were extracted as per established protocols at Metabolon and metabolite identification was carried out using a Thermo-Finnigan Trace DSQ fast-scanning single-quadrupole gas chromatography/mass spectrometer (GC/MS) and Waters ACQUITY UPLC and a Thermo-Finnigan LTQ liquid chromatography/mass spectrometry (LC/MS) setup. Paired t-test was carried out to determine statistical significance and altered metabolites between experimental groups with a p-value < 0.05 and q < 0.05 were considered significant. Metabolomics on FABP4 shRNA cells was carried out by co-culturing cells with omental adipocytes isolated from seven donors. Samples were isolated as described above and untargeted analysis was carried out using both GC/MS and LC/MS platforms at the West Coast Metabolomics Center (17,18). Statistically significant metabolites (p < 0.05) altered between experimental groups were identified using repeated measures t-test, and the biochemical similarities between them were depicted as a network map using Cytoscape 2.0.
Proteomic analysis
After co-culture with adipocytes for 4hr (as described above), cancer cells were trypsinized and frozen. Sample preparation and mass spectrometry were carried out as described by us (19,20). Shotgun proteomics was carried out using a Q Exactive (Thermo Fisher Scientific, Rockford, IL) connected to EASY-nLC 1000 HPLC system (Thermo Fisher Scientific). Columns (75 mm inner diameter, 50 cm length) were in-house packed with 1.9 μm C18 particles (Dr. Maisch GmbH, Germany). Peptides were separated over a 250 min gradient from 2% to 60% (5 min to 5%, 180 min to 25%, 45min to 35%, 20min to 60%) in buffer B (80% acetonitrile, 0.5% formic acid) at 200 nl/min. The five most intense precursors were subjected to high-energy collisional dissociation fragmentation at a normalized collision energy of 25, an isolation window of 2.2 Th, and a resolution of 17,500 at m/z 200. For survey scans, ion injections times were set to 20 ms (target value 3E6) and 120 ms (target value 1E5) for MS/MS scans. Raw data was analyzed using MaxQuant software (version 1.5.0.38) and statistical analysis was performed using Perseus (20,21). A t-test was carried out to determine statistical significance and a p-value of < 0.05 and false discovery rate q < 0.05 was considered significant.
Microarray and Intellectual Pathway Analysis (IPA)
Microarray analysis was performed at the University of Chicago Functional Genomics Core Facility as described previously (6), using Illumina HumanHT-12_V4 Expression BeadChip microarray (Illumina, San Diego, CA). Total RNA was isolated from of SKOV3ip1 cells transduced with control shRNA and FABP4 shRNA, using an RNeasy kit (Qiagen), after column DNase treatment, (RNase Free DNase set (Qiagen). RNA quality and integrity were analyzed using Agilent 2100 Bioanalyzer (Agilent Technologies, Inc., Santa Clara, CA) and biotinylated cRNA was generated using Illumina Total Prep RNA Amplification Kit (Ambion, Inc., Austin, TX). Following hybridization, arrays were scanned on an Illumina’s BeadStation 500GX Genetic Analysis System and data extracted using GenomeStudio Software (v2011.1, Illumina). Three replicates were analyzed per experimental groups. Differentially expressed genes (DEG), with a q value of < 0.05 and fold change value > 1.5, were used for IPA analysis to identify altered canonical pathways and explore the impact of gene networks on cellular processes.
Thiobarbituric acid reactive substance assay
Lipid peroxidation was estimated by quantitating malondialdehyde (MDA) levels in cancer cells using Thiobarbituric Acid assay kit (Cayman, Ann Arbor, MI) (6). Cancer cells co-cultured with adipocytes (1:5 PCV adipocytes: SFM) were sonicated and boiled for 10 min following the addition of sodium dodecyl sulfate (SDS) and TBARS color reagent. Samples were transferred onto a black-walled 96-well plate and fluorescence was read at excitation 530 nm and emission 550 nm using Spectra max i3 (Molecular Probes, San Jose, CA).
Neutral lipid staining
Cells were treated with adipocyte conditioned media (Adi CM) for 24hr, following which they were stained using BODIPY 493/503 (5 μg/ml). Cells were subsequently fixed using 4% paraformaldehyde and imaged using a Zeiss 510 confocal microscope (6).
Fatty acid oxidation
Fatty acid β-oxidation in cancer cells was determined as described before (3,6). Briefly, cancer cells were co-cultured with adipocytes (1:4 packed cell volume, adipocyte: media) for 24 hr. Adipocytes were removed and cancer cells were washed with PBS. The cancer cells were then incubated with bovine serum albumin conjugated [3H]-palmitate for 3hr, following which supernatant was collected and 3H2O eluted out using Dowex-1X8 ion exchange resin (Thermo-Fisher Scientific). Samples were then mixed with 5ml scintillation fluid (Scintiverse, Thermo-Fisher) and radioactivity was determined as counts per minute.
Bioenergetics assays: Glycolysis and oxidative phosphorylation
Cellular glycolytic rate and mitochondrial oxidation of glucose were determined as extracellular acidification rate (ECAR) and oxygen consumption rate (OCR) respectively, using Seahorse XFe analyzer (Agilent, Santa Clara, CA) (16). Cancer cells (with stable knockdown or overexpression of FABP4) were plated in 96-well Seahorse plates (10,000 cells/well) and allowed to attach. For ECAR analysis, media was removed from cells and replaced with DMEM (D5030, Sigma-Aldrich) supplemented with glutamine (2 mM, Corning, NY), pH adjusted to 7.4. After incubation of the cells in a non-CO2 incubator for 1hr, ECAR was determined following sequential injection of glucose (10mM, Sigma-Aldrich), Oligomycin (2 μM, Sigma-Aldrich), 2-deoxyglucose (50 mM, Sigma-Aldrich). For OCR analysis, media was replaced with Seahorse DMEM base media (Agilent, Santa Clara, CA), supplemented with sodium pyruvate (1mM, Corning, NY), glucose (25mM, Sigma-Aldrich), glutamine (2 mM, Corning, NY) and pH adjusted to 7.4. OCR was measured after sequential injection with Oligomycin (1 μM, Sigma-Aldrich), FCCP (1 μM, Sigma-Aldrich), Antimycin A (1 μM, Sigma-Aldrich), Rotenone (1 μM, Sigma-Aldrich). Background corrected rate data was plotted to determine ECAR and OCR changes associated with FABP4.
5-hydroxymethylcytosine detection by DNA dot-blot
5μg genomic DNA isolated using Wizard Genomic DNA isolation kit (Promega), was spotted on positively charged nylon membrane (Amersham, GE life sciences) using a 96-well dot-blot apparatus (Bio-Rad) (20,22). DNA was cross-linked using Stratagene stratalinker 1800 and standard immunoblotting carried out using 1:1000 dilution of anti 5-hydroxymethylcytosine antibody (A-1018, Epigentek). Total DNA was stained by using 0.04% methylene blue in 0.5M acetic acid solution and image using G: Box XT4 (Syngene).
Omental explant assay
Omental biopsies were made using 10 mm punch biopsies (0.3g), four per treatment group (DMSO or BMS309403) and placed in ultralow attachment 24 well plates (23). One million GFP labeled HeyA8 and SKOv3ip1 cells were then added to each biopsy and growth of cancer cells was imaged using Nikon eclipse Ti2 microscope using a 4x objective after 72hr culture. Cells were released from the tissues using Trypsin and fluorescence intensity of total cells isolate was measured using Spectra max i3 (Molecular Devices).
Study approval
All patient samples were collected at the University of Chicago Medical Center following approval from the Institutional review board, and after written informed consent from the patients. All animal experiments were carried out in accordance with approved protocols by the Institutional Animal Care and Use Committee, at the University of Chicago.
Statistics
Graph Pad Prism 7 software was used to calculate statistical significance, unless otherwise stated. Data are presented as mean ± SEM and 2 tailed students t-test was used to determine statistical significance and a value less than 0.05 was considered significant. Perseus software (21) was used to identify proteins with significantly altered expression. A t-test was carried out to determine statistical significance and a p-value of < 0.05 and false discovery rate q < 0.05 was considered significant. For metabolomic analyses a paired t-test was carried out and metabolites with a p-value of < 0.5 were considered significantly changed.
Results
Adipocytes alter global lipid metabolism in cancer cells
We carried out global untargeted metabolomics to understand the effect of human primary omental adipocytes (HPA) on the ovarian cancer cell metabolome. The OvCa cells were co-cultured with HPA for 4 and 18hrs to determine early and late metabolic alterations, respectively. Cancer cells were separated from adipocytes, and the extracted metabolites were analyzed for alterations in the metabolome using gas chromatography (GC) and liquid chromatography (LC) mass spectrometry (MS). Several metabolite classes, including lipids, amino acids, carbohydrates, and co-factors were altered in cancer cells co-cultured with HPA (Supplementary Fig. 1A, B). Cancer cells were initially found to accumulate amino acids (such as serine, asparagine, and histamine), but these levels were reduced with longer co-culture (18hrs). There was also a consistent reduction in the amount of metabolic intermediates of branched-chain amino acids with adipocyte co-culture. Interestingly, metabolomics analysis revealed reduced glycogen synthesis (reduced glucose-1-phosphate) consistent to what we reported with CAF co-culture (24) and increased utilization of the non-oxidative pentose phosphate pathway as indicated by initial increase (4hr) and later consumption of sedoheptulose-7-phosphate (18hr) (Supplementary Fig. 1A, B).
The transfer of lipids from adipocytes to cancer cells is emerging as a hallmark of tumors that thrive in a lipid-rich tumor environment (3,25–28). However, the specific alterations of different lipid species are unknown. Our study of the lipidome in the presence of HPA showed that cancer cells accumulate several species of short and long chain fatty acids, with linoleate (18:2) being the most abundant (Fig. 1A) and consistently elevated species at both 4 and 18hr time points (Supplementary Fig. 1A, B). The co-cultured cancer cells also exhibited an oxidative stress signature characterized by increases in hydroxy species of palmitate, stearate, cholesterol, and oxylipins such as 13-HODE and 9-HODE (Fig. 1B). Consistent with these findings, adipocyte co-culture of OvCa cells induced intracellular reactive oxygen species (ROS) and the lipid peroxidation product malondialdehyde (MDA) in a time-dependent manner (Fig. 1C, D). This increase in lipid peroxidation products observed in cell culture was confirmed in human omental metastases from 4 patients with HGSOC. Cancer cells adjacent to omental adipocytes showed increased expression of anti-4-hydroxynonenal (4-HNE) adducts, which is a surrogate of lipid peroxidation (Fig. 1E).
Figure 1. Adipocytes changes global cancer cell metabolism.

Untargeted metabolomics of cancer cells co-cultured with human primary adipocytes (HPA) using GC-MS and LC-MS. The bar graphs show scaled intensity values of altered fatty acids (A) and oxylipins (B) in SKOV3ip1 cells alone (- Adi) or with adipocyte co-culture (+ Adi) for 4hr (left) and 18hr (right). (C) Reactive oxygen species. Flow cytometry analysis of SKOV3ip1 cells stained with CellROX Deep Red reagent after treatment with adipocyte-conditioned media (Adi CM). (D) Relative malondialdehyde (MDA) levels in cancer cells co-cultured with HPA. For A-D a paired t-test was performed. Bar graphs depict mean +/− SEM (* p < 0.05, ** p < 0.01, *** p < 0.001, **** p< 0.0001). (E) Immunohistochemistry for 4- hydroxynonenal (4HNE) adducts. Human omental metastasis from patients with high-grade serous ovarian cancer were stained. Adipocytes in the section are labeled as “A”. Scale bar = 100 μm.
To identify the proteins regulating the metabolic changes seen in cancer cells upon adipocyte co-culture, we carried out unbiased mass spectrometry-based proteomic profiling with identical culture conditions. Since intracellular lipid changes were detected at an early time point, we co-cultured SKOV3ip1 cells with adipocytes for 4hr and profiled the proteome. Using a single shot label-free strategy (19), we were able to identify more than 6,700 proteins per sample with a similar number of proteins identified in cancer cells alone or when co-cultured with adipocytes (Supplementary Fig. 2A). After 4hr co-culture, 16 proteins were significantly altered in cancer cells (Supplementary Table 1). Among them, lipid metabolism proteins, FABP4, CD36, and alcohol dehydrogenase (ADH) 1 proteins were increased upon co-culture (Fig. 2A). ADH1B regulates alcohol metabolism and is of prognostic significance for residual tumor disease in ovarian cancer (29). CD36, a fatty acid receptor (30), and FABP4, a lipid chaperone protein, are both regulated by PPARγ (31) and are important for fatty acid uptake, compartmentalization, and metabolism (32). Interestingly, using the TCGA ovarian cancer dataset (33), we identified a subgroup of patients expressing all three proteins with a strong correlation (Supplementary Fig. 2B, C). While these proteins are expressed in the normal omental tissue (Supplementary Fig. 2 D), immunohistochemistry on sections of human omental HGSOC metastasis samples showed elevated expression of ADH1B, CD36, and FABP4 in the epithelial tumor compartment (Fig. 2B). In addition, using a publicly available HGSOC dataset (34) we found significant upregulation of CD36, FABP4 and ADH1b proteins in peritoneal metastatic tumors when compared to the primary tumor (Supplementary Fig. 2E).
Figure 2. Proteomics identifies FABP4 and CD36 upregulation after co-culture with adipocytes.

Mass spectrometry-based proteomic analysis of SKOV3ip1 cells co-cultured with HPA. (A) Volcano plot of pairwise comparison between cancer cells alone or in co-culture with HPA (4hr). Fold changes (t-test difference, log2) were calculated and plotted against t-test p-value (-log10). Upregulated proteins are labeled in red while downregulated proteins are labeled in green. (B) Immunohistochemistry for CD36, FABP4, and ADH1B proteins using serial sections of human omental metastasis from 4 patients with high grade serous ovarian cancer. Scale bar = 100 μm. (C) Western blot. SKOV3ip1 cells were co-cultured with adipocytes and expression of CD36, and FABP4 detected by immunoblotting. (D-E) Cells with stable knockdown of CD36 (D), and FABP4 (E) were treated with adipocyte conditioned media (Adi CM) for 24hr, and western blot carried out for the indicated proteins. Scale bar = 100 μm.
Given that the principal finding of the global metabolomics analysis was lipidomic changes, we focused further on CD36 and FABP4. Validating our proteomic data by western blotting showed increased expression of CD36 and FABP4 proteins in SKOV3ip1 cells upon adipocyte co-culture (Fig. 2C). We also found increased expression of FABP4 with adipocyte co-culture in a panel of cell lines representative of HGSOC (Supplementary Fig. 2F). Moreover, knockdown of CD36 was found to reduce adipocyte induced FABP4 expression (Fig. 2D), while knockdown of FABP4 did not affect adipocyte mediated CD36 expression (Fig. 2E). Our data thus suggest a functional and/or regulatory link between these two proteins, with CD36 being an upstream regulator of FABP4.
FABP4 plays a central role in regulating adipocyte induced lipid metabolism in cancer cells.
Having recently shown that CD36 plays a role in adipocyte mediated lipid uptake in cancer cells (6), we expanded these findings by examining the role of the lipid chaperone protein FABP4 in intracellular lipid metabolism (7,32,35). Stable knockdown of FABP4 in OvCa cells co-cultured with adipocytes followed by untargeted metabolomics revealed major changes in the cancer cell lipidome (Fig. 3A). Loss of FABP4 reduced the capacity of cancer cells to accumulate neutral lipids such as triacylglycerol and cholesterol esters as manifested by a reduction in lipid droplets (Supplementary Fig. 3A–C) (7,26,32,35). There was also a marked reduction in various ceramides species, and increases in glucosylceramide and sphingomyelin species (Supplementary Fig. 3D–F). Moreover, phosphatidylcholine species also increased in cells with the loss of FABP4 (Supplementary Fig. 3G). Because neutral lipids are oxidized by cancer cells (3,27), we measured fatty acid oxidation and found that loss of FABP4 reduced adipocyte-induced but not constitutive β-oxidation in cancer cells (Fig. 3B). FABP4 inhibition also blocked adipocyte-induced ROS generation (Fig. 3C) and lipid peroxidation (Fig. 3D).
Figure 3. FABP4 regulates global lipid metabolism.

(A) Global metabolomics. SKOV3ip1 cells with stable knocked down of FABP4 were cultured ± adipocytes. After 18 hr metabolites were extracted and global untargeted metabolomics performed using GC-MS and LC-MS. Increased metabolites are represented in red while reduced are green. PC- phosphatidylcholine, PE- phosphatidylethanolamine, SM- sphingomyelin, TG- triacylglycerol. (B-D) SKOV3ip1 FABP4 knock down cells were cultured ± adipocytes and (B) fatty acid oxidation determined by generation of 3H2O, (C) Reactive oxygen species (ROS) estimated using flow cytometry, and (D) lipid peroxidation determined by measuring malondialdehyde (MDA) levels. (E) MTT assay. Proliferation of OvCa cells cultured ± adipocytes and concomitant treatment of N-acetyl cysteine (0.5mM), and etomoxir (50μM) for 72hr (** p < 0.01, *** p < 0.001, **** p < 0.0001).
Since β-oxidation and ROS are known drivers of cell proliferation, we next analyzed their role in adipocyte-induced cell proliferation. Using N-acetyl cysteine (a ROS chelator) and etomoxir (an inhibitor of CPT1 and β-oxidation), we found that both β-oxidation and ROS contribute to adipocyte induced cell proliferation (Fig. 3E).
Inhibition of FABP4 leads to increase in DNA demethylation
The metabolomic data (from Fig. 3A) indicated that the TCA cycle metabolites regulated by FABP4 in the presence of adipocytes are citrate, isocitrate, α-ketoglutarate, and malate (Fig. 4A). No significant change was detected in intracellular glutamine/glutamate levels (Fig. 4A), thereby pointing to a role for FABP4 in glucose oxidation. Indeed, FABP4 overexpression (Supplementary Fig. 4A) increased mitochondrial oxidation with no change observed in glycolytic rate (Fig. 4B, C). In the opposite experiment, FABP4 inhibition reduced mitochondrial oxidation with a concomitant increase in glycolytic rate (Fig. 4D, E). FABP4 inhibition led to an increase in glycolysis derived ATP production and a decrease in mitochondrial ATP production (Fig. 4F). The total ATP production, however, remained unchanged (Fig. 4F). This suggests for a compensatory increase in glycolysis when FABP4 is inhibited.
Figure 4. Loss of FABP4 increases glucose oxidation.

(A) TCA cycle metabolites. Relative levels of glycolytic and TCA cycle metabolites were pulled out from the untargeted metabolomics data in Fig. 3A, where SKOV3ip1 FABP4 knock down cells, were cultured with adipocytes. (B, D) Oxygen consumption rate (OCR) as a measure of mitochondrial glucose oxidation, (Seahorse XFe96), in cells with ectopic expression (B) and stable knock down (D) of FABP4. (C, E) Extracellular acidification rate (ECAR), as a measure of glycolysis after ectopic expression (C) and knock down (E) of FABP4. (F) Estimation of glycolysis-derived versus mitochondrial-derived ATP generation in FABP4 knock down cells co-cultured with adipocytes (Seahorse XFe96). (G) Cell cycle analysis. SKOV3ip1 with stable knockdown of FABP4 was cultured with adipocytes for 48hr, stained with propidium iodide and the cell cycle profile determined by flow cytometry. Percent of cells in each phase of the cell cycle were quantitated and plotted. (H) DNA dot blot to determine changes in 5-hydroxymethylcytosine (5-hmc) levels in FABP4 knockdown SKOV3ip1 cultured with adipocytes for 48hr. Bars are means ± SEM (* p < 0.05, ** p < 0.01, *** p < 0.0005, **** p < 0.0001).
Since α-ketoglutarate was the most strongly induced TCA cycle (2.7-fold) intermediate in FABP4 knockdown cells, we focused on determining its effect on cancer cells. α-ketoglutarate is a co-substrate for ten eleven translocase (TET) enzymes, which oxidizes DNA 5-methylcytosines to 5-hydroxymethylcytosines (5-hmc) (36) thereby regulating DNA methylation, and reducing cell proliferation (37,38). Using dimethyl-2oxoglutarate (dm-2OG) a cell-permeable analogue of α-ketoglutarate, we observed increased DNA 5-hmc levels, accompanied by G1 arrest (Supplementary Fig. 4B, C). Consistent with these results FABP4 knockdown SKOV3ip1 cells co-cultured with adipocytes, exhibited increased levels of 5-hmc DNA modifications with a greater number of cells in the G1 phase of the cell cycle (Fig. 4G, H). Similarly, inhibition of FABP4 using a small molecule inhibitor (BMS309403) led to an increase in 5-hmc levels in CAOV3 cells co-cultured with adipocytes (Supplementary Fig. 4D), while no increase was seen in these cells with adipocyte co-culture alone.
FABP4 regulates ovarian cancer cell proliferation and metastasis
To determine the effect of FABP4 inhibition on gene expression and identify cellular processes regulated by FABP4, we carried out microarray analyses on RNA isolated from stably transduced shRNA FABP4 cells. Inhibition of FABP4 changed the expression of 189 genes, of these 116 were upregulated and 73 genes were downregulated. The top 20 genes with altered expression are listed (Supplementary Table 2). The adipocyte induced increase in IL-6 and decrease in HES2 mRNA levels in cancer cells (6) was abrogated upon FABP4 inhibition (Supplementary Table 2), suggesting that FABP4 is the upstream regulator of multiple adipocyte induced genes in OvCa cells. Ingenuity pathway analysis (IPA) showed that knockdown of FABP4 led to inhibition of several tumorigenic pathways including proliferative, migration, and invasion regulatory networks, and subsequently reduced signaling through pro-tumorigenic pathways (Fig. 5A, Supplementary Fig. 5A, Table 3). Consistent with the IPA analysis, shFABP4 cells showed reduced colony-forming capacity in clonogenic assays (Fig. 5B).
The growth sustaining effect of FABP4 led to the loss of shRNA knockdown in vivo, making long-term in vivo studies challenging. Therefore, to pursue in vivo studies we generated clustered regularly interspaced short palindromic repeats (CRISPR) mediated knockout of FABP4 in serous OVCAR8 cells (39). Using single guide RNA targeting FABP4 exon 3, we generated FABP4 knockout clones with heterozygous deletion of FABP4 leading to significant loss of FABP4 protein (Supplementary Fig. 5B, C). Animals injected intraperitoneally with FABP4 CRISPR cell clones developed significantly fewer metastatic implants (n=51.8 versus n=194.7) and smaller tumors (102 mg versus 491 mg) as compared to control CRISPR cells (Fig. 5C). Notably, there was a significant reduction of tumor burden in the omentum (129 mg versus 239 mg) (Supplementary Fig. 5D) and the overall size of the omental tumor mass was significantly decreased (Supplementary Fig. 5E). Consistent with the shRNA mediated knockdown of FABP4 (Fig. 4H), we observed increases of 5-hmc levels in the DNA of FABP4 CRISPR cells treated with adipocyte conditioned media (Supplementary Fig. 5F). Corroborating the in vitro data, omental tumors generated by FABP4 CRISPR cells had stronger 5-hmc staining (Fig. 5D).
A small molecule FABP4 inhibitor blocks cell proliferation and omental colonization
Given the effects of FABP4 inhibition using shRNA and CRISPR on OvCa proliferation and metastasis, we sought to determine whether we could reproduce these results with a small molecule inhibitor. For this purpose, we used BMS309403, an orally active small molecule tool compound against FABP4 that interacts with the FABP4 lipid binding pocket and inhibits atherosclerosis and type 2 diabetes in rodent models (40,41).
Since molecular inhibition of FABP4 leads to cell cycle arrest, first we sought to determine whether BMS309403 affected the cell cycle. Flow cytometry analysis of propidium iodide stained cancer cells showed that BMS309403 treatment also resulted in a greater number of cells in the G1 phase, with a concomitant reduction of cells in the S-phase (Fig. 6A). The addition of BMS309403 to full thickness human omental explants ex vivo, significantly reduced the colonization of GFP labeled HeyA8 and SKOV3ip1 cells (Fig. 6B). Next, we performed orthotopic injection of mouse ID8 ovarian cancer cells into the bursa of immunocompetent mice and allowed tumors to establish for 60 days, followed by oral gavage with BMS309403 for 28 days. In this intervention study there was a significant reduction in metastasis with BMS309403 treatment, as evidenced by fewer (n=98 versus n=169) and smaller (252 mg versus 483mg) metastatic nodules (Fig. 6C), but no difference was observed in primary ovarian tumor burden (Supplementary Fig. 6). Histologic examination revealed that, with BMS309403 treatment, the normal omental tissue architecture was partially restored, manifested by lowed tumor volume and visible interspersed islands of histologically normal-appearing adipose tissue. In contrast, these islands were completely lacking in the vehicle-treated groups because the tumor had completely replaced the omentum (Fig. 6D).
Figure 6. A small molecule inhibitor of FABP4 reduces ovarian cancer metastasis.

(A) Cell cycle analysis. Skov3ip1 cells were treated with the FABP4 inhibitor (BMS309403) for 24hr, stained using propidium iodide solution and cell cycle analysis carried out using flow cytometry. A representative cell cycle profile and percent cells in each phase of the cell cycle were quantitated and plotted. (B) Ex-vivo omental assay. GFP labeled HeyA8 and SKOV3ip1 cells were cultured with fresh human omental tissue in the presence or absence of 50 μM of the FABP4 inhibitor BMS309403 (72hr). Representative images of omental explants per treatment groups shown (left) and fluorescence intensity quantitated (right). (C) Syngeneic orthotopic mouse model. ID8 mouse ovarian cancer cells were injected intra-bursally and treated with BMS309403 (15 mice) or vehicle control (16 mice). The number of metastasis and tumor weights were measured and plotted as mean ± SEM. (D) Representative H&E stained mouse omental tumors from each group. Adipocyte labelled as “A”, and cancer regions as “C”. Scale bar 500 μm (* p < 0.05, ** p < 0.005 and *** p < 0.001).
FABP4 inhibition increases the sensitivity of cancer cells towards carboplatin
Since single agent BMS treatment reduced OvCa metastasis, we explored the efficacy of BMS309403 in combination with carboplatin, the most effective chemotherapy drug against epithelial OvCa (2). PE01 and PE04 are carboplatin sensitive and resistant cell line pairs isolated from the same patient before and after recurrent disease following platinum-based chemotherapy (42). The sensitivity of the resistant sub-clone (PE04) to carboplatin was considerably increased with the addition of the BMS309403 compound (49.8 versus 87.0 μM) (Fig. 7A). The specific contribution of FABP4 towards platinum response was illustrated by the fact that FABP4 shRNA transduced cells had a much lower IC50 for carboplatin than the control shRNA transduced cells (26.2 versus 69.5 μM), (Fig. 7B). This was confirmed in two additional ovarian cancer cell lines that also had reduced survival with both treatments (Fig. 7C).
Figure 7. FABP4 sensitizes cancer cells to carboplatin chemotherapy.
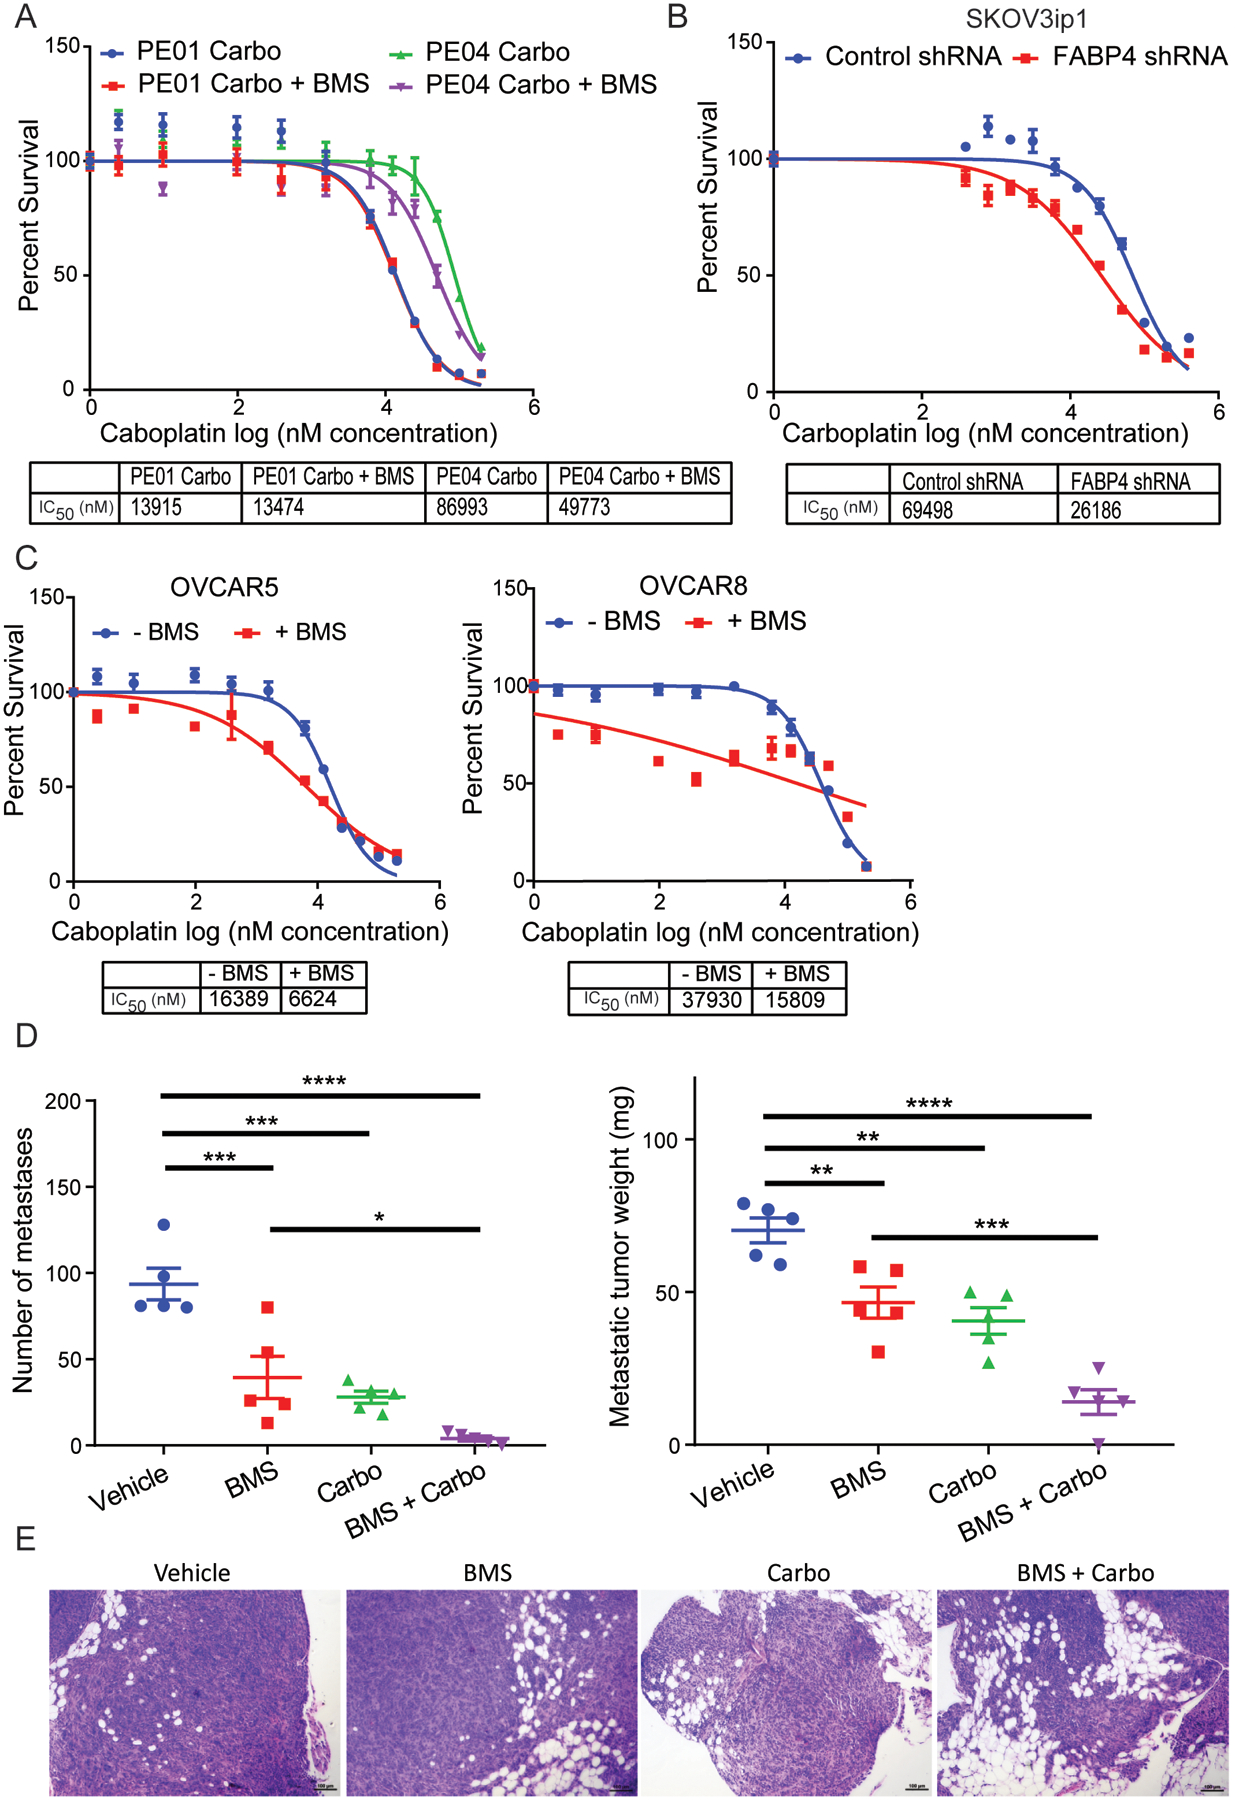
MTT assay and subsequent IC50 analysis were carried out for the following: (A) paired ovarian cancer cell lines PE01 (platinum sensitive) and PE04 (platinum resistant) treated once with different concentrations of carboplatin ± 20 μM BMS309403 and measured 72 hr later. (B) FABP4 shRNA transduced SKOV3ip1 cells and control shRNA were treated with serial dilutions of carboplatin. (C) The indicated ovarian cancer cell lines were treated once with serial dilutions of carboplatin ± 20 μM BMS309403 (D) Xenograft mouse model. Female mice (n=20) were injected intraperitoneally (IP) with 5 million ID8 mouse ovarian cancer cells and mice randomly assigned into 4 groups (n=5/group). After 40 days mice were treated with either carboplatin (30 mg/kg) or BMS309403 (20 mg/kg) or with both drugs for an additional 26 days (66 days total) and metastatic burden compared with the BMS vehicle group. Total number of metastasis (left) and metastatic weight (right) were recorded (mean ± SEM). ANOVA analysis was carried out to determine statistical significance between the groups (BMS – BMS309403, Carbo – Carboplatin, **** p ≤ 0.0001, ***p ≤ 0.001, **p ≤ 0.01, *p ≤ 0.05). (E) Representative H&E stained omental tumors from each group from (D). Scale bar 100 μm.
Next, we examined the metastatic tumor burden in a syngeneic xenograft mouse model treated with either a single agent drug (carboplatin or BMS) or with the drugs in combination. We injected mouse ID8 ovarian cancer cells intraperitoneally and, allowed 40 days for tumor growth, and then initiated drug treatment for 26 days (“intervention study” (43)). BMS309403 and carboplatin together had a more profound effect than that observed with single-agent treatments (Fig. 7D). The combination treatment resulted in a reduction in both the number and weight of metastatic nodules (Fig. 7D). Furthermore, combination treatment restored to a greater extent the normal omental tissue architecture and resulted in markedly smaller tumors (Fig. 7E).
Discussion
Adipocytes reprogram ovarian cancer cell metabolism
High-grade serous cancer primarily metastasizes to adipose-rich areas such as the omentum, the bowel mesentery, and appendices epiploicae on the colon. During metastasis, adipocytes in the microenvironment are recruited by cancer cells and transform into cancer-associated adipocytes (CAA). This term, which conveys an evolving symbiotic relationship between adipocytes and cancer cells, was coined by the Muller laboratory in 2010 (44,45). Over the last decade, we and others (3,26,46) have shown that when cancer cells from different organs are co-cultured with adipocytes, lipids are transferred from the adipocytes to the cancer cells. These lipids are then stored as long chain FA in lipid droplets and used for energy production through β-oxidation.
In our comprehensive analysis of changes in the lipid composition of cancer cells cultured with primary human visceral adipocytes, we detected over 315 individual, significantly altered metabolites using both gas and liquid chromatography mass spectrometry platforms. This systematic metabolomics analysis showed that the unsaturated long chain fatty acid linoleate (18:2) was the most abundant fatty acid in cancer cells following adipocyte co-culture. Linoleic acid is a precursor for arachidonic acid and prostaglandins, which regulate inflammation, and is associated with an increased risk of developing ovarian cancer (47). In contrast, breast cancer cells co-cultured with a differentiated murine pre-adipocyte cell line show strong induction of saturated fatty acids (palmitate16:0, stearate 18:0) (26). One possible explanation for this difference is that the predominant oncogene mutation (e.g. myc, ras, p53), which will vary by tumor type, will affect adipocyte – cancer cell metabolism. Secondly, the metabolism of visceral, subcutaneous, and bone marrow adipocytes differs significantly (27,48) and will affect their interaction with cancer cells. Because visceral adipocytes are in close proximity to the portal circulation, they are particularly affected by the daily nutrient uptake.
As well as a significant increase in linoleic acid in ovarian cancer cells co-cultured with adipocytes, we detected an increase in levels of oxidized lipids (13-HODE, 9-HODE), which are stereoisomer metabolites of linoleic acid. Co-culture also strongly induced ROS and lipid peroxidation in the cancer cells. These 4 convergent experimental findings suggest that adipocyte-derived lipids not only provide energy to cancer cells but also serve as pro-inflammatory mediators and signaling lipids, which by inducing ROS in the cancer cells makes them more tumorigenic. Indeed, prostate cancer cells co-cultured with mature adipocytes have a higher expression of NADPH oxidases and ROS (49), supporting the concept that cancer cells are activated in the presence of adipocytes.
FABP4 is a possible therapeutic target
In order to discover which proteins are upregulated in cancer cells by their interaction with adipocytes, we performed proteomic analysis, detecting close to 7,000 different proteins. Several proteins involved in lipid uptake and lipid transport were significantly upregulated, including CD36, ADH1A/B/C, and FABP4. Interestingly, the interrogation of two large datasets of primary HGSOC (TCGA (33), Tothill (34)) by Tucker et al (29) determined that ADH1B and FABP4 were the two most important genes associated with a significant risk of residual tumors in HGSOC after a RO-resection (surgery intended to remove all visible disease). In their analysis of ovarian cancer cells in the Cancer Cell Line Encyclopedia (50) they did not find overexpression of ADH1 and FABP4 (29), indicating that these genes are regulated by the tumor microenvironment. Indeed, our data suggest that ADH1 and FABP4 were induced in tumor cells by adipocytes, and make the cancer cells more invasive and metastatic. Since the TCGA and Tothill datasets report gene expression in whole tumor tissue, the upregulation of ADH1B and FABP4 seen here probably reflects the condition of tumor cells residing in adipocyte rich stroma. We previously found that FABP4 was upregulated at the leading edge of OvCa cells invading and replacing omental adipose tissue (3). Likewise, ADH1B also promotes metastasis, including the invasion and adhesion of HGSOC (51). Alcohol dehydrogenases metabolize and remove toxic lipid peroxidation products, so there may be another mechanism in place that protects the cancer cells from the pro-apoptotic effects of ROS.
In view of the strong evidence that FABP4 is important in HGSOC biology, we set out to determine how inhibition of FABP4 affected global cancer cell metabolism and whether FABP4 inhibition might have therapeutic benefit. The stable knock down of FABP4 in the cancer cells affected the entire lipidome, reducing β-oxidation, ROS generation, and lipid peroxidation, thereby impacting key tumorigenic pathways like proliferation and cytokine release. The deletion of FABP4 with CRISPR also confirmed an inhibitory effect on tumor growth in vivo. This is consistent with the study by Gharpure et al, showing that treatment with nanoliposomes encapsulating FABP4 siRNA impairs tumor growth and metastasis (35).
These studies (3,29,35,52) and the results presented here focus on the role of FABP4 in cancer cells where it regulates proliferation and possibly quiescence. It is yet to be determined if inhibition of FABP4 reduces homing of OvCa cells to the omentum or slows down the growth or metastatic implants.
However, FABP4 also plays an important role in the cells of the tumor microenvironment, contributing to the pro-tumorigenic role of adipocytes, macrophages (53), and endothelial cells (54).
Indeed, intraperitoneal injection of high FABP4 expressing ovarian cancer cells into FABP4−/− mice resulted in minimal tumor growth and only a few metastasis (3). The overexpression of FABP4 in tumor-associated macrophages promotes breast cancer growth (53) and blocking FABP4 in endothelial cells reduced angiogenic activity and tumor growth (54). Therefore, testing an orally available FABP4 inhibitor (BMS309403), which could target both tumor and stromal cells in the tumor organ, was the next logical step if we were to translate biological insights into concrete treatments. All our results with BMS309403 (40), which was developed as a treatment for metabolic syndrome, blocked early metastasis and very efficiently reduced established metastasis and established tumor burden but did not significantly reduce primary tumor growth. Combining the FABP4 inhibitor with carboplatin, one of the standard treatments for ovarian cancer, almost completely inhibited metastasis and reduced tumor weight by over 75%. While BMS309403 is primarily an experimental tool compound effective in the μM range, other FABP4 inhibitors are in development. For example, the FDA approved antibiotic levofloxacin inhibits FABP4 activity efficiently (IC50=5.83μM) through binding to the FA binding pocket (BMS induces an allosteric regulation of FABP4 and up-regulation of PPARγ) (55).
Lipid metabolism and methylation
Our data also provide a novel link between lipid metabolism and DNA methylation. The metabolomic study showed that FABP4 knockdown cells co-cultured with adipocytes accumulate a large amount of α-ketoglutarate, a regulator of TET proteins. TETs are DNA demethylating enzymes that convert 5-mc to 5-hmc (36,56,57). The increased α-ketoglutarate levels in cells with FABP4 knockdown resulted in increased 5-hmc levels and more cells blocked in G1, an effect that could be mimicked with the addition of a cell-permeable α-ketoglutarate analog (58). Consistent with the in vitro data, we also observed increased 5-hmc staining in FABP4 knockdown tumors in vivo. While specific gene expression changes regulated by 5-hmc marks are cellular context-dependent, increased DNA 5-hmc levels bear a strong correlation to reduced cell proliferation (37,59), explaining why 5-hmc levels are reduced in multiple cancers (59,60). Thus, one mechanism through which blocking FABP4 reduces tumor aggressiveness is the regulation of methylation.
In summary, we describe the proteo-metabolomic changes that occur in cancer cells with adipocyte co-culture and provide support for targeting FABP4 in combination with platinum chemotherapy as a treatment for HGSOC.
Supplementary Material
Significance.
Ovarian cancer metastatic progression can be restricted by targeting a critical regulator of lipid responses, FABP4.
Acknowledgments
We thank Drs. Fabian Coscia and Matthias Mann (Max Plank Institute of Biochemistry, Martinsried, Bavaria) for help with the proteomic analysis, Dr. A.F. Haney (University of Chicago) for collecting omental biopsies, and G. Isenberg for editing this manuscript. We really appreciate the help provided by C. Zhang and J. Andrade at the Center for Research Informatics (University of Chicago) in analyzing microarray data. We thank Bristol Myers Squib for providing us with the FABP4 inhibitor BMS309403. This study was supported by a NCI grant (R01CA169604) to E. Lengyel.
Finally, we would like to thank all the patients, donors, and resident physicians in the department of Obstetrics and Gynecology at the University of Chicago for their support and commitment towards tissue collection and banking.
Funding: This project was supported by a grant from the National Cancer Institute (5R01CA169604), awarded to Ernst Lengyel.
Abbreviations
- 4-HNE
4-hydroxynonenal
- 9-HODE
9- Hydroxyoctadecadienoic acid
- 13-HODE
13-Hydroxyoctadecadienoic acid
- ADH
Alcohol Dehydrogenase
- CRISPR
Clustered regularly interspaced short palindromic repeats
- EMT
Epithelial Mesenchymal Transition
- FA
Fatty Acid
- FABP
Fatty Acid Binding Protein
- HGSOC
High grade serous ovarian cancer
- IPA
Ingenuity pathway analysis
- Kd
knock down
- OvCa
Ovarian cancer
- PPAR
Peroxisome proliferator-activated receptor
- TET
Ten eleven translocase
Footnotes
Conflict of interest statement: The authors declare the following potential conflicts of interest. Kristin Nieman and Ernst Lengyel hold a patent for treating ovarian cancer by inhibiting fatty acid binding proteins.
References:
- 1.Lengyel E Ovarian cancer development and metastasis. Am J Pathol 2010;177:1053–64 [DOI] [PMC free article] [PubMed] [Google Scholar]
- 2.Bowtell DD, Bohm S, Ahmed AA, Aspuria PJ, Bast RC Jr., Beral V, et al. Rethinking ovarian cancer II: Reducing mortality from high-grade serous ovarian cancer. Nat Rev Cancer 2015;15:668–79 [DOI] [PMC free article] [PubMed] [Google Scholar]
- 3.Nieman KM, Kenny HA, Penicka CV, Ladanyi A, Buell-Gutbrod R, Zillhardt MR, et al. Adipocytes promote ovarian cancer metastasis and provide energy for rapid tumor growth. Nat Med 2011;17:1498–503 [DOI] [PMC free article] [PubMed] [Google Scholar]
- 4.Pradeep S, Kim SW, Wu SY, Nishimura M, Chaluvally-Raghavan P, Miyake T, et al. Hematogenous metastasis of ovarian cancer: Rethinking mode of spread. Cancer Cell 2014;26:77–91 [DOI] [PMC free article] [PubMed] [Google Scholar]
- 5.Eckert MA, Pan S, Hernandez KM, Loth RM, Andrade J, Volchenboum SL, et al. Genomics of ovarian cancer progression reveals diverse metastatic trajectories including intraepithelial metastasis to the fallopian tube. Cancer Discov 2016;6:1342–51 [DOI] [PMC free article] [PubMed] [Google Scholar]
- 6.Ladanyi A, Mukherjee A, Kenny HA, Johnson A, Mitra AK, Sundaresan S, et al. Adipocyte-induced CD36 expression drives ovarian cancer progression and metastasis. Oncogene 2018;37:2285–301 [DOI] [PMC free article] [PubMed] [Google Scholar]
- 7.Furuhashi M, Hotamisligil GS. Fatty acid binding proteins: Role in metabolic diseases and potential as drug targets. Nature Reviews Drug Discovery 2008;7:489–503 [DOI] [PMC free article] [PubMed] [Google Scholar]
- 8.Bernlohr DA, Doering TL, Kelly TJ Jr., Lane MD. Tissue specific expression of p422 protein, a putative lipid carrier, in mouse adipocytes. Biochem Biophys Res Commun 1985;132:850–5 [DOI] [PubMed] [Google Scholar]
- 9.Uysal KT, Scheja L, Wiesbrock SM, Bonner-Wier S, Hotamisligil GS. Improved glucose and lipid metabolism in genetically obese mice lacking aP2. Endocrinology 2000;141:3388–96 [DOI] [PubMed] [Google Scholar]
- 10.Hotamisligil GS, Johnson RS, Distel RJ, Ellis R, Papaioannou VE, Spiegelman BM. Uncoupling of obesity from insulin resistance through a targeted mutation in aP2, the adipocyte fatty acid binding protein. Science 1996;274:1377–9 [DOI] [PubMed] [Google Scholar]
- 11.Cao H, Sekiya M, Ertunc ME, Burak MF, Mayers JR, White A, et al. Adipocyte lipid chaperone AP2 is a secreted adipokine regulating hepatic glucose production. Cell Metab 2013;17:768–78 [DOI] [PMC free article] [PubMed] [Google Scholar]
- 12.Ishimura S, Furuhashi M, Watanabe Y, Hoshina K, Fuseya T, Mita T, et al. Circulating levels of fatty acid-binding protein family and metabolic phenotype in the general population. PLoS One 2013;8:e81318. [DOI] [PMC free article] [PubMed] [Google Scholar]
- 13.Romero IL, Mukherjee A, Kenny HA, Litchfield LM, Lengyel E. Molecular Pathways: Trafficking of metabolic resources in the tumor microenvironment. Clinical Cancer Research 2015;21:680–6 [DOI] [PMC free article] [PubMed] [Google Scholar]
- 14.Chaudhri VK, Salzler GG, Dick SA, Buckman MS, Sordella R, Karoly ED, et al. Metabolic alterations in lung cancer-associated fibroblasts correlated with increased glycolytic metabolism of the tumor. Mol Cancer Res 2013;11:579–92 [DOI] [PMC free article] [PubMed] [Google Scholar]
- 15.Yang L, Achreja A, Yeung TL, Mangala LS, Jiang D, Han C, et al. Targeting Stromal Glutamine Synthetase in Tumors Disrupts Tumor Microenvironment-Regulated Cancer Cell Growth. Cell Metab 2016;24:685–700 [DOI] [PMC free article] [PubMed] [Google Scholar]
- 16.Curtis M, Kenny HA, Ashcroft B, Mukherjee A, Johnson A, Zhang Y, et al. Fibroblasts mobilize tumor cell glycogen to promote proliferation and metastasis. Cell Metab 2018;18. [DOI] [PMC free article] [PubMed] [Google Scholar]
- 17.Kind T, Wohlgemuth G, Lee DY, Lu Y, Palazoglu M, Shahbaz S, et al. Fiehnlib: Mass spectral and retention index libraries for metabolomics based on quadrupole and time-of-flight gas chromatography/mass spectrometry. Anal Chem 2009;81:10038–48 [DOI] [PMC free article] [PubMed] [Google Scholar]
- 18.Meissen JK, Yuen BTK, Kind T, Riggs JW, Barupal DK, Knoepfler PS, et al. Induced pluripotent stem cells show metabolomic differences to embryonic stem cells in polyunsaturated phosphatidylcholines and primary metabolism. PLoS One 2012;7:e46770. [DOI] [PMC free article] [PubMed] [Google Scholar]
- 19.Coscia F, Watters KM, Curtis M, Eckert MA, Chiang CY, Tyanova S, et al. Integrative proteomic profiling of ovarian cancer cell lines reveals precursor cell associated proteins and functional status. Nat Commun 2016;7:12645. [DOI] [PMC free article] [PubMed] [Google Scholar]
- 20.Coscia F, Lengyel E, Duraiswamy J, Ashcroft B, Bassani-Sternberg M, Wierer M, et al. Multi-level proteomics identifies CT45 as mediator of chemosensitivity and immunotherapy target in ovarian cancer. Cell 2018;175:159–70 [DOI] [PMC free article] [PubMed] [Google Scholar]
- 21.Tyanova S, Temu T, Sinitcyn P, Carlson A, Hein MY, Geiger T, et al. The Perseus computational platform for comprehensive analysis of (prote)omics data. Nat Methods 2016;13:731–40 [DOI] [PubMed] [Google Scholar]
- 22.TeSlaa T, Chaikovsky AC, Lipchina I, Escobar SL, Hochedlinger K, Huang J, et al. alpha-Ketoglutarate Accelerates the Initial Differentiation of Primed Human Pluripotent Stem Cells. Cell Metab 2016;24:485–93 [DOI] [PMC free article] [PubMed] [Google Scholar]
- 23.Mitra AK, Chiang CY, Tiwari P, Tomar S, Watters KM, Peter ME, et al. Microenvironment-induced downregulation of miR-193b drives ovarian cancer metastasis. Oncogene 2015;34:5923–32 [DOI] [PMC free article] [PubMed] [Google Scholar]
- 24.Curtis M, Kenny HA, Ashcroft B, Mukherjee A, Johnson A, Zhang Y, et al. Fibroblasts Mobilize Tumor Cell Glycogen to Promote Proliferation and Metastasis. Cell Metab 2019;29:141–55 e9 [DOI] [PMC free article] [PubMed] [Google Scholar]
- 25.Gazi E, Gardner P, Lockyer NP, Hart CA, Brown MD, Clarke NW. Direct evidence of lipid translocation between adipocytes and prostate cancer cells with imaging FTIR microspectroscopy. J Lipid Res 2007;48:1846. [DOI] [PubMed] [Google Scholar]
- 26.Wang YY, Attane C, Milhas D, Dirat B, Dauvillier S, Guerard A, et al. Mammary adipocytes stimulate breast cancer invasion through metabolic remodeling of tumor cells. JCI Insight 2017;2:e87489. [DOI] [PMC free article] [PubMed] [Google Scholar]
- 27.Lengyel E, Makowski L, DiGiovanni J, Kolonin MG. Cancer as a matter of fat: The crosstalk between adipose tissue and tumors. Trends Cancer 2018;4:374–84 [DOI] [PMC free article] [PubMed] [Google Scholar]
- 28.Attane C, Milhas D, Hoy AJ, Muller C. Metabolic remodeling induced by adipocytes: A new Achilles’ heel in invasive breast cancer? Curr Med Chem 2018 [DOI] [PubMed] [Google Scholar]
- 29.Tucker SL, Gharpure K, Herbrich SM, Unruh AK, Nick AM, Crane EK, et al. Molecular biomarkers of residual disease after surgical debulking of high-grade serous ovarian cancer. Clin Cancer Res 2014;20:3280–8 [DOI] [PMC free article] [PubMed] [Google Scholar]
- 30.Pepino MY, Kuda O, Samovski D, Abumrad NA. Structure-function of CD36 and importance of fatty acid signal transduction in fat metabolism. Annu Rev Nutr 2014;34:281–303 [DOI] [PMC free article] [PubMed] [Google Scholar]
- 31.Boiteux G, Lascombe I, Roche E, Plissonnier ML, Clairotte A, Bittard H, et al. A-FABP a candidate progression marker of human transitional cell carcinoma of the bladder, is differentially regulated by PPAR in urothelial cancer cells. Int J Cancer 2009;124:1820–8 [DOI] [PubMed] [Google Scholar]
- 32.Hotamisligil GS, Bernlohr DA. Metabolic functions of FABPs--mechanisms and therapeutic implications. Nat Rev Endocrinol 2015;11:592–605 [DOI] [PMC free article] [PubMed] [Google Scholar]
- 33.The Cancer Genome Atlas N. Integrated genomic analyses of ovarian carcinoma. Nature 2011;474:609–15 [DOI] [PMC free article] [PubMed] [Google Scholar]
- 34.Tothill RW, Tinker AV, George J, Brown R, Fox SB, Lade S, et al. Novel molecular subtypes of serous and endometrioid ovarian cancer linked to clinical outcome. Clinical Cancer Research 2008;14:5198–208 [DOI] [PubMed] [Google Scholar]
- 35.Gharpure KM, Pradeep S, Sans M, Rupaimoole R, Ivan C, Wu SY, et al. FABP4 as a key determinant of metastatic potential of ovarian cancer. Nat Commun 2018;9:2923. [DOI] [PMC free article] [PubMed] [Google Scholar]
- 36.Tahiliani M, Koh KP, Shen Y, Pastor WA, Bandukwala H, Brudno Y, et al. Conversion of 5-methylcytosine to 5-hydroxymethylcytosine in mammalian DNA by MLL partner TET1. Science 2009;324:930–5 [DOI] [PMC free article] [PubMed] [Google Scholar]
- 37.Bachman M, Uribe-Lewis S, Yang X, Williams M, Murrell A, Balasubramanian S. 5-Hydroxymethylcytosine is a predominantly stable DNA modification. Nat Chem 2014;6:1049–55 [DOI] [PMC free article] [PubMed] [Google Scholar]
- 38.Li BT, Yu C, Xu Y, Liu SB, Fan HY, Pan WW. TET1 inhibits cell proliferation by inducing RASSF5 expression. Oncotarget 2017;8:86395–409 [DOI] [PMC free article] [PubMed] [Google Scholar]
- 39.Anglesio MS, Wiegand KC, Melnyk N, Chow C, Salamanca C, Prentice LM, et al. Type-specific cell line models for type-specific ovarian cancer research. PLoS One 2013;8:e72162. [DOI] [PMC free article] [PubMed] [Google Scholar]
- 40.Furuhashi M, Tuncman G, Gürgün, Makowski L, Atsumi G, Vaillancourt E, et al. Treatment of diabetes and atherosclerosis by inhibitig fatty-acid-binding protein aP2. Nature 2007;447:959–65 [DOI] [PMC free article] [PubMed] [Google Scholar]
- 41.Sulsky R, Magnin DR, Huang Y, Simpkins L, Taunk P, Patel M, et al. Potent and selective biphenyl azole inhibitors of adipocyte fatty acid binding protein (aFABP). Bioorg Med Chem Lett 2007;17:3511–5 [DOI] [PubMed] [Google Scholar]
- 42.Wolf CR, Hayward IP, Lawrie SS, Buckton K, McIntyre MA, Adams DJ, et al. Cellular heterogeneity and drug resistance in two ovarian adenocarcinoma cell lines derived from a single patient. Int J Cancer 1987;39:695–702 [DOI] [PubMed] [Google Scholar]
- 43.Kenny HA, Kaur S, Coussens LM, Lengyel E. The initial steps of ovarian cancer cell metastasis are mediated by MMP-2 cleavage of vitronectin and fibronectin. J Clin Invest 2008;118:1367–79 [DOI] [PMC free article] [PubMed] [Google Scholar]
- 44.Dirat B, Bochet L, Escourrou G, Valet P, Muller C. Unraveling the obesity and breast cancer links: A role for cancer-associated adipocytes. Endocr Dev 2010;19:45–52 [DOI] [PubMed] [Google Scholar]
- 45.Dirat B, Bochet L, Dabek M, Daviaud D, Dauviller S, Majad B, et al. Cancer-associated adipocytes exhibit an activated phenotype and contribute to breast cancer invasion. Cancer Res 2011;71:2455–65 [DOI] [PubMed] [Google Scholar]
- 46.Balaban S, Shearer RF, Lee LS, van Geldermalsen M, Schreuder M, Shtein HC, et al. Adipocyte lipolysis links obesity to breast cancer growth: Adipocyte-derived fatty acids drive breast cancer cell proliferation and migration. Cancer & metabolism 2017;5:1. [DOI] [PMC free article] [PubMed] [Google Scholar]
- 47.Zimmerman AW, Veerkamp JH. New insights into the structure and function of fatty acid-binding proteins. Cell Mol Life Sci 2002;59:1096–116 [DOI] [PMC free article] [PubMed] [Google Scholar]
- 48.Arner P Differences in lipolysis between human subcutaneous and omental adipose tissue. Ann Med 1995;27:435–8 [DOI] [PubMed] [Google Scholar]
- 49.Laurent V, Toulet A, Attane C, Milhas D, Dauvillier S, Zaidi F, et al. Periprostatic Adipose Tissue Favors Prostate Cancer Cell Invasion in an Obesity-Dependent Manner: Role of Oxidative Stress. Mol Cancer Res 2019;17:821–35 [DOI] [PubMed] [Google Scholar]
- 50.Barretina J, Caponigro G, Stransky N, Venkatesan K, Margolin AA, Kim S. The Cancer Cell Line Encyclopedia enables predictive modelling of anticancer drug sensitivity. Nature 2012;483:603–7 [DOI] [PMC free article] [PubMed] [Google Scholar]
- 51.Gharpure KM, Lara OD, Wen Y, Pradeep S, LaFargue C, Ivan C, et al. ADH1B promotes mesothelial clearance and ovarian cancer infiltration. Oncotarget 2018;9:25115–26 [DOI] [PMC free article] [PubMed] [Google Scholar]
- 52.Lee D, Wada K, Taniguchi Y, Al-Shareef H, Masuda T, Usami Y, et al. Expression of fatty acid binding protein 4 is involved in the cell growth of oral squamous cell carcinoma. Oncol Rep 2014;31:1116–20 [DOI] [PubMed] [Google Scholar]
- 53.Hao J, Yan F, Zhang Y, Triplett A, Zhang Y, Schultz DA, et al. Expression of Adipocyte/Macrophage Fatty Acid-Binding Protein in Tumor-Associated Macrophages Promotes Breast Cancer Progression. Cancer Res 2018;78:2343–55 [DOI] [PMC free article] [PubMed] [Google Scholar]
- 54.Harjes U, Bridges E, Gharpure KM, Roxanis I, Sheldon H, Miranda F, et al. Antiangiogenic and tumour inhibitory effects of downregulating tumour endothelial FABP4. Oncogene 2017;36:912–21 [DOI] [PMC free article] [PubMed] [Google Scholar]
- 55.Wang Y, Law WK, Hu JS, Lin HQ, Ip TM, Wan DC. Discovery of FDA-approved drugs as inhibitors of fatty acid binding protein 4 using molecular docking screening. J Chem Inf Model 2014;54:3046–50 [DOI] [PubMed] [Google Scholar]
- 56.Ito S, Shen L, Dai Q, Wu SC, Collins LB, Swenberg JA, et al. Tet proteins can convert 5-methylcytosine to 5-formylcytosine and 5-carboxylcytosine. Science 2011;333:1300–3 [DOI] [PMC free article] [PubMed] [Google Scholar]
- 57.He YF, Li BZ, Li Z, Liu P, Wang Y, Tang Q, et al. Tet-mediated formation of 5-carboxylcytosine and its excision by TDG in mammalian DNA. Science 2011;333:1303–7 [DOI] [PMC free article] [PubMed] [Google Scholar]
- 58.Carey BW, Finley LW, Cross JR, Allis CD, Thompson CB. Intracellular alpha-ketoglutarate maintains the pluripotency of embryonic stem cells. Nature 2015;518:413–6 [DOI] [PMC free article] [PubMed] [Google Scholar]
- 59.Jin SG, Jiang Y, Qiu R, Rauch TA, Wang Y, Schackert G, et al. 5-Hydroxymethylcytosine is strongly depleted in human cancers but its levels do not correlate with IDH1 mutations. Cancer Res 2011;71:7360–5 [DOI] [PMC free article] [PubMed] [Google Scholar]
- 60.Haffner MC, Chaux A, Meeker AK, Esopi DM, Gerber J, Pellakuru LG, et al. Global 5-hydroxymethylcytosine content is significantly reduced in tissue stem/progenitor cell compartments and in human cancers. Oncotarget 2011;2:627–37 [DOI] [PMC free article] [PubMed] [Google Scholar]
Associated Data
This section collects any data citations, data availability statements, or supplementary materials included in this article.