

Abstract
The diversity of the predominant bacteria in the human gastrointestinal tract was studied by using 16S rRNA-based approaches. PCR amplicons of the V6 to V8 regions of fecal 16S rRNA and ribosomal DNA (rDNA) were analyzed by temperature gradient gel electrophoresis (TGGE). TGGE of fecal 16S rDNA amplicons from 16 individuals showed different profiles, with some bands in common. Fecal samples from two individuals were monitored over time and showed remarkably stable profiles over a period of at least 6 months. TGGE profiles derived from 16S rRNA and rDNA amplicons showed similar banding patterns. However, the intensities of bands with similar mobilities differed in some cases, indicating a different contribution to the total active fraction of the prominent fecal bacteria. Most 16S rRNA amplicons in the TGGE pattern of one subject were identified by cloning and sequence analysis. Forty-five of the 78 clones matched 15 bands, and 33 clones did not match any visible band in the TGGE pattern. Nested PCR of amplified 16S rDNA indicated preferential amplification of a sequence corresponding to 12 of the 33 nonmatching clones with similar mobilities in TGGE. The sequences matching 15 bands in the TGGE pattern showed 91.5 to 98.7% homology to sequences derived from different Clostridium clusters. Most of these were related to strains derived from the human intestine. The results indicate that the combination of cloning and TGGE analysis of 16S rDNA amplicons is a reliable approach to monitoring different microbial communities in feces.
The human gastrointestinal tract harbors a diverse community of microorganisms which include a large number of mainly anaerobic bacteria. These have largely been studied by plate count analysis of fecal samples, which usually contain 1010 to 1011 CFU per g (9, 13, 29). One of the limitations in using conventional microbiological methods is that only easily cultivable organisms are counted. Bacteria which have obligate interactions with the host or other microorganisms, or which require unknown growth conditions, will not be selected this way. Estimates of culturability of bacteria in the gastrointestinal tract vary from 10 to 50% (16, 20, 37). Other limitations of cultivation include the selectivity of the medium used, the stress imposed by cultivation procedures, and the necessity of strictly anoxic conditions. As a consequence, insight into the interaction between the host and the microbial community, and into the influence of environmental factors on microbial composition, is still lacking.
This decade has shown an explosive development in the application of molecular techniques based on 16S and 23S rRNA to the study of microbial diversity in ecosystems (reviewed in references 1 and 32). So far, the rRNA approach has been used only incidentally to study human intestinal microbial ecology, and only specific groups of bacteria, such as Bifidobacterium and Lactobacillus, have been studied (16, 19). In addition, PCR has been used to quantify specific groups of bacteria in human feces (35), and random cloning approaches have been used to analyze the microbial diversity of feces from one individual (37). Although these studies report significant information on specific bacteria and specific individuals, the approaches are time-consuming, expensive, and unsuitable for characterizing complex microbial communities. Methods such as denaturing gradient gel electrophoresis (10) or temperature gradient gel electrophoresis (TGGE) (28) have been developed to analyze microbial communities rapidly, based on sequence-specific separation of 16S rDNA amplicons (8, 22). The aim of the present study was to use molecular approaches to describe the bacterial diversity in human fecal samples and to investigate to what extent this diversity is affected by the host. We analyzed PCR-amplified V6 to V8 regions of 16S rRNA (23) by TGGE to describe the diversity of the predominant bacteria in fecal samples. Since the ratio of 16S ribosomal DNA (rDNA) and rRNA is dependent on cellular activity (33), we compared TGGE patterns derived from 16S rRNA and rDNA amplicons. Finally, to gain insight into the phylogenetic positions of the most prominent bacteria, we prepared a 16S rDNA clone library and sequenced clones corresponding to dominant bands in the TGGE pattern of a single individual.
MATERIALS AND METHODS
Experimental approach.
To describe the bacterial diversity in the human gastrointestinal tract, we used a molecular approach based on the sequence variability of the 16S rRNA gene (Fig. 1). RNA and DNA were simultaneously isolated from fecal samples and were used as templates for amplification by reverse transcriptase PCR (RT-PCR) and regular PCR, respectively, of fragments of the 16S rRNA gene. Amplicons of the V6 to V8 regions were analyzed by TGGE. Migration distances from different gels were compared by using a marker which consisted of amplified V6 to V8 regions from nine clones with different mobilities. Additionally, a clone library of 16S rDNA amplicons (Escherichia coli positions 8 to 1510) from a fecal sample of one individual was prepared. The mobilities of cloned amplicons were screened by TGGE, and those corresponding to specific bands in the RNA-derived profile were sequenced.
FIG. 1.

Outline of the molecular approaches used to analyze the fecal bacterial communities. PCR 968-1401 represents the RT-PCR with primers U968-GC and L1401, which amplify the V6 to V8 regions. PCR 8-1510 represents the PCR with primers 8f and 1510r, which amplify the complete 16S rDNA.
Recovery, preparation, and storage of fecal samples.
Fresh fecal samples were collected from 16 unrelated individuals (A to P) from different geographical locations within The Netherlands and Finland, differing in dietary preferences, age (25 to 78 years), and sex (7 men and 9 women). Four fecal samples from individual A (male; 25 years old) were taken within a 6-month period at 2-month intervals, and two samples from individual B (female; 43 years old) were taken within a 7-month period. Three grams (wet weight) of fecal samples was homogenized in 50 ml of ice-cold 0.05 M potassium phosphate buffer (pH 7.0), and aliquots of 1 ml were stored at −20°C.
Parallel RNA and DNA isolation.
Fecal samples (1 ml) were centrifuged at 9,000 × g for 5 min. The pellets were resuspended in 1 ml of a buffer containing 10 mM Tris-HCl (pH 8.0) and 150 mM NaCl (6). After the addition of 150 μl of acid phenol, consisting of phenol buffered in a solution containing 10 mM sodium acetate (pH 5.0) and 140 mM NaCl (6), 0.3 g of zirconium beads (diameter, 0.1 mm) was added. The samples were treated at 5,000 rpm for 3 min in a mini-bead beater (Biospec Products, Bartlesville, Okla.). After the addition of 150 μl of CI solution, consisting of chloroform and isoamyl alcohol in a 24:1 (vol/vol) ratio, the tubes were vortexed briefly and centrifuged for 5 min at 15,000 × g. The aqueous phase was split in two aliquots of 0.5 ml, one for RNA isolation and one for DNA isolation.
For RNA isolation, phenol-chloroform extractions were performed with 150 μl of acid phenol and 150 μl of CI solution. These steps were repeated until a clear interface between the aqueous and phenol-chloroform layers was obtained after centrifugation. Subsequently, an extraction with 300 μl of CI solution was performed. Finally, nucleic acids were precipitated with 2 volumes of ethanol and 1/10 volume of 3 M sodium acetate (pH 5.2) at −20°C for 30 min. After centrifugation at 15,000 × g for 20 min, the pellet was washed with 500 μl of 70% ethanol, air dried, and resuspended in 500 μl of a buffer containing 20 mM Tris-HCl (pH 7.5), 10 mM NaCl, 6 mM MgCl2, and 10 mM CaCl2 (6). Five units of RNase-free DNase (Promega, Madison, Wisc.) was added, followed by incubation at 37°C for 30 min. After phenol-chloroform extractions, RNA was precipitated as previously described and resuspended in 100 μl of 10 mM Tris-HCl (pH 8.0). The RNA solutions were checked for the presence of residual amounts of DNA by performing PCR as described in the section “RT-PCR and PCR amplification.” When necessary, the DNase treatment was repeated to eliminate all DNA.
For the parallel DNA isolation, 50 μl of 3 M sodium acetate (pH 5.2) was added to the residual aliquots. Subsequently, phenol-chloroform extractions were performed with 150 μl of phenol buffered in TE, which consisted of 10 mM Tris-HCl (pH 8.0) and 1 mM EDTA (18), and 150 μl of CI solution. After an additional chloroform extraction, DNA was precipitated with 2 volumes of ethanol at −20°C for 30 min. After centrifugation and washing with 70% ethanol, the pellet was resuspended in 500 μl of TE. Five units of DNase-free RNase (Promega) was added, and the sample was incubated at 37°C for 15 min. After phenol-chloroform extractions and an extraction with chloroform only, DNA was precipitated as before and resuspended in 100 μl of TE.
The amount and integrity of the nucleic acids was determined visually after electrophoresis on a 1.2% agarose gel containing ethidium bromide.
RT-PCR and PCR amplification.
Primers U968-GC (5′ CGC CCG GGG CGC GCC CCG GGC GGG GCG GGG GCA CGG GGG GAA CGC GAA GAA CCT TAC) and L1401 (5′ GCG TGT GTA CAA GAC CC) (24) were used to amplify the V6 to V8 regions of the bacterial 16S rRNA. The GC clamp in primer U968-GC creates RT-PCR products suitable for separation by TGGE (22).
RT-PCR was performed with the Geneamp Thermostable rTth Reverse Transcriptase RNA PCR kit (Perkin-Elmer, Norwalk, Conn.). Reverse transcriptase reaction mixtures of 10 μl contained 10 mM Tris-HCl (pH 8.3), 90 mM KCl, 1 mM MnCl2, 200 mM each deoxynucleoside triphosphate (dNTP), 2.5 U of rTth DNA polymerase, 7.5 pmol of primer L1401, and 1 μl of 10-times-diluted RNA (approximately 5 ng). The mixtures were incubated at 68°C for 15 min. After this incubation, 40 μl of the PCR additive was added. The additive consisted of 5% glycerol, 10 mM Tris-HCl (pH 8.3), 100 mM KCl, 0.05% Tween 20, 0.75 mM EGTA, 3.75 mM MgCl2, 50 mM each dNTP, and 7.5 pmol of primer U968-GC. The samples were amplified in a Geneamp PCR system 2400 (Perkin-Elmer) by using the following program: 94°C for 1 min; 30 cycles of 94°C for 30 s, 56°C for 30 s, and 68°C for 1 min; and finally, 68°C for 7 min. Aliquots of 5 μl were analyzed by electrophoresis on a 1.2% (wt/vol) agarose gel containing ethidium bromide to check the sizes and amounts of the amplicons.
PCR was performed with the Taq DNA polymerase kit from Life Technologies (Gaithersburg, Md.). PCR mixtures of 50 μl contained 20 mM Tris-HCl (pH 8.4), 50 mM KCl, 3 mM MgCl2, 50 mM each dNTP, 1.25 U of Taq polymerase, 5 pmol of the primers L1401 and U968-GC, and 1 μl of 10-times-diluted DNA (approximately 1 ng). Amplification and analysis by agarose gel electrophoresis were performed as described above for the RT-PCR, with the exception that the first incubation at 94°C was performed for 3 min instead of 1 min.
Cloning of the PCR-amplified products.
PCR was performed with primers 8f [5′ CAC GGA TCC AGA GTT TGA T(C/T)(A/C) TGG CTC AG] and 1510r [5′ GTG AAG CTT ACG G(C/T)T ACC TTG TTA CGA CTT] (15) by using the Taq DNA polymerase kit from Life Technologies to amplify the bacterial 16S rDNA. PCR was performed under the following conditions: 94°C for 3 min; 30 cycles of 94°C for 30 s, 52°C for 30 s, and 68°C for 1.5 min; and finally 68°C for 7 min. The PCR products were purified with the Qiaquick PCR purification kit (Qiagen, Hilden, Germany) according to the manufacturer’s instructions. Purified PCR products were quantified by electrophoresis on a 1.2% (wt/vol) agarose gel with a DNA solution of known concentration as the concentration standard and were cloned in E. coli JM109 by using the Promega pGEM-T vector system. Colonies of ampicillin-resistant transformants were transferred with a sterile toothpick to 50 μl of TE and were boiled for 15 min to lyse the cells. Subsequently, PCR was performed with pGEM-T-specific primers T7 (5′ AAT ACG ACT CAC TAT AGG) and SP6 (5′ ATT TAG GTG ACA CTA TAG) to check the size of the inserts by using the cell lysates as the template. The plasmids containing inserts of approximately 1.6 kb in the cell lysates were used to amplify the V6 to V8 regions. The amplified V6 to V8 regions were compared to the rRNA-derived TGGE profile from the same fecal sample. Plasmids containing an insert of a clone corresponding to a dominant band were purified by the Wizard Plus miniprep DNA purification system (Promega) and were used for sequence analysis.
TGGE analysis of PCR amplicons.
The Diagen (Düsseldorf, Germany) TGGE system was used for sequence-specific separation of RT-PCR products. Electrophoresis was performed in a 0.8-mm polyacrylamide gel (6% [wt/vol] acrylamide, 0.1% bisacrylamide, 8 M urea, 20% [vol/vol] formamide, 2% [vol/vol] glycerol) with 40 mM Tris-acetate (pH 8.0) as the electrophoresis buffer at a fixed voltage of 120 V (±9 mA) for 18 h. A gradient from 36 to 45°C was applied parallel to the electrophoresis running direction. After the completion of electrophoresis, the gel was stained with AgNO3 and developed (3).
Sequence analysis.
Purified plasmid DNA (1 μl) was used for sequence analysis of the cloned 16S rDNA by using the Sequenase (T7) sequencing kit (Amersham, Slough, United Kingdom) according to the manufacturer’s instructions with Infrared Dye 41 (MWG-Biotech, Ebersberg, Germany)-labeled primers 515r (5′ ACC GCG GCT GCT GGC AC) (15), 338f (5′ ACT CCT ACG GGA GGC AGC), and 968f (5′ AAC GCG AAG AAC CTT AC) (24) as sequencing primers. The sequences were automatically analyzed on a LI-COR (Lincoln, Nebr.) DNA sequencer 4000L and corrected manually. The fraction of unidentified bases was 1% or less. The sequences were checked for reading errors with the alignment programs of the ARB package, which are based on secondary structures of rRNA (31). Homology searches of the ARB, EMBL, and GenBank DNA databases for these partial sequences were performed with FASTA (25), and the homologies were checked with the ARB programs. The complete 16S rDNA sequences were checked for chimerical constructs by using the CHECK-CHIMERA program of the Ribosomal Database Project (17) and the ARB software package.
Nucleotide sequence accession numbers.
The sequences of the fecal rDNA clones were deposited in the GenBank database. The new sequences from subject A (with their accession numbers in parentheses) are A03 (AF052408), A07 (AF052409), A09 (AF052410), A10 (AF052411), A11 (AF052412), A12 (AF052413), A13 (AF052414), A14 (AF052415), A19 (AF052416), A20 (AF052417), A21 (AF052418), A22 (AF052419), A27 (AF052420), A54 (AF052421), A57 (AF052422), and A71 (AF052423).
RESULTS
Nucleic acid extraction and reproducibility of TGGE patterns.
Nucleic acids were extracted from the fecal samples by a mechanical procedure which has been shown to be effective in disrupting bacterial cells from a variety of ecosystems (6, 11, 26, 37). To optimize the efficiency of the nucleic acid extraction, the effect of increased bead-beating time on the concentration of the nucleic acids, as well as on their integrity and competence to generate a reproducible TGGE pattern, was determined. With 1 to 5 min of bead beating, no effect on the amount of nucleic acids extracted or on their integrity, as analyzed by agarose gel electrophoresis (data not shown), was observed. No nucleic acids were detected in the samples that had not been subjected to the bead-beating procedure or in the supernatant of the potassium phosphate buffer used to homogenize the fecal samples, indicating that lysis was limited. The TGGE patterns of the rRNA-based amplicons of fecal samples tested remained constant after increased bead-beating time (data not shown). However, in the rDNA-derived pattern of subject A, a new amplicon appeared only after 3 min of bead beating, suggesting the presence of a bacterium which was difficult to lyse (Fig. 2). Since further treatment did not affect the TGGE profiles, 3 min of bead beating was used in further experiments.
FIG. 2.
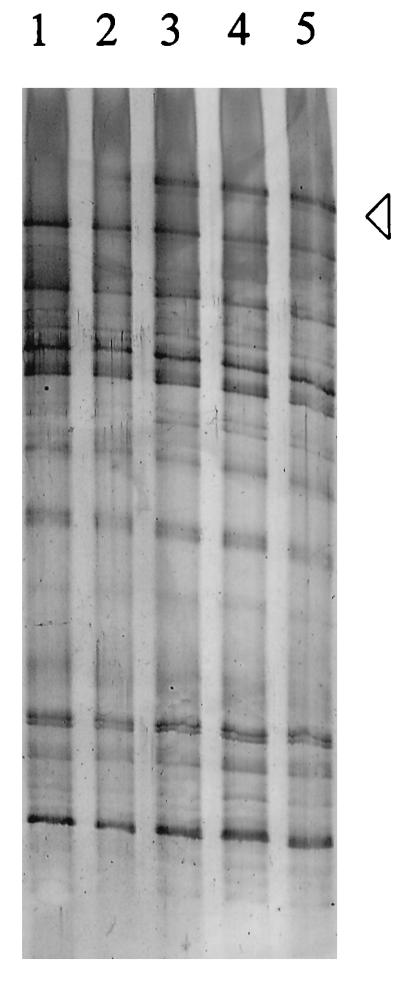
Optimization of nucleic acid extraction. Lanes 1 to 5 show the TGGE patterns of amplified V6 to V8 regions of DNA extracted after 1, 2, 3, 4, and 5 min of bead beating, respectively. The arrowhead points to the dominant band in the pattern, which appeared after at least 3 min of bead beating.
The effect of template concentration on the TGGE profile was studied by amplifying fecal rRNA and rDNA at different concentrations. Dilution to approximately 10 pg of DNA/μl or 1 pg of RNA/μl did not affect the TGGE profiles. However, further dilutions resulted in the disappearance of faint bands (data not shown). This indicated that the TGGE profiles were derived from 16S rRNA and 16S rDNA that were present in abundance, suggesting that they reflect the most prominent bacteria.
To determine the detection limits of the methods used, the amplified V6 to V8 regions of a cloned 16S rRNA gene were added at different concentrations to fecal V6 to V8 amplicons before TGGE analysis. Band intensities of the diluted amplicons from the clone and the fecal amplicons were compared (data not shown). This competitive-PCR approach indicated that the difference between concentrations of amplicons resulting in a dominant or a faint band was maximally 1 order of magnitude, indicating that only 90 to 99% of the amplicons can be visualized by TGGE.
The possibility of preferential amplification (27) was checked by analyzing TGGE profiles of PCR products generated after different numbers of cycles of amplification. Amplicons obtained after 25 cycles or fewer had to be concentrated. No difference was observed in the TGGE patterns of amplicons obtained after 20, 25, 30, and 35 cycles of amplification. The dominant bands of these patterns were also present in the TGGE profiles of amplicons obtained after 10 cycles, which contained large amounts of single-stranded DNA, preventing further detailed comparison (data not shown). Since the extent of the amplification had no apparent effect on the TGGE pattern of the amplicons, we used 30 cycles of amplification in further experiments. The TGGE pattern obtained in this way shows a mixture of dominant and faint bands that were separated when the applied temperature gradient was used (Fig. 2). Careful analysis of this TGGE pattern and others revealed the presence of more than 30 prominent amplicons of different mobilities (Fig. 2).
Comparison between RNA- and DNA-derived TGGE profiles.
TGGE profiles derived from fecal RNA and DNA amplicons were compared in order to determine the expression levels of the 16S rRNA genes of the most prominent bacteria, which may reflect their contributions to total activity (Fig. 3). The TGGE patterns derived from RNA and DNA from the same fecal sample were highly similar. However, some bands were more prominent in the RNA-derived profile than in the DNA-derived profile in both subjects, indicating that these bacteria could be very active metabolically. In contrast, few bands in the rRNA-derived pattern were faint, while bands at this position in the DNA-derived pattern were more prominent in both subjects. Such bands probably represent predominant bacteria in the feces that became inactive at the end of the large intestine.
FIG. 3.

Comparison between TGGE patterns of PCR and RT-PCR products of the V6 to V8 regions from simultaneous rRNA and DNA isolations of fecal samples from individuals A and B (two replicates each). Solid arrowheads indicate bands with higher intensities in DNA- than in RNA-derived patterns. Open arrowheads indicate bands of higher intensities in RNA- than in DNA-derived patterns. Numbers 1 to 3 represent dominant bands found in all TGGE profiles.
Host-dependent TGGE patterns.
TGGE analysis of PCR products of fecal samples from 14 individuals (Fig. 4) was performed, and their TGGE profiles were compared to those of PCR products from individuals A and B (Fig. 3). Remarkable differences in individual banding patterns were observed. Differences were found in both the positions of specific bands and the number of bands (up to 38 in the profile of subject profile C). While most prominent bands were found at different positions, some distinct bands were observed in all fecal samples (indicated in Fig. 3 and 4). This indicates that each individual harbors a specific bacterial community in the intestine but that a few dominant bacterial species may be present in many individuals.
FIG. 4.

TGGE of PCR products of the V6 to V8 regions of fecal samples from individuals C to Q (from Finland). Numbers 1 to 3 represent dominant bands found in all TGGE profiles.
Stability of TGGE patterns over time.
Since the observed differences in banding patterns could also be influenced by temporal variation, the fecal samples of two healthy individuals, A and B, were monitored over time (Fig. 5). Four samples from individual A were taken within a period of 6 months. The two fecal samples from individual B were taken within a period of 7 months. In both individuals, the RNA-derived banding patterns were highly constant over a period of approximately half a year. Only some slight differences in the intensities of the bands were observed in both individuals. Similar results were found in the DNA-derived patterns (data not shown). This indicates that the dominant microbial composition remains quite constant over time for these healthy individuals.
FIG. 5.

(A) TGGE of RT-PCR products of the V6 to V8 regions of four fecal samples from individual A taken at different times during a period of 6 months. (B) TGGE of RT-PCR products of the V6 to V8 regions of two fecal samples from individual B taken after 0 and 7 months.
Phylogenetic analysis of dominant bands in a TGGE pattern.
To gain insight into the phylogenetic positions of the predominant bacteria, 16S rDNA from fecal samples of individual A was amplified and cloned into E. coli JM109 by using pGEM-T. The V6 to V8 regions of the 16S rDNA of the cell lysates of 78 transformants were amplified, and their mobilities after TGGE were compared to the rRNA-derived pattern of individual A (Fig. 1). In this way, 45 clones were each assigned to 1 of the 15 prominent bands in the TGGE pattern, while 33 did not match any of the detectable bands (Fig. 6). Twelve of the 33 clones which did not match any band in the pattern showed similar mobilities during TGGE. The sequence showed the highest homology (98.9%) to an unidentified rumen bacterium (GenBank accession no. AF018503) (36a). The next closest relative was Prevotella veroralis (89.9%). Nested amplification of the V6 to V8 regions of the 16S rDNA amplicons showed the appearance of this band in the pattern (data not shown), indicating a preferential amplification of this sequence in the first PCR amplification.
FIG. 6.

Identification of dominant bands in the RT-PCR pattern of the V6 to V8 regions of fecal samples from individual A. Listed are the closest relatives of the clones corresponding to the bands, their percent identity, the number of corresponding clones, and the sequence analysis. #, the V1 to V3 regions of two clones with identical mobility have been sequenced. P, partial 16S rDNA sequence; C, complete sequence. Amplicons encoded with 1, 2, and 3 were found in the TGGE patterns of all subjects.
For identification of the prominent bands in the rRNA-derived TGGE pattern, the plasmid DNA from the corresponding clone was purified and the nucleotide sequence of the 16S rDNA insert was determined and compared to the 16S rRNA databases. Among the sequences of the 15 prominent amplicons, only 2 showed more than 97% similarity (Fig. 6). This indicates that the majority of the sequences were derived from new, as yet undescribed bacterial species. The phylogenetic positions of these 15 sequences were located in different Clostridium clusters of the low-G+C gram-positive species (4).
Since their partial sequences showed low similarities to the sequences of the closest relatives in the databases, seven clones were completely sequenced, analyzed, and checked for chimerical constructs. The percentages of identity to the closest relatives were similar to those of the partial sequences.
In order to estimate whether bands in the TGGE profiles originated from one or more sequences, pairs of 16S rDNA clones which gave identical TGGE band positions in the V6 to V8 regions were further sequenced. Three pairs of clones were analyzed in this way. Two pairs corresponded to two bands in the TGGE profile of subject A (Fig. 6), and one pair corresponded to the band which originated from the preferentially amplified sequence. Each pair of clones showed more than 99.5% identity in the V1 to V3 regions, indicating that each band harbors only one type of sequence.
DISCUSSION
In this study we have shown that TGGE analysis of the V6 to V8 amplicons of fecal 16S rRNA and rDNA is a powerful tool for analysis of complex microbial communities in fecal samples. TGGE patterns were unique for each individual. Since no major changes in banding patterns were found during amplification or dilution of the template, the differences in the patterns must reflect the differences in fecal composition among individuals. The results indicate that each individual has his or her own personal and unique microbial community, extending previous work based on the composition of Lactobacillus spp. and Bifidobacterium spp. (19) in selective plate counts (9, 13, 19, 29).
RT-PCR products and PCR products from the same fecal sample were very similar. Because eubacterial primers which show very limited efficiency in the amplification of Archaea and Eucarya have been used, the TGGE pattern reflects the predominant bacteria in fecal samples. The differences between intensities of specific bands in the 16S rDNA- and 16S rRNA-derived patterns are most probably due to differences in the activities of different groups of bacteria. The amount of rRNA per cell is dependent on the type of species and the physiological condition of the cell. In addition, differences in the copy number of the rRNA operon per species (2) also play a role in differences in intensity. Some bacteria which have reached high numbers in the intestine could have been inactivated by losing contact with the mucosa or by exposure to oxygen during the collection of the fecal samples.
In comparisons of the TGGE profiles of fecal samples with those of clones, it appeared that 42% of the clones did not match any band in the TGGE profile. Twelve clones with similar mobilities during TGGE did not correspond to any dominant band in the rRNA- and rDNA-derived profiles of individual A. The partial sequence showed the highest homology with an unidentified rumen bacterium and was grouped in the Prevotella cluster. However, this amplicon was found in the DNA-derived pattern after nested amplification of the V6 to V8 regions of amplified 16S rDNA. This result supports the existence of PCR and cloning biases as reported previously (27, 32, 34, 37). Another reason for the difference between the results of cloning and TGGE analysis was described by Felske et al. (7). Analysis of a PCR amplicon by TGGE visualizes only the dominant fraction of the population, while a cloning approach randomly selects 16S rDNA amplicons. As a consequence, hundreds of bacteria which represent a numerically important part of the total community do not form visible bands in the TGGE profiles, although some of them will be selected by cloning.
The 15 clones corresponding to dominant bands in the TGGE patterns of individual A showed the highest homology with sequences derived from different Clostridium clusters (4). Only two partial 16S rDNA sequences showed more than 97% identity to a sequence in the databases. The other complete and partial 16S rDNA sequences did not match any of the sequences found in the ARB, GenBank, and EMBL databases. Furthermore, their similarities were below the 97% threshold for being considered the same species (30), and they could therefore be considered to be derived from new bacterial species. The identity values of clones corresponding to Coprococcus eutactus could be underestimated, since the sequence of this species in the databases contains a large number of unidentified nucleotides.
Two complete sequences corresponding to two bands in the TGGE pattern showed the highest homology with Clostridium celerecrescens. These sequences showed 97.5% identity and differed by at least 9 bases in the V6 to V8 regions. This explains the different locations of these clones in the TGGE profiles. Ruminococcus obeum-like and Fusobacterium prausnitzii-like amplicons were also found several times among the most prominent bacteria. Previously, similar observations have been reported for closely related Bacillus benzoevorans-like sequences in Drentse A grassland soils (8). These observations could be due to 16S rDNA sequence heterogeneity of bacterial strains (24). However, one of the three R. obeum-like sequences derived from a species which was difficult to lyse, indicating the presence of at least two different types of R. obeum-like species.
Sequences derived from R. obeum showed high-intensity bands in both rRNA- and rDNA-derived patterns in individual A, and they could therefore be considered numerically important in composition and in the total activity. The genera Ruminococcus and Coprococcus are anaerobic cocci, and members of this group, especially Ruminococcus and Peptostreptococcus, have been found numerically important in fecal samples (9, 21).
Clones corresponding to two dominant bands showed the highest homology with an F. prausnitzii sequence described previously (36). It was reported that this sequence was not clustering in the Fusobacterium group and that this strain was one of the most common species in human feces, based on PCR quantitation (35, 36). F. prausnitzii, and also Roseburia cecicola and Butyrivibrio fibrisolvens, are known to be gram-negative species but are phylogenetically related to low-G+C gram-positive species in the Clostridium group described by Collins et al. (4).
The other clones traced in the TGGE profiles showed the highest homology to Eubacterium spp. and Ruminococcus productus (also known as Peptostreptococcus productus) (5). Eubacterium plautii was found as an endosymbiont of Entamoeba histolytica (12). The other eubacteria have been found previously in human fecal samples (9, 21).
All individual-specific patterns had some bands in common. Sequences corresponding to these bands were found in the clone library and showed the highest homologies to R. obeum, Eubacterium hallii, and F. prausnitzii. This indicates that these bacteria have an important function at the end of the gastrointestinal tract in all individuals. Eubacteria and ruminococci are known to have a fermentative metabolism, while fusobacteria in general have a weakly fermentative metabolism (14).
Surprisingly, Bacteroides spp. were not found in the TGGE profile of subject A. Since we used bacterial primers, we did not select to the benefit of Bacteroides spp. The TGGE profile represents only 90 to 99% of the total bacterial community. This means that bacteria which reach levels of 109 cells or fewer (this number is not unusual for Bacteroides spp.) per g of feces will not be visualized on TGGE, assuming that 1 g of feces contains 1011 cells.
Overall, it can be concluded that the results support the hypothesis that each healthy person has his or her own unique fecal flora and that the dominant active flora is stable over time. Since the individuals were unrelated, were of different ages, and had different dietary preferences, the reasons for this uniqueness are likely to be found in host factors. The conclusions are based on an approach which could be biased by irregular cell lysis and primer specificity, which are general drawbacks of molecular microbial ecology. Even though the quality and reproducibility of the extraction of nucleic acids and their amplification have been investigated, the possibility that some important, hitherto unknown bacteria were missed cannot be excluded. The approach reported here can be useful in studying the effects of certain diets, food components, probiotics, prebiotics, and antibiotics, as well as the genetic background of the host, on the stability and composition of the dominant microbial community.
ACKNOWLEDGMENTS
This study was partly supported by VTT Biotechnology and Food Research (Helsinki, Finland).
We thank all individuals who provided the fecal samples for this study. In particular, we thank Atte von Wright and Minna Alander from VTT Biotechnology and Food Research for sending us the fecal samples from the Finnish individuals.
REFERENCES
- 1.Amann R I, Ludwig W, Schleifer K-H. Phylogenetic identification and in situ detection of individual microbial cells without cultivation. Microbiol Rev. 1995;59:143–169. doi: 10.1128/mr.59.1.143-169.1995. [DOI] [PMC free article] [PubMed] [Google Scholar]
- 2.Bentley R W, Leigh J A. Determination of 16S ribosomal RNA gene copy number in Streptococcus uberis, S. agalactiae, S. dysgalactiae and S. parauberis. FEMS Immunol Med Microbiol. 1995;12:1–8. doi: 10.1111/j.1574-695X.1995.tb00167.x. [DOI] [PubMed] [Google Scholar]
- 3.Cairns M J, Murray V. Rapid silver staining and recovery of PCR products separated on polyacrylamide gels. BioTechniques. 1994;17:915–919. [PubMed] [Google Scholar]
- 4.Collins M D, Lawson P A, Willems A, Cordoba J J, Fernandez-Garayzabal J, Garcia P, Cai J, Hippe H, Farrow J A E. The phylogeny of the genus Clostridium: proposal of five new genera and eleven new species combinations. Int J Syst Bacteriol. 1994;44:812–826. doi: 10.1099/00207713-44-4-812. [DOI] [PubMed] [Google Scholar]
- 5.Ezaki T, Li N, Hashimoto Y, Miura H, Yamamoto H. 16S ribosomal DNA sequences of anaerobic cocci and proposal of Ruminococcus hansenii comb. nov. and Ruminococcus productus comb. nov. Int J Syst Bacteriol. 1994;44:130–136. doi: 10.1099/00207713-44-1-130. [DOI] [PubMed] [Google Scholar]
- 6.Felske A, Engelen B, Nübel U, Backhaus H. Direct ribosome isolation from soil to extract bacterial rRNA for community analysis. Appl Environ Microbiol. 1996;62:4162–4167. doi: 10.1128/aem.62.11.4162-4167.1996. [DOI] [PMC free article] [PubMed] [Google Scholar]
- 7.Felske A, Rheims H, Wolterink A, Stackebrandt E, Akkermans A D L. Ribosome analysis reveals prominent activity of an uncultured member of the class Actinobacteria in grassland soils. Microbiology. 1997;143:2983–2989. doi: 10.1099/00221287-143-9-2983. [DOI] [PubMed] [Google Scholar]
- 8.Felske A, Wolterink A, van Lis R, Akkermans A D L. Phylogeny of the main bacterial 16S rRNA sequences in Drentse A Grassland soils. Appl Environ Microbiol. 1998;64:871–879. doi: 10.1128/aem.64.3.871-879.1998. [DOI] [PMC free article] [PubMed] [Google Scholar]
- 9.Finegold S M, Sutter V L, Mathisen G E. Normal indigenous intestinal flora. In: Hentges D J, editor. Human intestinal microflora in health and disease. New York, N.Y: Academic Press; 1983. pp. 3–31. [Google Scholar]
- 10.Fischer S G, Lerman L S. Length-independent separation of DNA restriction fragments in two-dimensional gel electrophoresis. Cell. 1979;16:191–200. doi: 10.1016/0092-8674(79)90200-9. [DOI] [PubMed] [Google Scholar]
- 11.Harmsen H J M, Stams A J M, Akkermans A D L, de Vos W M. Phylogenetic analysis of two syntrophic propionate-oxidizing bacteria in enrichment cultures. Syst Appl Microbiol. 1995;18:67–73. [Google Scholar]
- 12.Hofstad T, Aasjord P. Eubacterium plautii (Séguin 1928) comb. nov. Int J Syst Bacteriol. 1982;32:346–349. [Google Scholar]
- 13.Holdeman L V, Good I J, Moore W E C. Human fecal flora: variation in bacterial composition within individuals and a possible effect of emotional stress. Appl Environ Microbiol. 1976;31:359–375. doi: 10.1128/aem.31.3.359-375.1976. [DOI] [PMC free article] [PubMed] [Google Scholar]
- 14.Holt J G, Krieg N R, Sneath P H A, Staley J T, Williams S T. Bergey’s manual of determinative bacteriology. 9th ed. Baltimore, Md: The Williams and Wilkins Co.; 1994. [Google Scholar]
- 15.Lane D J. 16S/23S rRNA sequencing. In: Stackebrandt E, Goodfellow M, editors. Nucleic acid techniques in bacterial systematics. J. Chichester, United Kingdom: Wiley & Sons; 1991. pp. 115–175. [Google Scholar]
- 16.Langendijk P S, Schut F, Jansen G J, Raangs G C, Kamphuis G R, Wilkinson M H F, Welling G W. Quantitative fluorescence in situ hybridization of Bifidobacterium spp. with genus-specific 16S rRNA-targeted probes and its application in fecal samples. Appl Environ Microbiol. 1995;61:3069–3075. doi: 10.1128/aem.61.8.3069-3075.1995. [DOI] [PMC free article] [PubMed] [Google Scholar]
- 17.Maidak B L, Olsen G J, Larsen N, Overbeek R, McCaughey M J, Woese C J. The RDP (Ribosomal Database Project) Nucleic Acids Res. 1997;25:109–111. doi: 10.1093/nar/25.1.109. [DOI] [PMC free article] [PubMed] [Google Scholar]
- 18.Maniatis T, Fritsch E F, Sambrook J. Molecular cloning: a laboratory manual. 2nd ed. Cold Spring Harbor, N.Y: Cold Spring Harbor Laboratory; 1989. [Google Scholar]
- 19.McCartney A L, Wenzhi W, Tannock G W. Molecular analysis of the composition of the bifidobacterial and lactobacillus microflora of humans. Appl Environ Microbiol. 1996;62:4608–4613. doi: 10.1128/aem.62.12.4608-4613.1996. [DOI] [PMC free article] [PubMed] [Google Scholar]
- 20.McFarlene G T, Gibson G R. Metabolic activities of the normal colonic microflora. In: Gibson S A W, editor. Human health: contribution of microorganisms. Frankfurt, Germany: Springer; 1994. pp. 17–38. [Google Scholar]
- 21.Moore W E C, Holdeman L V. Human fecal flora: the normal flora of 20 Japanese-Hawaiians. Appl Microbiol. 1974;27:961–979. doi: 10.1128/am.27.5.961-979.1974. [DOI] [PMC free article] [PubMed] [Google Scholar]
- 22.Muyzer G, de Waal E C, Uitterlinden G A. Profiling of complex populations by denaturating gradient gel electrophoresis analysis of polymerase chain reaction-amplified genes coding for 16S rRNA. Appl Environ Microbiol. 1993;59:695–700. doi: 10.1128/aem.59.3.695-700.1993. [DOI] [PMC free article] [PubMed] [Google Scholar]
- 23.Neefs, J., Y. van der Peer, L. Hendriks, and R. de Wachter. 1990. Compilation of small ribosomal subunit RNA sequences. Nucleic Acids Res. 18(Suppl.):2237–2317. [DOI] [PMC free article] [PubMed]
- 24.Nübel U, Engelen B, Felske A, Snaidr J, Wieshuber A, Amann R I, Ludwig W, Backhaus H. Sequence heterogeneities of genes encoding 16S rRNAs in Paenibacillus polymyxa detected by temperature gradient gel electrophoresis. J Bacteriol. 1996;178:5636–5643. doi: 10.1128/jb.178.19.5636-5643.1996. [DOI] [PMC free article] [PubMed] [Google Scholar]
- 25.Pearson W R, Lipman D J. Improved tools for biological sequence comparison. Proc Natl Acad Sci USA. 1988;85:2444–2448. doi: 10.1073/pnas.85.8.2444. [DOI] [PMC free article] [PubMed] [Google Scholar]
- 26.Ramírez-Saad H C, Akkermans W M, Akkermans A D L. DNA extraction from actinorhizal nodules. In: Akkermans A D L, van Elsas J D, de Bruijn F J, editors. Molecular microbial ecology manual. Dordrecht, The Netherlands: Kluwer Academic Publishers; 1996. pp. 1–11. [Google Scholar]
- 27.Reysenbach A, Giver L J, Wickham G S, Pace N R. Differential amplification of rRNA genes by polymerase chain reaction. Appl Environ Microbiol. 1992;58:3417–3418. doi: 10.1128/aem.58.10.3417-3418.1992. [DOI] [PMC free article] [PubMed] [Google Scholar]
- 28.Rosenbaum V, Riesner D. Temperature-gradient gel electrophoresis—thermodynamic analysis of nucleic acids and proteins in purified form and in cellular extracts. Biophys Chem. 1987;26:235–246. doi: 10.1016/0301-4622(87)80026-1. [DOI] [PubMed] [Google Scholar]
- 29.Savage D C. Microbial ecology of the gastrointestinal tract. Annu Rev Microbiol. 1977;31:107–133. doi: 10.1146/annurev.mi.31.100177.000543. [DOI] [PubMed] [Google Scholar]
- 30.Stackebrandt E, Goebel B M. Taxonomic note: a place for DNA-DNA reassociation and 16S rRNA sequence analysis in the present species definition in bacteriology. Int J Syst Bacteriol. 1994;44:846–849. [Google Scholar]
- 31.Strunk O, Ludwig W. ARB—a software environment for sequence data. Munich, Germany: Department of Microbiology, Technical University of Munich; 1995. . (E-mail: ARB@mikro.biologie.tu-muenchen.de.) [Google Scholar]
- 32.von Wintzingrode F, Göbel U B, Stackebrandt E. Determination of microbial diversity in environmental samples: pitfalls of PCR-based rRNA analysis. FEMS Microbiol Rev. 1997;21:213–229. doi: 10.1111/j.1574-6976.1997.tb00351.x. [DOI] [PubMed] [Google Scholar]
- 33.Wagner R. The regulation of ribosomal RNA synthesis and bacterial cell growth. Arch Microbiol. 1994;161:100–106. doi: 10.1007/BF00276469. [DOI] [PubMed] [Google Scholar]
- 34.Wallner G, Fuchs B, Spring S, Beisker W, Amann R I. Flow sorting of microorganisms for molecular analysis. Appl Environ Microbiol. 1997;63:4223–4231. doi: 10.1128/aem.63.11.4223-4231.1997. [DOI] [PMC free article] [PubMed] [Google Scholar]
- 35.Wang R-F, Cao W-W, Cerniglia C E. PCR detection of predominant anaerobic bacteria in human and animal fecal samples. Appl Environ Microbiol. 1996;62:1242–1247. doi: 10.1128/aem.62.4.1242-1247.1996. [DOI] [PMC free article] [PubMed] [Google Scholar]
- 36.Wang R-F, Cao W-W, Cerniglia C E. Phylogenetic analysis of Fusobacterium prausnitzii based upon the 16S rRNA gene sequence and PCR confirmation. Int J Syst Bacteriol. 1996;46:341–343. doi: 10.1099/00207713-46-1-341. [DOI] [PubMed] [Google Scholar]
- 36a.Whitford et al. Unpublished data.
- 37.Wilson K H, Blitchington R B. Human colonic biota studied by ribosomal DNA sequence analysis. Appl Environ Microbiol. 1996;62:2273–2278. doi: 10.1128/aem.62.7.2273-2278.1996. [DOI] [PMC free article] [PubMed] [Google Scholar]