

ABSTRACT
The National Health Family Survey (NFHS) is one of the largest cross-sectional surveys in the world and plays a very important role in seeing the health sector’s growth in India. Its comprehensiveness in data points serves as a baseline for policymakers to amend or continue the health policy at the national and state levels. It is also imperative to look up the survey’s major findings and compare the same with the previous survey finding to obtain a trend (positive/negative) of the placed data indicators. In writing this information, we aim to provide a researched paper to undergraduates and postgraduates in medical education to identify the trends or gap pockets in NFHS-4 and NFHS-5. These findings might help them as an educational piece of work and further research evidence in their local community. Also, the present work is the compilation of demographic characteristics and major health indicators.
Keywords: Fertility, health indicators, mortality, national program, NFHS, rate, survey
Introduction
National Health Family Survey is one of the biggest surveys across the globe in terms of the number of respondents. It all started in 1992–93 when the first round was done covering all states except Sikkim. Since then, with the learning from the previous survey, we have successfully completed five rounds of NFHS. The NFHS-5 provides information on population, health and nutrition for India, each State/UT, and for 707 districts as of 31 March 2017. The survey is deployed in two phases: Phase I from 17 June 17 2019 to 30 January 2020 covering 17 States and 5 UTs and Phase II from 2 January 2020 to 30 April 2021 covering remaining 11 States and 3 UTs.
A total of 6,36,699 households were covered in which 7,24,115 women and 1,01,839 men with the response rate of 97.5%, 96.9% and 91.6%, respectively, were interviewed in 18 local languages using Computer Assisted Personal Interviewing (CAPI) technique. Four survey questionnaires catering data on Household, Woman, Man and Biomarker are used to capture the data. A total of 30,459 Primary Sampling Units (PSUs) were drawn from 707 districts. Data collection was conducted by using 1061 field teams each consisting of one field supervisor, three female interviewers, one male interviewer, two health investigators and a driver.
New data points exclusive to NFHS-5 are data on Preschool Education, Disability, Access to a toilet facility, Death Registration, Bathing practices during menstruation and methods and reasons for abortion were included. The scope of clinical, anthropometric and biochemical testing (CAB) has also been expanded to include the measurement of waist and hip circumference and the age range for the measurement of blood pressure and blood glucose values. For the first time in NFHS-5 (2019–21), there was a provision for generating error messages to ensure internal inconsistency in the data with a condition of immediate corrections.
On comparing the data sets of NFHS-4 with NFHS-5 under the category as mentioned in the India Report, we can distribute them into 14 categories [Figure 1]). Comparing India’s biggest health survey, that is, NFHS-4 and NFHS-5 gives an idea to the primary care physician about the trend of diseases and health indicators across the nation. They are usually the first point of contact for healthcare and needs to be updated with the current data set to plan both hospital-based and community-based health interventions. Analysing the report under respective heads can lead us to clear identification of weak sectors and work done for that in terms of policy, programme and community[1,2].
Figure 1.

Showing the distribution of chapters in NFHS-5 report
Key Findings
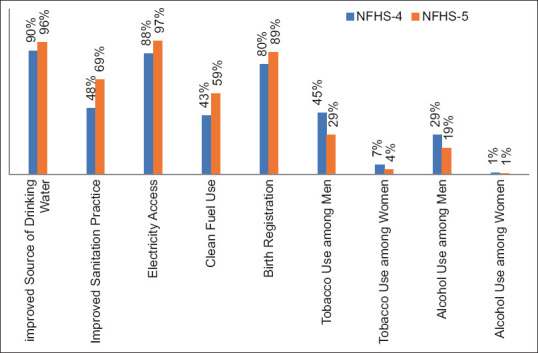
Among the general household and respondent characteristics, there was a general upward trend noticed like percentage of households having improved sources of drinking increased from 90% to 96%, improved sanitation practices from 48% to 69%, electricity access from 88% to 97%, clean fuel use from 43% to 59% and birth registration from 80% to 89%. There are three new sets of data recorded in NFHS-5, namely, access to toilet facilities reported by 83% of households, death registration by 71% and disability by 1%. The prevalence of tobacco consumption also recorded a downward trend, where tobacco use was reported as 39% among men and 4% among women as compared to 45% and 7% among men and women in NFHS-4. Similar findings were reported for alcohol consumption too; current use of alcohol among men went down to 19% from 29% and 1% from 1.2% among women when comparing NFHS-5 and NFHS-4 data, respectively [Figure 2].
For the Fertility Preferences, the percentage of women using any type of hygienic method of menstrual protection increased from 58% to 78%, in which use of sanitary napkins has also increased significantly from 42% to 64%. Here also, in NFHS-5, a new indicator as the percentage of women who take baths during their menstrual period is reported as 96%. While the median birth interval among subsequent pregnancies remains nearly the same in NFHS-4 (32 months) and NFHS-5 (33 months), there is a significant positive trend in total fertility rate (TFR). The TFR, an average number of children per woman, has further declined from 2.2 to 2.0 that can be looked at as a tremendous success since we have achieved the value below the desired replacement level of 2.1. In simpler terms, when the TFR is greater than 2.0, the population in a given area will increase, and when it is less than 2.1, the population in a given area will eventually decrease. The process of decline may be slow because factors such as age structure, emigration or immigration also play a significant role in the process.
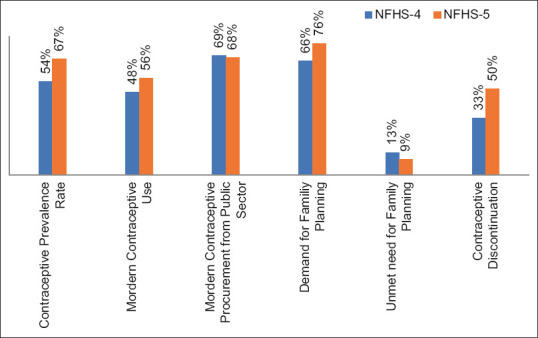
In continuation of population statistics, we have also achieved the overall Contraceptive Prevalence Rate of 67% in NFHS-5 as compared to 54% in NFHS-4 at all India levels. In aid to this modern contraceptive use prevalence is increased to 56% from 48% in which the most popular methods still remain to be female sterilization (38%). Also, the public sector utilization for procurement of modern contraceptives has remained constant between NFHS-4 (69%) and NFHS-5 (68%). The demand for Family Planning among married women aged 15–49 years also shows a 10% increase from 66% (NFHS-4) to 76% (NFHS-5). This all has led us to achieve the unmet need for family planning down to 9% from 13% as reported in NFHS-4. But a negative trend is also observed for contraceptive discontinuation that is reported as 50% for NFHS-5 as compared to 33% in NFHS-4 [Figure 3].
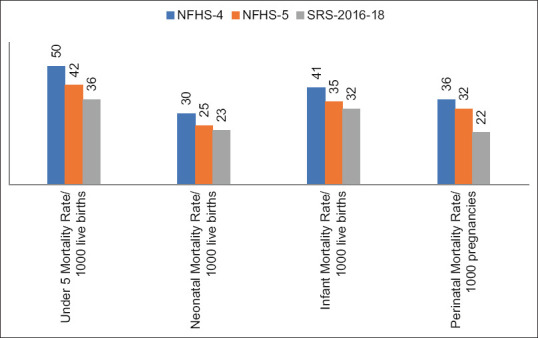
On analysing infant and child mortality, nearly all the indicators showed positive trends. In NFHS-5, the Under 5 Mortality Rate, Neonatal Mortality Rate and Infant Mortality Rate are reported as 42/1000 live births, 25/1000 live births and 35/1000 live births as compared to 50/1000 live births, 30/1000 live births and 41/1000 live births during NFHS-4, respectively. Similarly, the Perinatal Mortality Rate has also shown a positive trend from 36 deaths per 1000 pregnancies to 32 per 1000 pregnancies. Also, on comparing the same with SRS-2016-18 data, a fall in the mortality rate can be observed in the Under 5 Mortality Rate, Neonatal Mortality Rate and Infant Mortality Rate as 36/1000 live births, 23/1000 live births and 22/1000 live births, respectively. This positive impact on mortality data can be attributed to tremendous progress in postnatal check-ups of newborns within 2 days of delivery that has been reported as 82% as compared to 27% in NFHS-4, a positive change of 55% is one of the strongest indicators of NFHS-5 for newborn health [Figure 4].
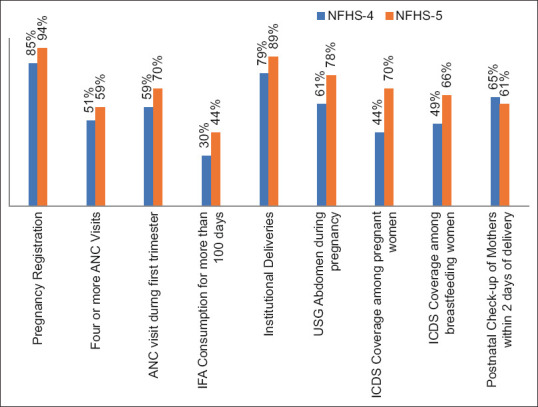
Our main focus since the inception of RCH has been maternal health, and the same is being reflected in the NFHS-5 report too. There is a 9% increase in pregnancy registration nationwide from 85% in NFHS-4 to 94% in NFHS-5. Four or more ANC visits increased from 51% to 59%, and ANC visits during the first trimester increased from 59% to 70%. IFA consumption for more than 100 days was reported as 44% among pregnant women in NFHS-5 as compared to 30% reported in the previous survey. There is also a 10% increment in institutional deliveries from 79% to 89% in NFHS-5. Care during the pregnancy in terms of USG abdomen is reported as 78% as compared to 61%, ICDS coverage among pregnant women as 70% as compared to 44% and among breastfeeding women as 66% as compared to 49% in NFHS-4. But the trend of postnatal check-ups within 2 days after the delivery has recorded a fall of 4%, that is, 61% from 65% during NFHS-4 [Figure 5].
The trend of child health and nutrition depict upward trend in comparing NFHS-4 and NFHS-5 data, but in some of them the recorded improvement value is very less. Low birth weight remained the same as 18% in NFHS-4 and 5, also fever percentage and ARI percentage in the last 2 weeks before the survey recorded as 13% among under 5 in both NFHS-4 and 5. Similarly, diarrhoea percentage is reported as 7% as compared to 9% in NFHS-5. One more no improvement data set was breastfeeding within one hour of delivery, which remained at 41% in both the survey. The coverage of fully immunized children has increased from 62% to 77% among children of 12–23 months children in NFHS-5. The prevalence of Stunting has improved from 38% to 36%, Wasting from 21% to 19% and underweight from 36% to 32% (Figure 6). This improvement can be attributed to a decrease in percentage of children receiving prelacteal feed from 20% to 16% and an increase in the median duration of exclusive breastfeeding from 2.9 months to 3.9 months. The warning concerns for more than 50 years now still persist that is the increasing trend of anaemia and the NFHS-5 report supports the same. Anaemia prevalence under 5 increased from 59% to 67% and similar findings were present in women (from 53% to 57%) and men (from 23% to 25%). And because of rapid urbanization, wide availability, affordability and increased self-life of HFSS food the prevalence of obesity has increased among those under 5 (from 2% to 3%), men (from 19% to 23%) and women (from 21% to 24%). A newer indicator measured in NFHS-5 also supports the above data as it captured waist-to-hip ratio (WHR) among men and women and reported that 48% of men and 57% of women are at substantial increased risk of metabolic complication.
For other adult issues, like tuberculosis, goitre, diabetes, hypertension and cancer screening, a lot more efforts are required considering them as a relatively newer and evolving imitative. The prevalence of medically treated tuberculosis has reduced significantly from 305 to 222/100,000 individuals whereas the percentage of reported tuberculosis cases that were put on the treatment is 97% both in NFHS-4 and 5. The share of public and private sector in healthcare utilization also remained stagnant as public sector (from 45% to 50%) and private sector (from 51% to 48%). Even the reason stated for non-utilization of government facilities remains same as poor quality of care followed by long waiting times and non-availability of nearby government facilities. However, the healthcare at the primary level through ASHA has improved from 11% contact with ASHA to 23% in NFHS-5. There is also a sharp rise in the prevalence of non-communicable diseases as hypertension prevalence among men and women has increased from 15% and 11% to 24% and 21% in NFHS-5. Similarly, percentage of women reporting blood glucose >140 mg/dl has increased from 5.8% to 12% in NFHS-5. Screening of cancer as a newer initiative is reported as 0.6% for breast Ca, 1.2% for cervical Ca and 0.7% for oral Ca. There is a 6% increase in HIV testing among women who had a birth in the past two years (from 30% to 36%). The prevalence of STI reported unit increase among men (from 8% to 9%) and women (from 11 to 12%).
Data on women’s empowerment suggest both positive and negative trends when comparing the two surveys. Among employment, there is a one-unit increase among currently married women from 31% to 32% in NFHS-5. There is a significant increase of 25% among women who have a bank account, rising from 53% to 79%, and nearly 54% now have a mobile phone compared to 46% in NFHS-4. However, there is a decline in the percentage of women participating in decision-making within the family, dropping from 84% in NFHS-4 to 71% in NFHS-5. The measure of freedom of movement shows a 2% positive shift captured through three questions: the percentage of women allowed to go to the market alone increased from 54% to 56%, the percentage allowed to go to a health facility alone increased from 50% to 52%, and the percentage allowed to go alone to places outside the community/village increased from 48% to 50%. A critical aspect of the data is husband justification for beating his wife, which shows an upward trend among men with a 2% increase from 42% to 44%. Conversely, among women, a 7% decline was observed, decreasing from 52% to 45%. Overall, the data highlights mixed progress in women’s empowerment, with improvements in certain areas such as access to financial services and mobile technology, but a decrease in decision-making power within the family. The positive movement in freedom of movement is encouraging, but the persistence of justifications for domestic violence among some men remains a concern.
Women percentage experiencing physical violence since the age of 15 years remained unchanged from 30% to 30% and the same for experiencing sexual violence in their lifetime which is reported as 6% in NFHS-5 and the same in NFHS-4. One worrisome data on the percentage of ever-married women who have experienced spousal sexual violence is reported as 14% in NFHS-5 as compared to 7% in NFHS-4.
Figure 2.
Showing household and respondent characteristics comparison of NFHS-4 and NFHS-5
Figure 3.
Showing fertility preferences comparison of NFHS-4 and NFHS-5
Figure 4.
Showing infant and child mortality rate comparison of NFHS-4, NFHS-5 and SRS-2016-18
Figure 5.
Showing maternal health indicators comparison of NFHS-4 and NFHS-5
Figure 6.
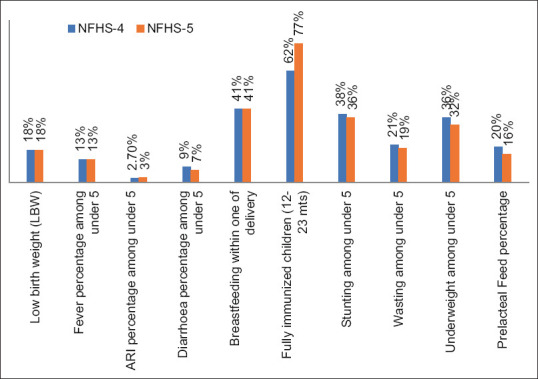
Showing child health indicator comparison of NFHS-4 and NFHS-5
Salient Correlations with the National Programmes
National Nutritional Anaemia Prophylaxis Program that was introduced in 1970 and revised as National Iron Plus Initiative in 2011 is working on anaemia treatment and prevention among all vulnerable groups. Still, we suffer an increasing trend of anaemia prevalence across all the beneficiaries. Hence, in 2018 National Nutrition Mission (POSHAN Abhiyan) followed by Anemia Mukt Bharat in 2019 was launched to strengthen the battle against this raising public health programme. We hope to see improvement in our anaemia statistics in the next survey report.[3]
One of the highlighted indicators of NFHS-5 is the attainment of TFR = 2, which should be attributed to our National Family Planning Program integration with RMNCHA+ programme[4] and their innovative way (cafeteria approach, CNA approach) for the service provision.
Strengthening our Primary Health Centre directly depicts our success in reducing all the mortality indicators of infants and children. With the introduction of Ayushman Bharat Health and Wellness Centre,[5] we are hoping to achieve the SDG target of an Infant Mortality Rate of 25/1,000 live births, we have already achieved up to 32/1000 live births as per SRS-2016-18. 30/1,000 live births as per 2019 SRS data and 28/1000 live births as per SRS 2020. Also improved maternity care in terms of improved complete ANC care, improved ICDS coverage, better institutional deliveries data support and strengthen our confidence to achieve the set targets.[6-8]
The fall in the prevalence of medically treated tuberculosis from 305/100,00 to 222/100,000 shows the smooth and effective work of RNTCP that boosted our confidence to go to the next step of ‘elimination’ as the National TB Elimination Program (NTEP).[9] Nearly all (97%) the cases of TB are getting medical treatment under the umbrella of the TB programme. Introduction of CBNAAT, mobile vans for diagnosis which are reaching the periphery, are taking us closer to the elimination of the disease.
Conclusion
National Family Health Survey provides data on all the determinants of health both direct and indirect and thus reflects our progress on the health of the community. Through comparison of data set between the two surveys, the positive and negative trends show the weak domains in the health sector that will directly help primary care physicians to develop more robust interventions like in the case of the anaemia trend and will indirectly help policymakers to strengthen the same at the national programme level. The unique part of this survey is the availability of previous survey data which act as a baseline and hence this trend can be visualised for all captured health data. This survey is one of the biggest surveys in terms of dataset and population under survey and hence external validity is very high. Whatever we received from the survey makes the basis of future studies on the important determinants of health. Correlating the same with the National Health Program reflects their evaluation on a national platform, and indicators that require boosting can be identified.
Financial support and sponsorship
Nil.
Conflicts of interest
There are no conflicts of interest.
References
- 1.Ministry of Health and Family Welfare, GoI. National Family health Survey (NFHS-5), 2019-21, India Report. [[Last accessed on 2022 Jul 18]]. Available from: https://dhsprogram.com/pubs/pdf/FR375/FR375.pdf .
- 2.Ministry of Health and Family Welfare, GoI. National Family health Survey (NFHS-4), 2015-16, India Report. [[Last accessed on 2022 Jul 18]]. Available from: https://dhsprogram.com/pubs/pdf/FR339/FR339.pdf .
- 3.Anaemia Mukt Bharat, Poshan Abhiyan. [[Last accessed on 2022 Jul 18]]. Available from: https://anemiamuktbharat.info/
- 4.National health Mission, Reproductive, Maternal, Newborn, Child and Adolescent Health (RMNCH+A) [[Last accessed on 2022 Jul 18]]. Available from: https://nhm.gov.in/index1.php?lang=1&level=1&sublinkid=794&lid=168 .
- 5.Ministry of Health and Family Welfare, GoI. Ayushman Bharat-Health and Wellness Centre. [[Last accessed on 2022 Jul 18]]. Available from: http://ab-hwc.nhp.gov.in/
- 6.Sample Registration System (SRS)-Statistical Report. 2016. [[Last accessed on 2022 Jul 18]]. Available from: https://censusindia.gov.in/nada/index.php/catalog/34785 .
- 7.Sample Registration System (SRS)-Statistical Report. 2019. [[Last accessed on 2022 Jul 18]]. Available from: https://censusindia.gov.in/nada/index.php/catalog/40526 .
- 8.Sample Registration System (SRS)-Bulletin 2020 Volume 55-I. [[Last accessed on 2022 Jul 18]]. Available from: https://censusindia.gov.in/nada/index.php/catalog/42687 .
- 9.National Health Portal, National Tuberculosis Elimination Programme. [[Last accessed on 2022 Jul 18]]. Available from: https://www.nhp.gov.in/revised-national-tuberculosis-control-programme_pg .