Abstract
Different plant species within the grasses were parallel targets of domestication, giving rise to crops with distinct evolutionary histories and traits1. Key traits that distinguish these species are mediated by specialized cell types2. Here, we compare the transcriptomes of root cells in three grass species—Zea mays (maize), Sorghum bicolor (sorghum), and Setaria viridis (Setaria). We first show that single-cell and single-nucleus RNA-seq provide complementary readouts of cell identity in both dicots and monocots, warranting a combined analysis. Cell types were mapped across species to identify robust, orthologous marker genes. The comparative cellular analysis shows that the transcriptomes of some cell types diverged more rapidly than others—driven, in part, by recruitment of gene modules from other cell types. The data also show that a recent whole genome duplication provides a rich source of new, highly localized gene expression domains that favor fast-evolving cell types. Together, the cell-by-cell comparative analysis shows how fine-scale cellular profiling can extract conserved modules from a pan transcriptome and shed light on the evolution of cells that mediate key functions in crops.
Single-cell mRNA profiling has opened up new opportunities to study cellular evolution by comparing gene expression in specialized cells across species3,4. In plants, high-resolution cellular profiling also has the potential to associate cell-level transcriptional regulation to key agricultural traits, many of which are mediated by specialized cells5.
Zea mays (maize) is a staple crop and Sorghum bicolor (sorghum) is an important dryland crop and biofuel candidate that is closely related to maize, separated by about 12 million years6,7. However, the two species differ substantially in key traits such as drought and chilling tolerance, and release of root exudates that shape soil interactions8-10. The importance of the two crops, their evolutionary proximity, and their functional differences present a novel opportunity for comparative analysis of cellular evolution in plants11,12. In addition, since sharing a common ancestor with sorghum, maize underwent a whole genome duplication (WGD) 5 to 12 million years ago, likely following a hybridization (allopolypoidy)7,13. Comparing patterns of gene expression at the cell level in maize, sorghum, and outgroup Setaria viridis (Setaria) provides an opportunity to examine cellular evolution and the role of gene duplications, including the paralogous genes generated by the WGD (homeologs)7,14.
Cells Provide Depth, Nuclei Breadth
Single-cell analyses in plants have relied on the generation of protoplasts by enzymatic digestion of cell walls15. However, certain tissues and even some species like sorghum are quite recalcitrant to digestion. There is also historic concern about the effects of protoplast generation on the cellular transcriptome, leading to growing interest in nuclear profiling16-18. To assess the fidelity of nuclear profiling in detail across dicots and monocots, we first compared single-cell vs single-nucleus profiles in both Arabidopsis thaliana (Arabidopsis/At, a dicot model with plentiful resources, 15,967 cells and 17,373 nuclei) and maize (Zm, a monocot model, 4,235 cells19 and 2,668 nuclei; Supplementary Table 1).
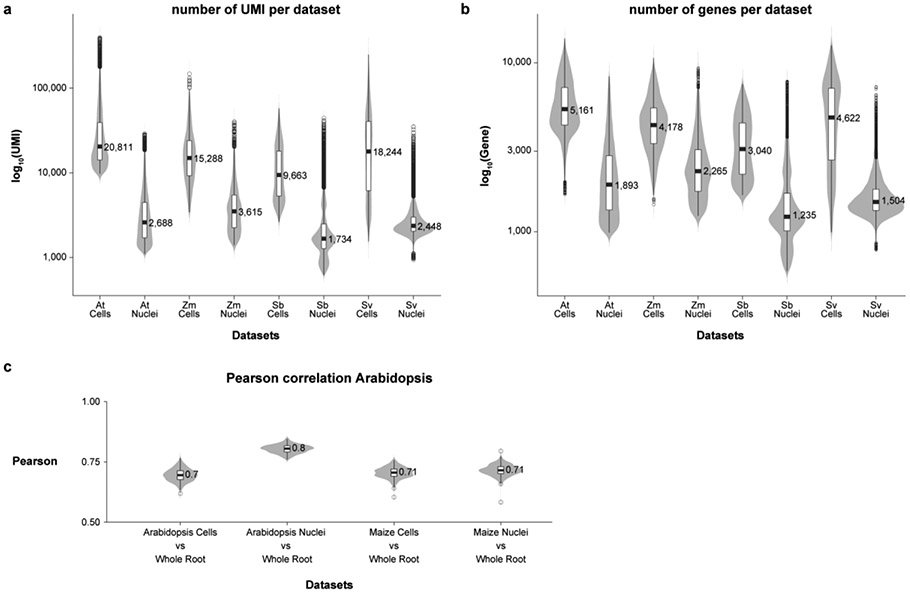
The number of Unique Molecular Indices (UMIs) was 10 times (At) and 6 times (Zm) higher in cells compared to nuclei (Extended Data Fig. 1a), similar to animal studies20. Accordingly, the average number of genes detected was 2.7 times (At) and 1.4 times (Zm) higher in cells than in nuclei (Extended Data Fig.1b, Supplementary Table 1). However, despite the lower mRNA content, nuclear profiling detected 89% (At) and 88% (Zm) of total genes present in cells (Supplementary Table 1).
The “pseudo-bulked” transcriptomes of both cells and nuclei displayed a high correlation to whole-root transcriptomes (r ~ 0.7-0.8, Extended Data Fig. 1c), confirming that both sampling methods generally reflected expression patterns of intact tissue.
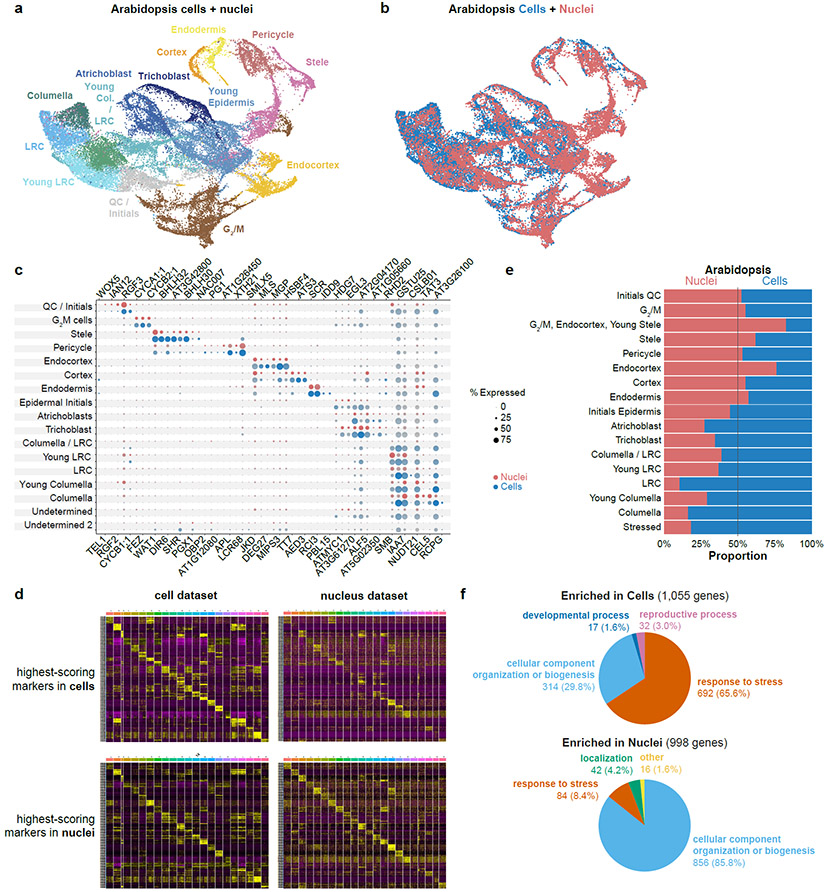
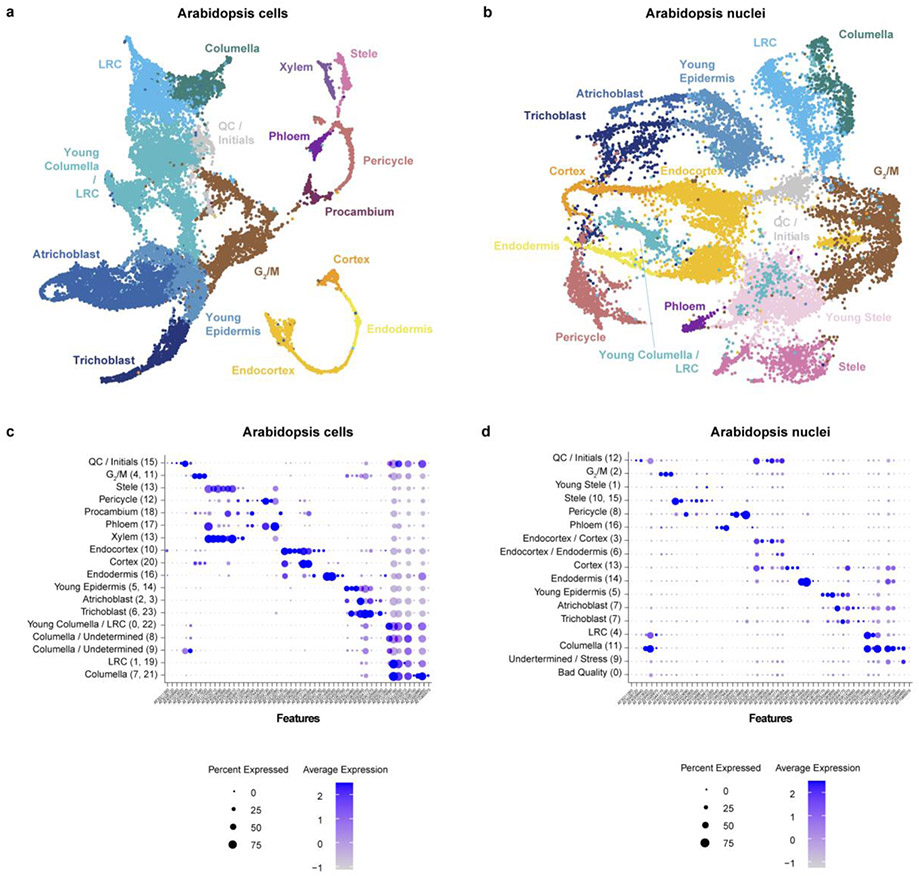
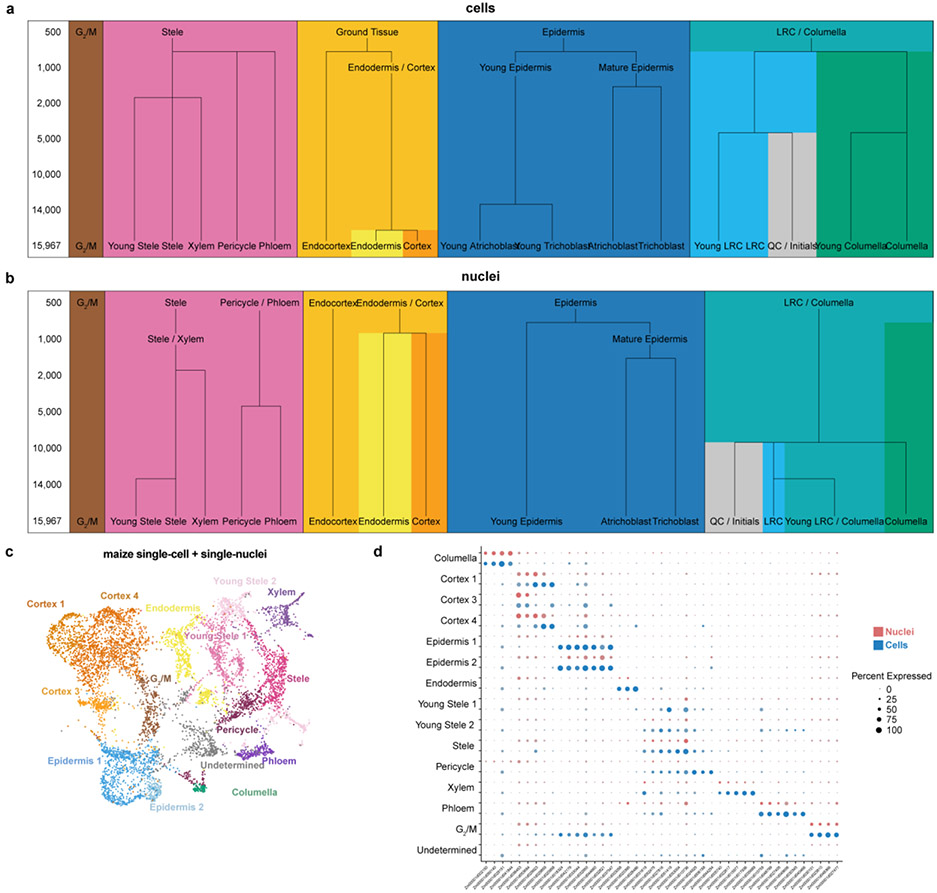
In both Arabidopsis and maize, cells and nuclei generated UMAP clusters corresponding to all the major cell identities21 (Fig. 1a-c; Extended Data Fig. 2, 3). However, in both species, the nuclear dataset generated fewer distinct clusters, often failing to distinguish between closely related or subcellular identities (Extended Data Fig. 2, 3). For example, in maize, stele cells contained a subcluster that we identified as xylem cells, whereas no such subcluster was apparent in the nuclear cluster analysis (Extended Data Fig. 3). Using a down-sampling approach on each dataset, a general rule-of-thumb emerged that twice as many nuclei are needed to discover the same number of clusters as cells/protoplasts (Extended Data Fig. 4a,b). Thus, the shallower depth of nuclear profiles provides less resolution for classification of cell identity—a drawback that down-sampling showed we could rectify, at least in part, by increasing the number of nuclei.
Fig. 1: Cell and nucleus profiles identify the same markers but show different sensitivities and artifacts.
a, b UMAP of combined Arabidopsis cells and nuclei with clusters colored according to assigned cell identity (a) or cell vs. nuclei origin (b). c Dot plots of Arabidopsis marker genes in cells (blue) or nuclei (red), showing all the cell types defined from clusters in this study. d Heatmaps of the 10 highest-scoring marker genes for each cell type found using Seurat. Upper row shows highest scoring markers found in the single-cell dataset (left) with their expression in the single nucleus dataset shown (right). Lower row shows highest-scoring markers found in single nucleus dataset (left) and their expression in the single cell dataset (right). e Proportion cells vs nuclei present in each cell type cluster. f Pie charts showing the difference in the prevalence of Gene Ontology (GO) terms among differentially expressed genes in each cluster between cells (top) vs. nuclei (bottom).
Either simultaneous or independent analysis of cells and nuclei generated clusters that reflected the same underlying biological patterns (Fig. 1a-c, Extended Data Fig. 4c,d). The highest-scoring markers extracted from nuclei generally matched the highest-scoring ones from cells (Fig. 1c,d Extended Data Fig. 4d). In addition, the assignment of cells to specific clusters was stable when cells or nuclei were clustered either alone or together (Supplementary Table 2).
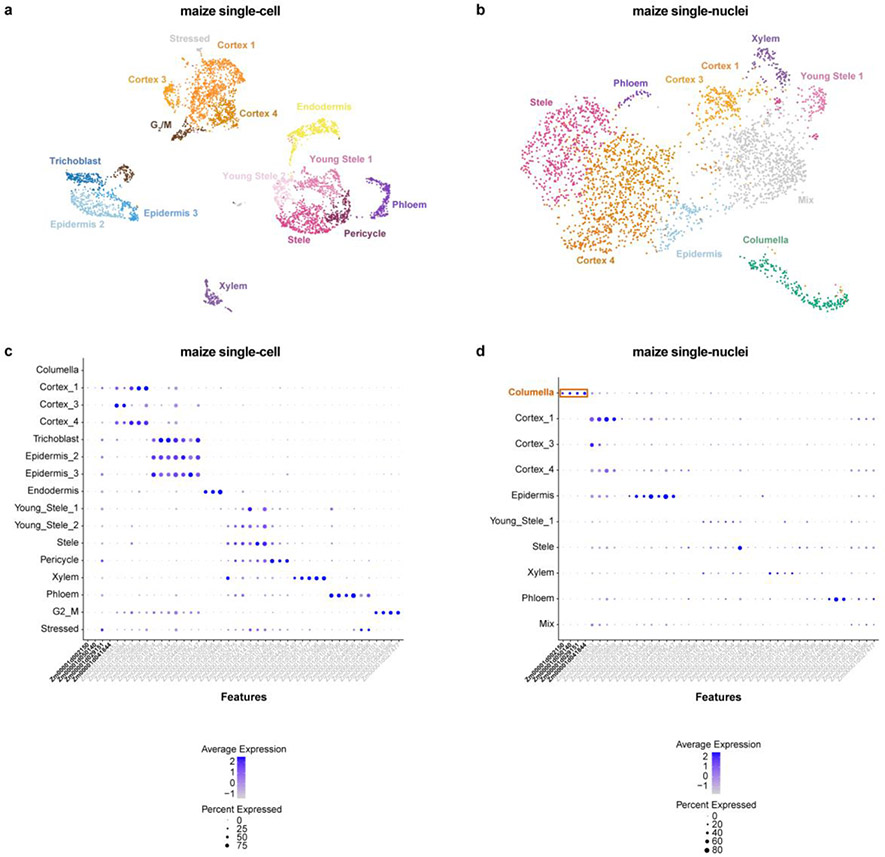
One advantage of nuclear profiles was their ability to capture cells from tissues that are recalcitrant to enzymatic digestion, giving a better representation of cell identities (Fig. 1e, Extended Data Fig. 3d). For example, in maize, we detected a unique cluster in single-nucleus profiling not present in single-cell profiling, which we confirmed as columella cells using previously published RNA-seq profiles of hand-sectioned root tissue19.
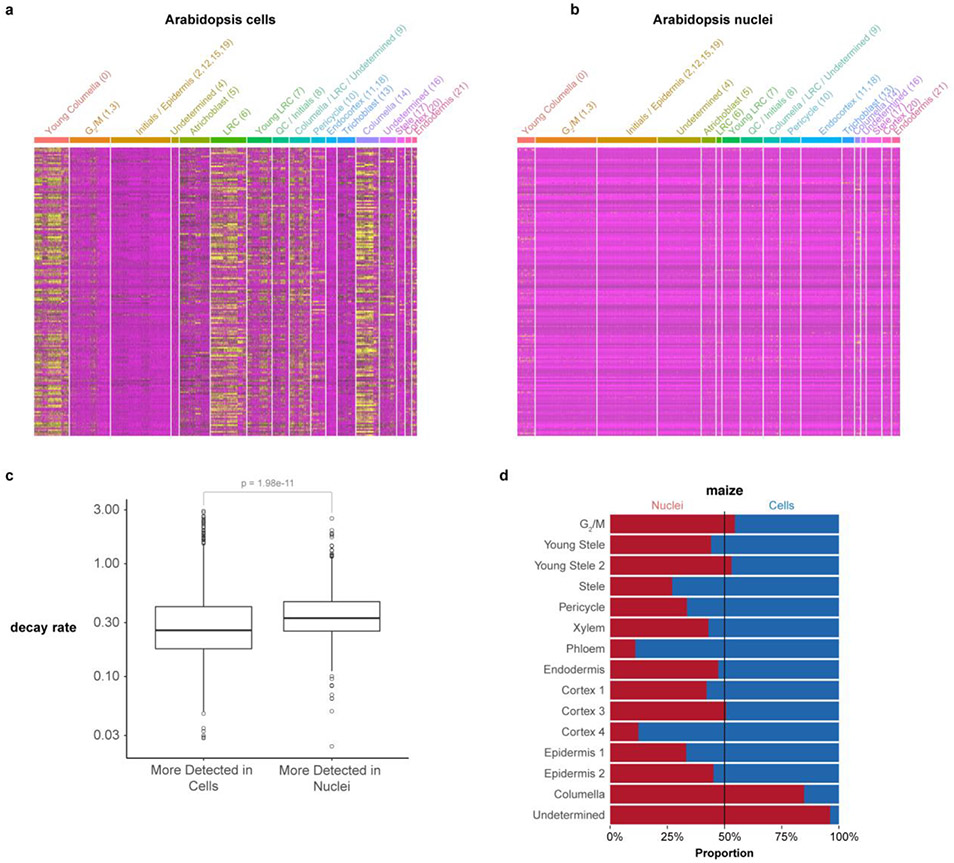
In Arabidopsis, we found that 14% of total genes (3,218) were differentially expressed between cells and nuclei in a cluster-by-cluster analysis (Supplementary Table 3). Cells showed a higher proportion of stress related genes (Fig. 1f, Extended Data Fig. 5a,b). A similar analysis in maize, sorghum and Setaria also supported a lower stress response in nuclei than cells (Supplementary Table 3). However, most of the differences between cell and nuclear profiling appeared to be related to compartmental RNA stability. For example, mRNAs enriched in nuclei vs. cells significantly overlapped with transcripts shown to have higher decay rates in the cytoplasm22 (p=1.98e−11; Extended Data Fig. 5c). We conclude that combining cell and nuclei profiles has the advantage of uncovering cell type-specific protoplast responsive genes, while also providing depth in transcriptional readouts.
Conserved Cell-type Markers in Cereals
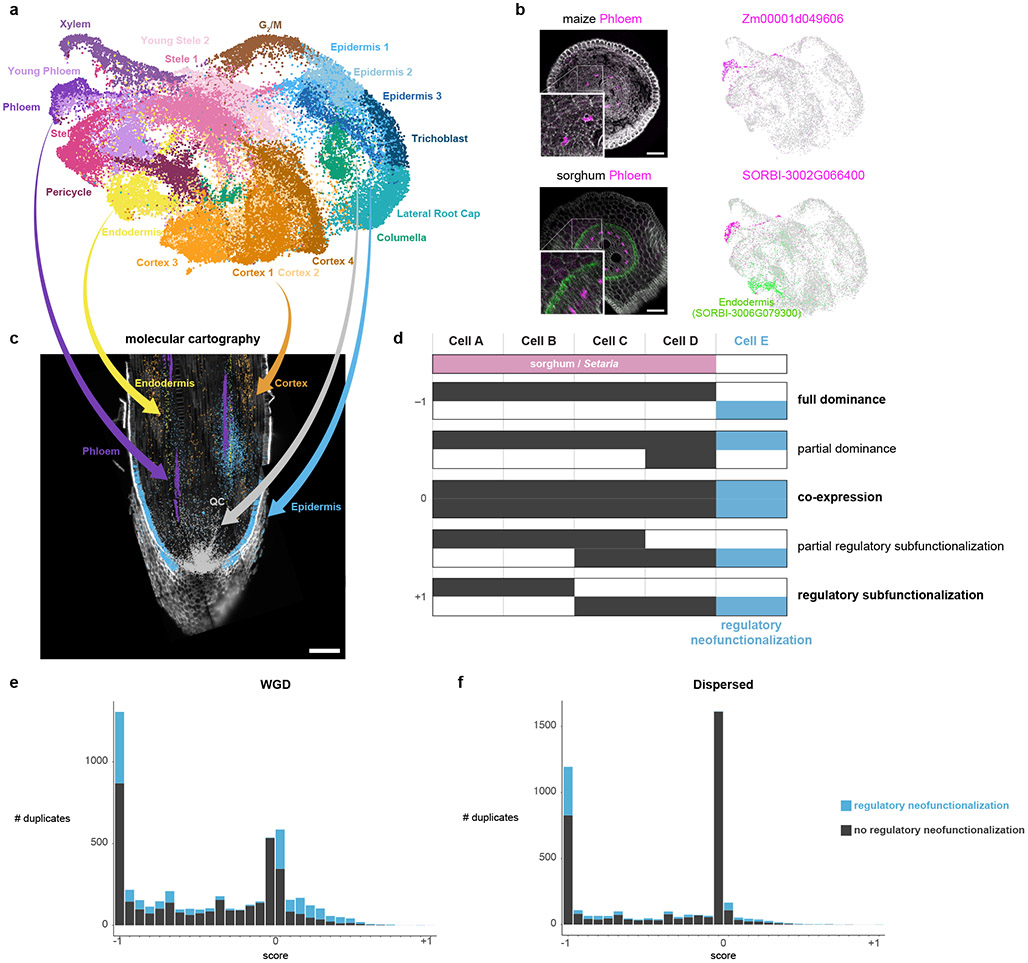
Given the comprehensive coverage of a combined analysis, we generated both whole cell and nucleus profiling to investigate cellular evolution in the maize-sorghum-Setaria clade. Thus, we generated profiles for sorghum (3,510 cells and 7,620 nuclei) and Setaria (10,613 cells and 12,192 nuclei, Supplementary Table 1). We took advantage of prior comparative genomic sequence analyses in maize, sorghum, and Setaria that mapped orthologs among the three species, including the homeologs created by WGD in maize11,14 (hereafter subgenome M1 and M2). We used a set of single-copy orthologs in the three species to cluster all cells and nuclei together in a single step and then predicted cell identity using known cell type-specific marker genes in maize19 (Fig. 2a, Supplementary Table 1, Methods).
Fig. 2: Mapping cell identities from maize to sorghum and gene duplicate analysis.
a UMAP of combined maize cell and nucleus profiles. Clusters are colored and labeled according to cell identity. b In-situ hybridization in maize (top) and sorghum (bottom). The maize phloem marker is orthologous to the sorghum phloem marker. Cyan coloration in the lower panel corresponds to a sorghum endodermal marker that highlights the stele boundary. The minimum/maximum values for each channel in the fluorescence images have been adjusted to show the localization more clearly in the merged image. UMAPs next to images show the respective expression of each gene in the maize-sorghum co-clustered single-cell profiles, which were used initially to determine their expression pattern. c Molecular Cartography, which allows simultaneous hybridization of multiple probes to a tissue section, here showing markers used for the cell-cluster annotation of clusters in maize. d Conceptual schematic of hypothetical expression patterns between duplicate gene pairs following a metric with a scale ranging from full dominance (−1) to equal co-expression (0) to regulatory subfunctionalization (1). Example intermediate states are also shown. Blue shows regulatory neofunctionalization. e-f Distribution of duplicate gene expression patterns using the metric described in (d) for WGD homeologs (e) and dispersed duplicate (f) pairs having similar with median Ks. Number of genes: 10,104 (WGD homeologs); 7,552 (dispersed duplicates).
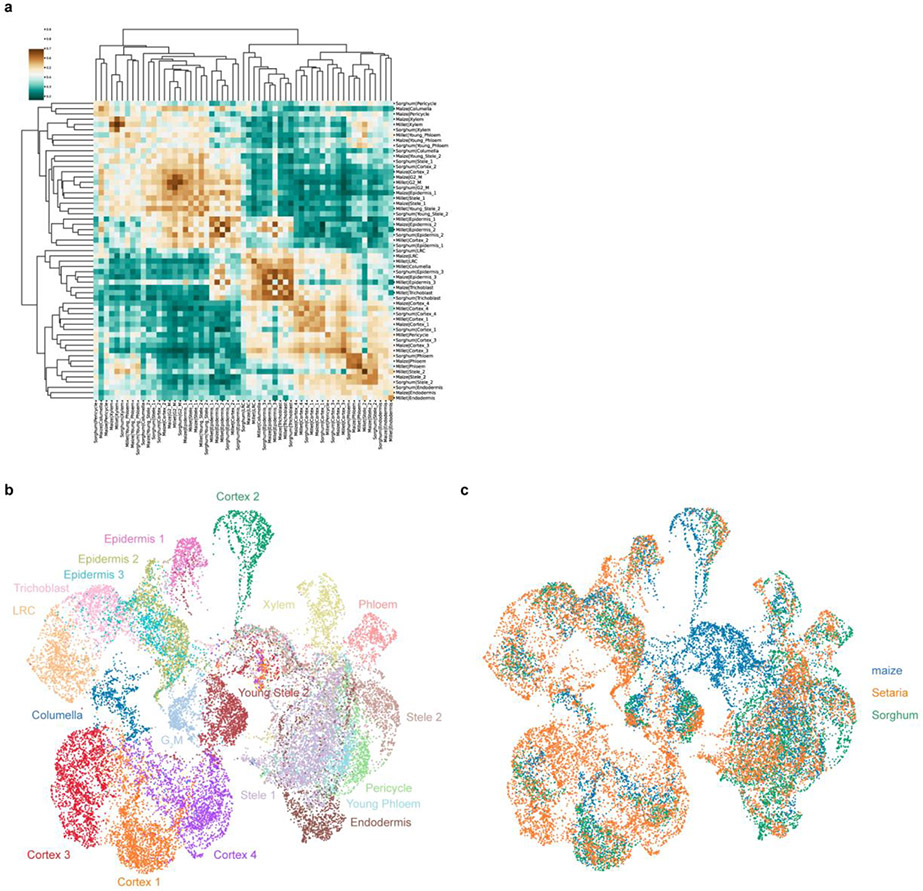
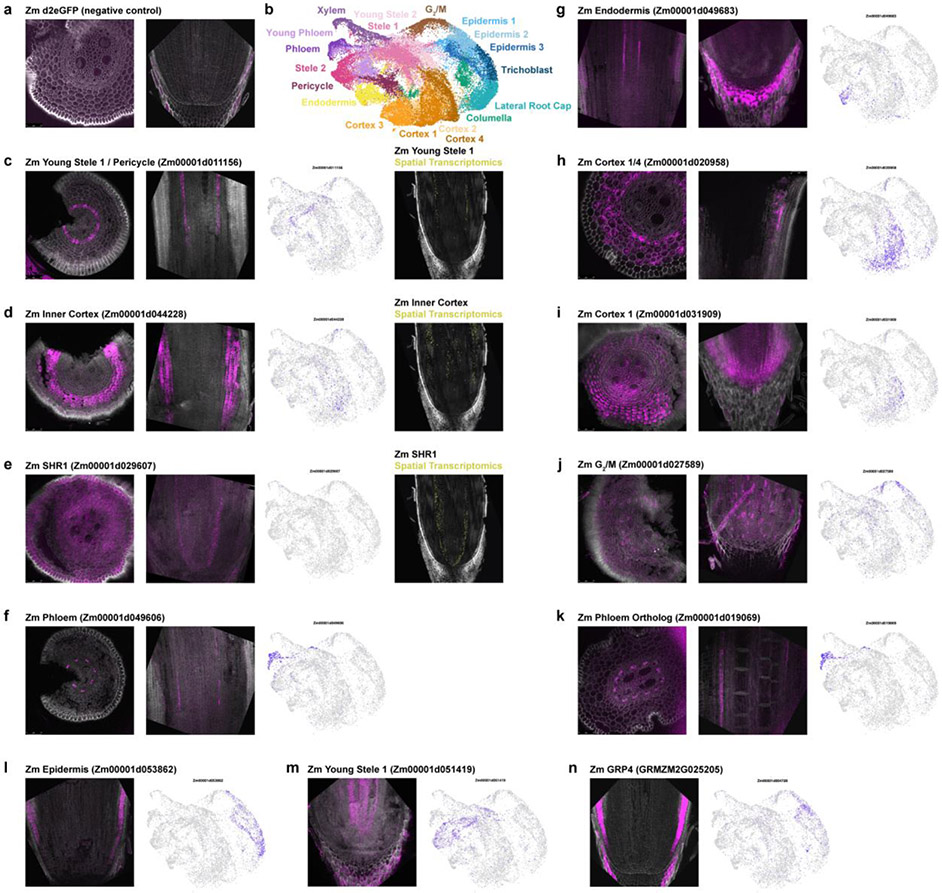
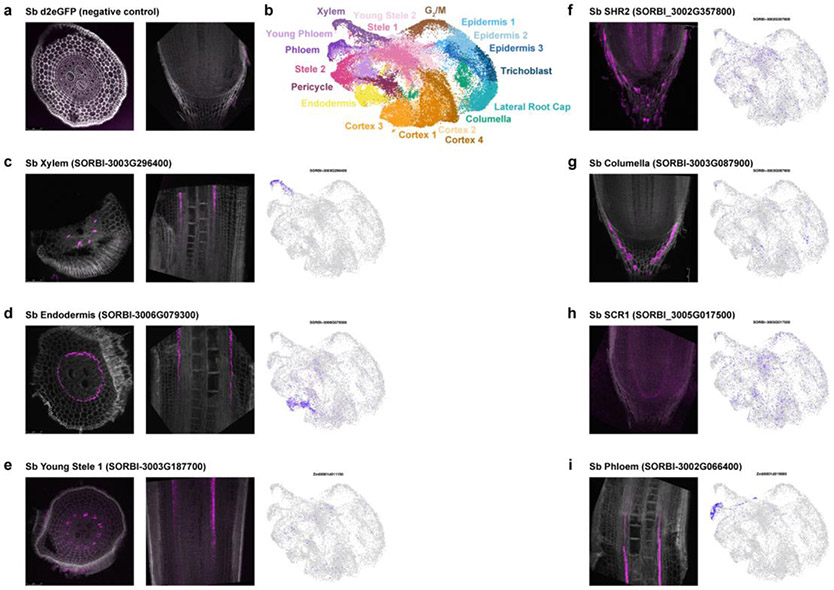
To validate the mapping, we: 1. performed an independent MetaNeighbor analysis, which uses neighbor voting to quantify the similarity of cell clusters across datasets using a given marker set of genes and their orthologs; 2. employed an additional machine learning-based clustering method, scGen, to confirm the cluster membership23 (Extended Data Fig. 6); 3. conducted whole mount in situ hybridizations in maize and sorghum (Fig. 2b, Extended Data Fig. 7, 8); 4. and performed spatial transcriptomics in maize (Fig. 2c, Extended Data Fig. 7), altogether confirming the maize-to-sorghum-to-Setaria mapping of cell identities. Thus, we could use the well-annotated maize cell type map for rapid generation of a high confidence cellular-resolution “pan-transcriptome” of these key crop species, including hundreds of new cell type-specific marker genes (Supplementary Table 4).
One potential use of cell type-specific pan-transcriptome data is to search for highly localized and conserved gene expression modules. We used MINI-EX to identify cell type-specific networks across the three grass species24. The analysis revealed 15 transcription factors (TFs) and putative targets (regulons) conserved in specific cell types across all three species (Extended Data Fig. 9a, Supplementary Table 5). In five of the fifteen cases, mutants in predicted TFs or direct Arabidopsis orthologs have been shown to exhibit cell type-specific phenotypes corresponding to the conserved regulon localization25-29. These results highlight the ability of comparative cell type analyses to reveal conserved cellular mechanisms across species and connect specific genes to specific cellular functions.
Impact of Maize WGD on Cellular Identity
The cellular map across species also provided the opportunity to examine how homologous cell types have diverged over the millions of years since the three species split. We first focused on the effects of gene duplication, comparing homeologs from the WGD to several other duplicate classes not identified as within WGD segments: gene pairs that arose from tandem, transposon-mediated, proximal (separated by ≤10 genes), and dispersed (separated by > 10 genes) duplicate pairs (Methods)11.
We used concordance between sorghum and Setaria to infer ancestral expression domains for each duplicate gene pair. We then developed a simple metric to represent the degree of overlap vs. complementarity in cellular domains between duplicate pairs, ranging from consistently higher expression of one homeolog (dominance), to co-expression, to regulatory subfunctionalization of homeolog pair expression30,31 (Fig. 2d). We then determined duplicated genes that expanded their expression domain to new cell types in comparison to ancestral domains (regulatory neofunctionalization, blue bars in Fig. 2d, Methods)32,33. We note that we cannot determine if differences in gene expression between duplicated genes occurred in the parent genomes or, more likely, after WGD13,32,34. In addition, herein, we use the terms neo- and sub-functionalization to refer strictly to patterns in transcriptional domains at the cell-type level.
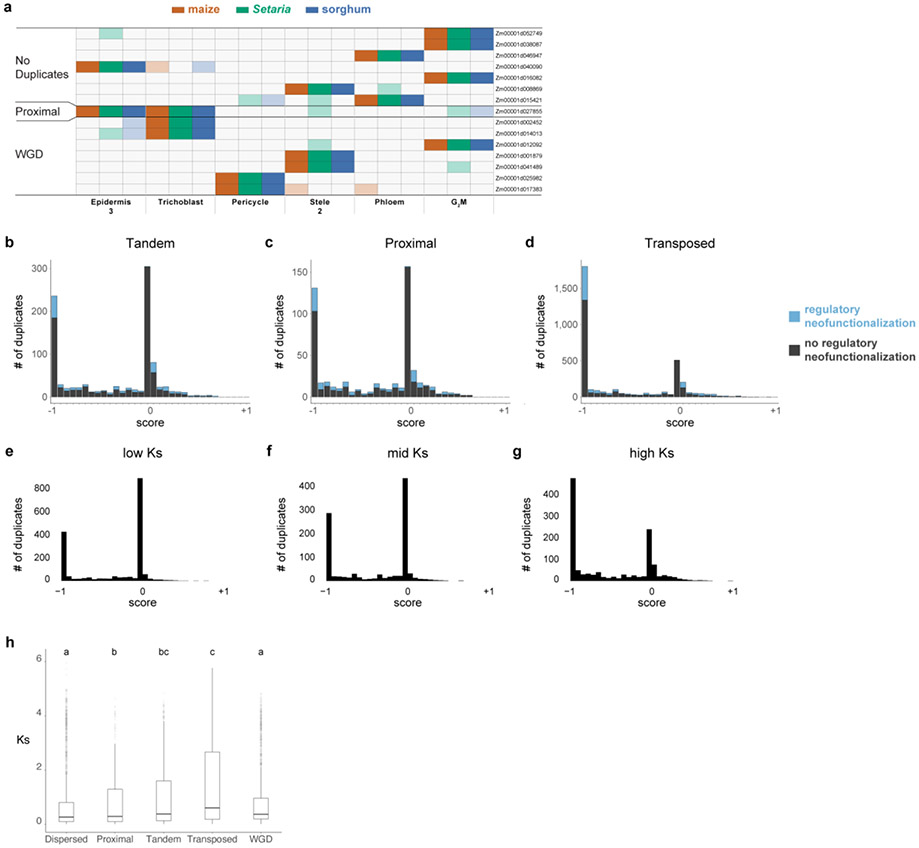
Overall, WGD homeologs made a more prevalent contribution to expression domain expansion (neofunctionalization) than other classes of duplicates. This was because they had a relatively low proportion of the co-expressed category, which showed no neofunctionalization (Fig. 2e,f, Extended Data Fig. 9.b-d). Rather, WGD homeologs were enriched in both dominance and subfunctionalized categories, which both showed high levels of neofunctionalization in new cell types (Fig. 2e,f, Extended Data Fig 9.b-d). This trend did not appear to be driven by the age of the duplication as other duplicate classes had similar mean Ks values to WGD35 (Methods, Extended Data Fig. 9.b-h).
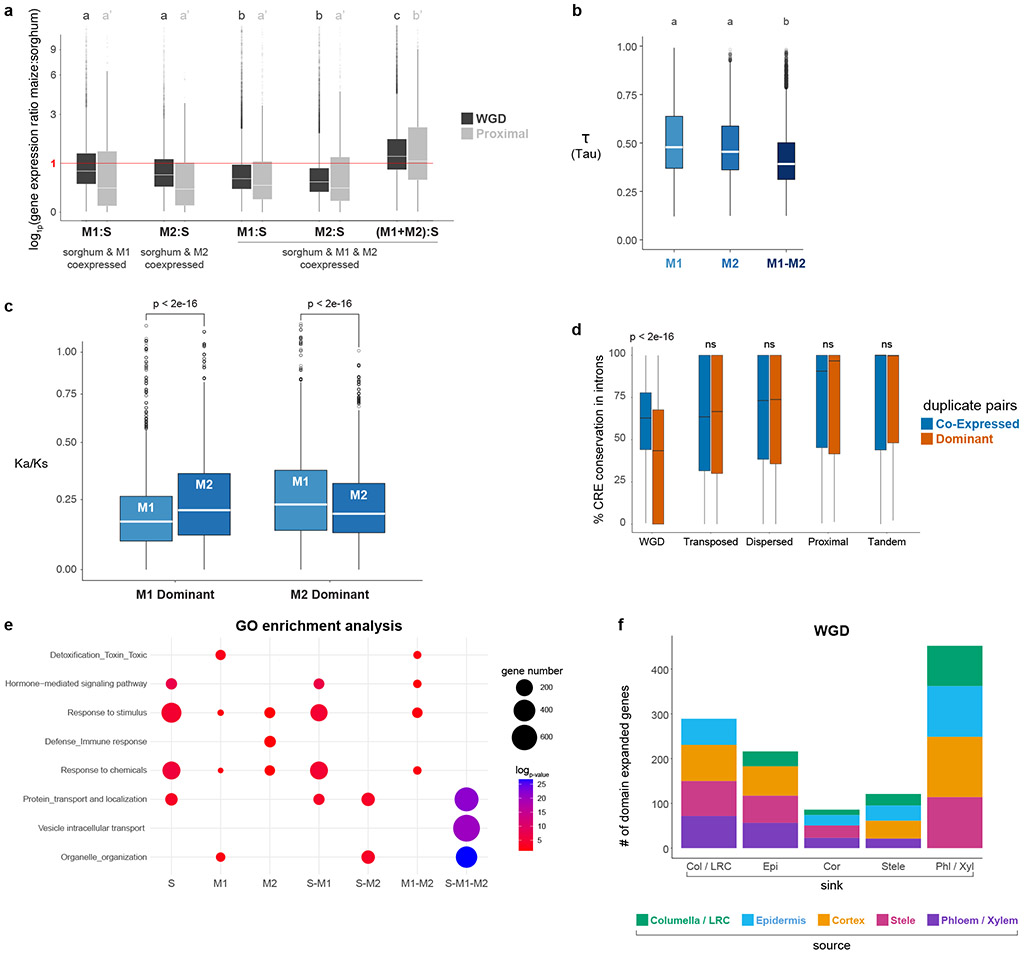
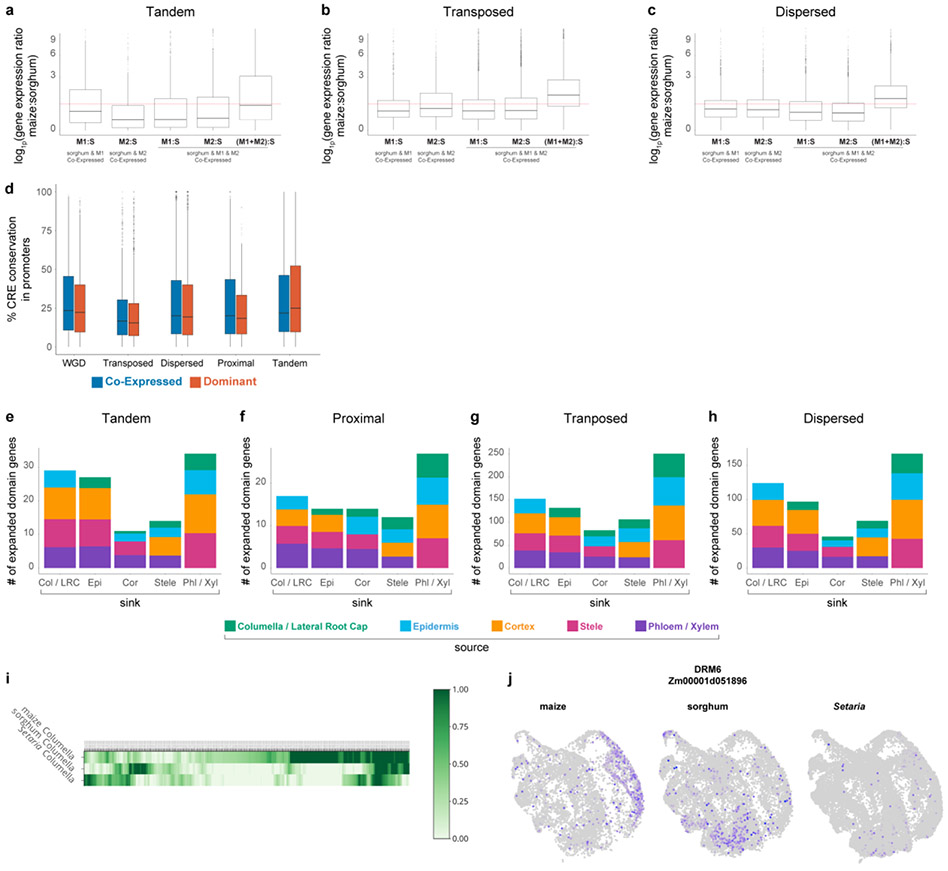
In keeping with Genome Balance models, we observed that co-expressed WGD homeologs showed expression patterns indicative of dosage compensation36,37, while this pattern was weaker or non-existent in other duplicate classes (Fig. 3a, Extended Data Fig. 10a-c).
Fig. 3: Detection of dosage compensation and cellular destination of regulatory neofunctionalized genes.
a Dosage compensation analysis with expression ratios of maize over sorghum orthologous genes in the two duplication classes. The first two boxplots represent cases where a sorghum ortholog is expressed in the same cell type as a single maize homeolog (either M1 or M2). The third and fourth boxplots represent cases in which both homeologs are expressed in the same cells. The last boxplot shows the ratio when both of the co-expressed homeologs are added in the numerator over sorghum expression level in the denominator. Dosage compensation is inferred from a pattern in which lone expression of a homeolog is higher than co-expressed homeologs. b Tau () value reflecting degree of cell specificity in different expression categories within a cell, if M1 or M2 is dominant or if M1 and M2 are co-expressed. c Ka/Ks distribution of WGD homeologs, when either M1 or M2 is dominant in a cell type they display stronger purifying selection than the non-dominant homeolog. d Cis-regulatory element conservation rate between duplicate pairs in introns split into co-expressed and dominant categories. e GO-terms enriched within each category expression category. S, M1, M2 = unique expression of the sorghum ortholog or one maize homeolog. S-M1 or S-M2 = one maize homeolog expressed in the same cell type as the sorghum ortholog. S-M1-M2 = both homeologs expressed in the same cell type as the sorghum ortholog. f Regulatory neofunctionalized genes categorized by their new expression domains. Colors within a bar graph show their ancestral cell-type domain (Methods). In a-d, n=10,104 WGD, n=860 Proximal, n=3,154 Transposed, n=7,552 Dispersed,n=1,448 Tandem. In a,b, statistical analysis was performed using an one-way ANOVA followed by the Tukey test for all pairwise comparisons, Not sharing a letter represents statistical significance at p < 0.05, in c Wilcoxson test, two-sided, in d, Wilcoxon signed-rank test, two-sided, with pvalue adjusted with Benjamini & Hochberg (1995) (BH). In boxplots the middle line is the median, the lower and upper hinges correspond to the first and third quartiles (Q1,Q3), extreme line shows Q3+1.5xIQR to Q1−1.5xIQR (interquartile range-IQR). Dots beyond the extreme lines shows potential outliers.
In addition, 66% percent of all regulatory neofunctionalization cases in the WGD came from the dominance category, with a slightly higher proportion from the M1 subgenome14,38 (Supplementary Table 6). Furthermore, dominant homeologs showed significantly higher cell type-specificity than co-expressed homeologs (, Methods, Fig.3b). Together, these trends meant that gene pairs that exhibited dominance patterns after WGD made the largest contribution to transcriptional divergence of cell types.
As found in previous studies34,39, dominant members of a homeolog pair showed greater purifying selection (Fig. 3c). In addition, we found that homeologs in the WGD class showed a dramatic decrease in the conservation of intronic cis-regulatory sites between the dominant and non-dominant homeolog compared to homeologs in the co-expressed class—a feature not observed in other duplicate classes, nor in promotors (Fig. 3d; Extended Data Fig. 10d; Supplemental Table 6). This could represent a possible loss of intron-mediated expression enhancement in the non-dominant homeolog. These two genomic features are consistent with prior findings that suggest dominant homeologs may have retained ancestral gene function34,39, while non-dominant homeologs may adopt new functions or become pseudogenes.
However, pseudogenization appears to be a less likely possibility. When we analyzed the same duplicate homeolog pairs in single-cell profiles of the maize inflorescence40, we found that a subset (32%) of non-dominant homeologs in the root were instead dominant in cells of the inflorescence (Supplementary Table 6). Together, the relaxed purifying selection and the switch in dominance suggests that non-dominant homeologs may specialize in a subset of developmental contexts outside the root.
The dominance group showed an enrichment for GO-term annotations related to immunity and response to stimulus/stress, even after removal of all potential protoplast-induced genes (Fig. 3e, Supplementary Table 7, Methods). Thus, new cellular gene expression driven largely by WGD may contribute to tolerance to environmental stress, either constitutively or under our conditions.
In addition, while subfunctionalization of cell-type domains between homeolog pairs was a minor outcome, this category of homeologs showed the highest rate of neofunctionalization (59%) compared to any other duplicate class (e.g., Fig. 2e,f, Extended data Fig. 9b-d). The trend is consistent with models in which subfunctionalization is a transitory state that facilitates neofunctionalization41. Ultimately, 34% percent of all the neofunctionalized homeologs (i.e., those with new cell-type expression after the WGD) came from the subfunctionalized category. Thus, while subfunctionalization via adopting complementary expression domains was relatively rare, it appeared to provide a high-probability route to cell-type domain expansion (neofunctionalization). This propensity for neofunctionalization made the subfunctionalized gene pair category a second major contributor to cellular divergence.
Finally, certain cell types appeared to be more likely domain-expansion destinations than others (Fig. 3f). The trends were similar for all duplicate classes, with the specialized vascular cells and root cap cells most frequently comprising the new expression domains. Cortex was the least frequent sink for new domains, although one of the most frequent source domains (Fig. 3f, Extended data Fig. 10e-h). Overall, the data shows how gene duplication, particularly WGD, frequently provides genetic material for the transcriptional divergence of specific cell types.
Root “Slime” Drives Cellular Divergence
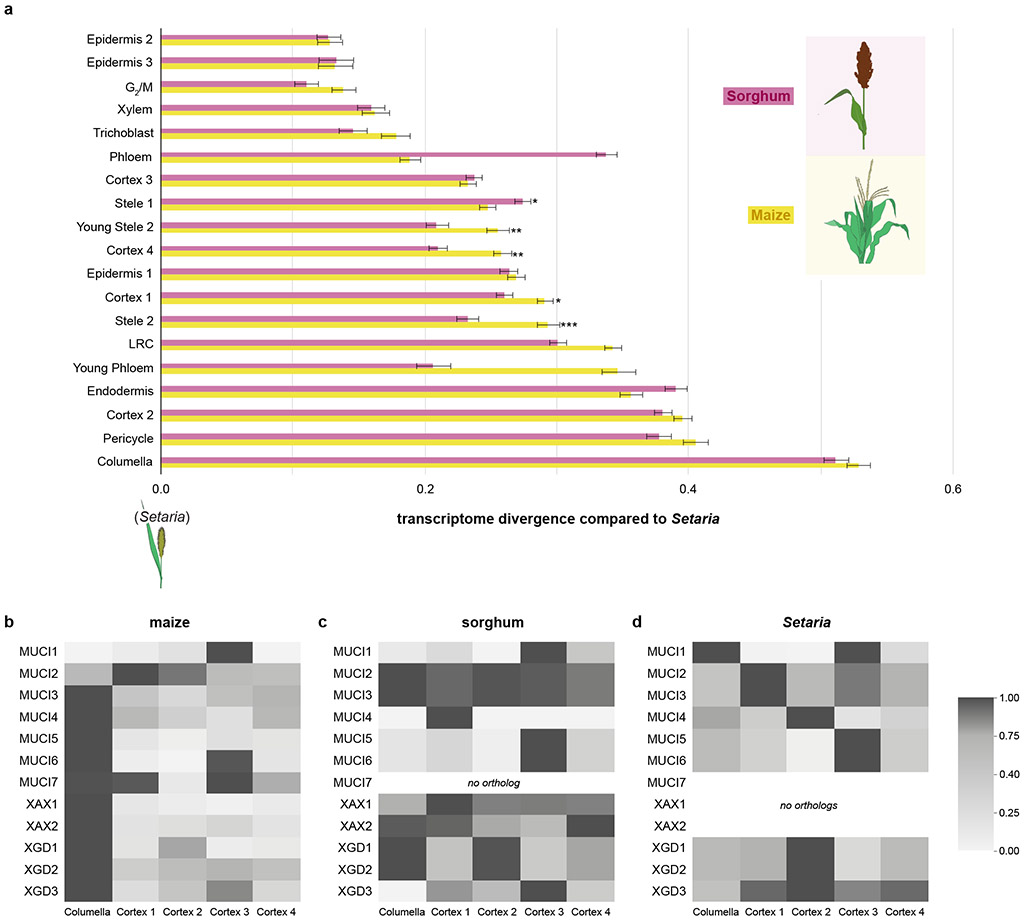
To ask about cellular divergence more broadly, we next examined the entire transcriptome of each cell cluster to determine which cell types changed most dramatically in maize and sorghum compared to the outgroup Setaria. For all comparative analysis, we combined cell and nuclei datasets, using MetaNeighbor to compare cell identities across species (Fig. 4a).
Fig. 4: Differential divergence of cell types in maize compared to Setaria.
a MetaNeighbor analysis showing a quantification of transcriptome divergence among cell types in maize and sorghum compared to the outgroup Setaria. Statistical significance between maize and sorghum was performed using the two-sided Hanley McNeil test (Methods, p *<0.05,**<0.01,***<0.001). Error bars, s.e. b, c Mucilage gene expression heatmaps for maize (b) and sorghum (c) and Setaria (d) in their respective columella cells and cortex layers.
The analysis showed that, in both maize and Setaria, the transcriptomes of columella, phloem, cortex subcluster 3, endodermis, pericycle, and stele cell types are the most divergent compared to Setaria (Fig. 4a). The shared divergence suggests that the function of these tissues diverged from Setaria before the maize-sorghum split. In addition, certain cell types—such as cortex subcluster 1 and 4, and several stele clusters—were significantly diverged between maize and sorghum, implying additional divergence after the maize-sorghum split. We note that the fast-evolving cell types were largely consistent with the sink tissues favored for neofunctionalization by duplicate genes (compare Fig. 4a with 3f). Interestingly, in maize, columella was among the most divergent cell types relative to Setaria (Fig. 4a).
To further investigate the potential functions involved in columella divergence, we used a measure of co-expression conservation to identify transcripts within clusters of interest that showed divergent patterns of expression across species in co-expression networks42 (Supplementary Table 8). We identified 443 genes displaying high expression divergence across species in columella cells. Many of these genes showed dramatic changes in cell type-localization between species, such as Downy Mildew Resistant 6 (DMR6), which is expressed in columella and epidermis in maize vs cortex and endodermis in sorghum (Extended Data Fig. 10i,j).
GO term analysis of the cortex-to-columella orthologs in maize showed enrichment in enzymes leading to the synthesis of mannose, raffinose, and oligosaccharides (Supplementary Table 8). These sugars and carbohydrates are key components of mucilage, also called slime, which can be secreted from many different cell types of the root and has multiple roles, such as the shaping of the root-associated microbiome and lubricating the root-soil interface8,43-45.
We then examined all genes implicated in mucilage synthesis8,9,46, finding the same general pattern of cortical expression in sorghum and Setaria and columella expression in maize (Fig. 4b,c,d).
Overall, these results suggest that maize underwent a relatively rapid cellular divergence in columella, in part, by recruiting a mucilage gene expression module from a putatively ancestral expression pattern in the cortex. The most parsimonious model is that the recruitment of the mucilage module occurred before the maize WGD, as both maize homeologs in the mucilage-annotated genes tended to share expression in the columella. However, the set of mucilage genes showed a significant overlap with genes previously defined as under selection during domestication47 (Supplementary Table 8), suggesting they play a role in agricultural traits.
Prior studies in animals have shown cooption of gene modules from one cell type to another as a mechanism of cellular diversification48. We asked how frequently gene expression modules, such as the mucilage group, switched cellular localization by focusing on regulons that have different cell type-specific expression patterns in maize compared to sorghum and/or Setaria (swapped regulons). Although annotated regulons comprise just a subset of all potential TF-downstream targets, we identified more than 50 swapped modules across cell types. The swapped modules are prime candidates for genes that could mediate differences in cellular traits between maize and related species (Supplementary Table 5).
Overall, we identify two major trends in cellular divergence in a taxonomic span of 50 million years49. First, after WGD duplication, gene pairs that take on dominant/non-dominant patterns have the strongest role in cell type-specific divergence. However, the rare class of subfunctionalized genes have the most likely evolutionary route to neofunctionalization. Second, homologous cell types appear to diverge, in part, by swapping gene expression modules48, such as the mucilage genes found to be expressed in the maize columella. Finally, we illustrate here how single-cell techniques can rapidly generate a pan-transcriptome for insights into plant cell type evolution and open new methods to explore the connection between genetic modules and cellular traits in important crops.
Methods
Plant Growth Conditions
Seeds of Arabidopsis thaliana Col-0, Zea maize B73, Sorghum bicolor Btx623, and Setaria viridis A10.1 and PI 669942 (U.S. National Plant Germplasm System) were used in this study. Arabidopsis seeds were imbibed for 48 h at 4°C before being surface-sterilized and placed on a nylon mesh (110 μm) within plates containing agar with 1/2 × Murashige and Skoog salts (Sigma M5524), 0.5% sucrose, and 0.8% Agar (Sigma A1296). Plants were transferred vertically in growth chambers set to 23°C and a 16 h light/8 h dark cycle (400 μmol m−2 s−1). Root tips were collected 7 days after transfer, cut with a feather scalpel at 150 μm from the tip, and directly transferred to either the protoplast solution at room temperature or the nuclei lysis buffer at 4°C.
Maize and sorghum seeds were sterilized using bleach (1.5% active chloride) and 0.001% tween 20 for 20 mins and then 4% chloramine T for 20 mins. Setaria seed germination was induced by incubation in 4% liquid smoke (Colgin, Authentic Natural Hickory) at 29°C for 24 h. Then, Setaria seeds were sterilized using bleach (1.5% active chloride) and 0.001% tween 20 for 20 mins. All seeds were placed between two layers of brown paper (Anchor Paper&Cie., 38# regular), rolled, and covered with aluminum foil to prevent roots from exposure to direct light. Rolls were placed in a bucket of tap water at 28/24°C and a 16 h light/8 h dark cycle (250 μmol m−2 s−1) for 7 days (15 days for Setaria) before harvesting the root tips. Primary and seminal root tips were cut using a fine scalpel at 0.5 cm from the tip for maize and sorghum, 0.2 cm from the tip for Setaria, and transferred either to the pre-incubation solution for single-cell processing or to the nuclei lysis buffer.
Protoplast Generation
Protoplasts were generated from primary and seminal roots as described previously50. For maize, sorghum and Setaria, roots were cut above the meristem as described above and placed in pretreatment solution containing L-cysteine for 40 mins (3% sorbitol, 2.5mM L-cysteine, 20mM MES, and pH 5.8 with Tris) to improve enzyme efficiency and cell wall digestion. Cell walls were digested for 90 mins in an enzyme solution optimized for monocot roots (Mannitol 8%, 400mM, MES 20mM, KCl 20mM, CaCl2 40mM, pH 5.8 with Tris, BSA 100 μg/ml; 2% cellulase “Onozuka” RS, 1.2% cellulase “Onozuka” R10, 0.4% macerozyme R-10 (all three Yakult Pharmaceutical Industry CO.); and 0.36% pectolyase Y-23 (MP Biomedicals)). Protoplasts were then filtered through a 40-μm cell strainer and transferred to microcentrifuge tubes for centrifugation.
For Arabidopsis, roots were cut above the meristem as described above and placed in an enzyme solution optimized for Arabidopsis (Mannitol 8%, 400mM, MES 20mM, KCl 20mM, CaCl2 40mM, pH 5.8 with Tris, BSA 100 μg/ml, 1.2% cellulase “Onozuka” R10, 0.4% macerozyme R-10 (both Yakult Pharmaceutical Industry CO.). Protoplasts were then filtered through a 20-μm cell strainer and transferred to microcentrifuge tubes for centrifugation.
Protoplasts were centrifuged for 3 mins at 500 x g and the pellets were washed and resuspended in washing solution twice (Mannitol 8%, MES 20mM, KCl 20mM, CaCl2 10mM, pH 5.8 with Tris, and BSA 100 μg/ml) and used immediately for single-cell RNAseq.
An aliquot of protoplasts was stained with trypan blue (0.2% final) and checked on a hematocytometer under the microscope to determine cell viability and concentration before loading into the 10x Chromium.
Nuclei Extraction
For all species, root tips were directly transferred to pre-chilled lysis buffer (0.3M sucrose, 15mM Tris HCl at pH 8, 60mM KCl, 15mM NaCl, 2mM EDTA, 0.5mM Spermine, 0.5mM Spermidine, 15mM MES, 0.1% Triton, 5mM DTT*, 1mM PMSF*, 1% Plant Protease Inhibitors* 1 ml (Sigma P9599), BSA 0.4%*, RNase inhibitor 0.2 μg/μl*, (* added at the last minute). Roots were chopped on ice with scalpel blades for 5-10 mins and transferred into a pre-chilled dounce homogenizer (Kimble, 885302). The pestle was moved up and down 10 times s back and forth, samples were then kept on ice for 10 mins before an additional 10 times of back and forth with the pestle. Root extracts were filtered at 20 μm into a centrifuge tube and centrifuged for 10 mins at 500 x g (maize, sorghum, and Setaria) or at 1000 x g (Arabidopsis). Pellets were washed once with washing buffer (0.3M sucrose, 15mM Tris HCl at pH 8, 60mM KCl, 15mM NaCl, 0.5mM Spermine, 0.5mM Spermidine, 15mM MES, 5mM DTT*, 1mM PMSF*, 1% Plant Protease Inhibitors* 1ml(Sigma P9599), BSA 0.4%*, RNase inhibitor 0.2u/ul* (* added at the last minute). Finally, nuclei were resuspended into a final buffer (0.3M sucrose, 15mM Tris HCl at pH 8, 60mM KCl, 15mM NaCl, 0.5mM Spermine, 0.5mM Spermidine, 15mM MES, 5mM DTT*, 1% Plant Protease Inhibitors* 1 ml (Sigma P9599), BSA 0.4%*, RNase inhibitor 0.2 μ/μl*, (* added at the last minute) and filtered using a 10-μm filter. An aliquot of nuclei was stained with DAPI for quality control and nuclei were counted under the microscope. Nuclei were used immediately for single-nucleus RNA-seq.
Single-Cell RNA-seq
Per replicate 16,000 cells or nuclei were loaded in a Single Cell B Chip (10x Genomics). Single-cell libraries were then prepared using the Chromium Single Cell 3´ library kit, following manufacturer instructions. Libraries were sequenced with an Illumina NextSeq 550 platform using a 1x150 high-output chip (2 libraries per chip) or Novaseq 6000 chip SP V2.5 (4 libraries per chip). Raw scRNA-seq data was analyzed by Cell Ranger 5.0.1 (10x Genomics) to generate gene-cell matrices. Gene reads were aligned to the Arabidopsis TAIR10.38, Maize B73 v4, Sorghum bicolor v3 and Setaria viridis v2 reference genomes.
UMAP and ICI analysis
Replicates (see Supplementary Table 1) were integrated and cells mapped using the Seurat package v4.0 51 as follows: first, genes with counts in fewer than three cells were excluded from the analysis and their counts were removed. Second, low-quality cells were removed using threshold variable depending on the library quality (see supplementary Table 1). Clustering of cells or nuclei separately were done by log-normalized raw counts and the 2000 most variable genes were identified for each replicate using the “vst” method in Seurat. Next, we used the FindIntegrationAnchors function to identify anchors between the three datasets, using 20 dimensions. A new profile with an integrated expression matrix containing cells from all replicates was produced with the IntegrateData function. For dimensionality reduction, the integrated expression matrix was scaled (linear transformed) using the ScaleData function, and Principal Component analysis (PCA) performed. The top 30 principal components were selected. Cells or nuclei were clustered using a K-nearest neighbor (KNN) graph, which is based on the Euclidean distance in PCA space. The FindNeighbors and FindClusters function with a resolution of 0.5. was applied. Next, non-linear dimensional reduction was performed using the UMAP algorithm with the top 30 PCs.
For the co-clustering of cells and nuclei, either dataset were treated similarly, all replicates were integrated at once using the seurat 'SCT' approach52. First raw reads were normalized using the SCTransform function, then SelectIntegrationFeatures was used to identify anchors between the datasets, using 3000 features.
For multiple species clustering, all orthologous genes names from11 were replaced by their corresponding maize ID in sorghum and setaria raw features.tsv.gz files (Gene conversion in Supplementary Table 1). Anchors are combined using PrepSCTIntegration and selected using FindIntegrationAnchors. For clustering of maize, sorghum and setaria together, all species were considered equally using the FindIntegrationAnchors function. Finally, a Principal Component analysis (PCA) is performed using the first 100 principal components and a non-linear dimensional reduction was performed using the UMAP algorithm with the top 100 PCs.
Identification of WGD and non-WGD One-To-One Gene Duplicate Pairs
We used prior studies to obtain a list of WGD homeologs in the maize1 and maize2 genomes11,14. To identify the other types of duplicated genes, DIAMOND v2.0.6 was used to perform blastp for the target genome (Z mays) with itself, and the outgroup genome (Amborella trichopoda) retaining BLAST hits with e-value < 1e−5. These BLAST hits were filtered to remove hits from different orthogroups using a custom script (see dupgen_finder_sh). Duplicate gene pairs were called using DupGen_finder.pl and DupGen_finder-unique.pl from https://github.com/qiao-xin/DupGen_finder with the below parameters. -s 5 (requiring ≥ 5 genes to call a collinear block) -d 10 (≤ 10 intervening genes to call ‘proximal’ duplicates). Output files include 'pairs-unique' files (attached) for duplicate gene pairs derived from five modes of gene duplication, including whole-genome, tandem, proximal, transposed, and dispersed duplication. Another output, 'genes_unique' files from different types of duplication were combined into a single file with information on the duplication type for each gene in the genome (Maize_Dup_classified_genes.tsv). To avoid over-counting duplicate pairs within gene families, pairs with the lowest e-value were retained as unique pairs within each family using a custom R script (duplicate_similarity.R). To filter out pericentric gene pairs that are unlikely to be expressed, these duplicate gene pairs were merged with genic methylation classifications of Z. mays genes using a custom R script retaining only those pairs where both paralogs had methylation data. This procedure identified duplicates that were either not a part of the WGD (e.g., in genome segments that were not retained) or duplicated after the WGD. It also filters out many ancient duplications whose one-to-one relationship becomes obscured over time. Finally, we removed all genes having more than one duplicate.
GO-Term Analysis
All GO enrichment were performed using shinyGO V0.61 (http://bioinformatics.sdstate.edu/go/) with an FDA of 0.05.
Cis-regulatory element prediction
Cis-regulatory element were predicted using the Meme suite FIMO algorythm v5.5.1 (https://meme-suite.org/meme/tools/fimo) on 500bp in the promoters or introns. Maize TF binding sites database used in FIMO was downloaded from http://plantregmap.gao-lab.org
Gene Expression Analysis Across Species
Whole-root transcriptomes were obtained from Ortiz-Ramírez et al., 202119 for maize and Hernández Coronado et al., 202153 for Arabidopsis. Gene expression was normalized for each species using the Normalizedata function from Seurat. Then the average expression per cluster was calculated using AverageExpression from Seurat. Ka and Ks values were taken from a previous report 54. Low, mid and high Ks values were calculated from WGD Ks distribution using the 1/3 quartiles. Tau () was calculated as described in Yanai et al., 200555 , where is the total number of cell types and is the expression profile component normalized by the maximal component value.
MetaNeighbor cell type validation across species
To determine how well the cell clusters characterized the shared identities of cells in their own clusters and the overlaps with the identities of all other cells, we utilized the MetaNeighbor package in Python (https://github.com/gillislab/pyMN)56,57. MetaNeighbor measures the replicability of cell types by learning a model in one dataset (or subset) and testing for its ability to reconstruct cell type clusters in the other dataset. First, we labeled all cells and nuclei by the technology used to sequence the transcriptome, by the cluster identity, and by the plant species to which they belonged. Then, we used the PyMN.variable_genes function from MetaNeighbor to subset the gene list to variable genes. This generates a list of genes that are variable across the technology and species. Next, we employed the PyMN.MetaNeighborUS function to measure how well the transcriptional profiles of cells from clusters in one division of the dataset (e.g., technology) predict the identities of cell clusters in the other fraction of the data. This generates pairwise AUROCs for each combination of clusters. To generate the heatmaps, the PyMN.plotMetaNeighborUS was used with a Brown Blue-green color map. This plots the pairwise AUROCs generated previously.
Validation of Integration using scGEN
To evaluate the integration of nuclei and cells across three plant species, we repeated the integration using the supervised integration method scGEN23. We utilized scGEN version 2.1 to train a model using the scgen.train function, and utilized the scgen.model.batch_removal function to correct our data. Following correction, we utilized the ScanpyV1.958 calculate the nearest neighbors using scanpy.pp.neighbors, and generated a 2D projection using UMAP, via sc.tl.umap. We then used sc.tl.leiden clustering algorithm at a .6 resolution to identify clusters, which we evaluated for mixing and accuracy of integration.
Identification of Single Cell Regulatory Networks using MINI-EX
We utilized MINI-EX, a pipeline specialized for inferring cell-type specific gene regulatory networks in plants24 to identify the gene regulatory networks in our samples. As gene regulatory network inference is dependent upon datasets containing transcription factors and binding sites not available in Sorghum and Setaria, we used maize transcription factors with 1-1 matches to Sorghum and Setaria genes for those species. This converted list of transcription factors was used as the TF_list parameter in the miniex.config file. We ran the MINI-EX pipeline using the default parameters but modified it to run on 32 CPU cores.
Co-Expression Conservation Between Maize Subgenomes and Sorghum.
To generate co-expression conservation scores between the two maize sub-genomes and the sorghum genome (Supplementary Table 8), we used our existing aggregated co-expression networks42. In brief, these networks are built by taking all publicly available data and calculating average correlations between gene pairs within experiments, standardizing within experiments, and then averaging to construct robust meta-analytic networks. We filtered these networks to a previously generated list of gene triplet pairs for the maize sub-genomes and the sorghum genome. Next, for each gene, we compare the top co-expression partners across species to determine the degree of functional conservation, as described in more detail in previous work 59. We calculated this by taking the ranks of a gene’s co-expression strength to all other genes in one species and using it to predict that gene’s top 10 co-expressed partners in the second species. This was then done again in the reverse direction, and the two scores were averaged (calculated as an AUROC). We then selected genes with the lowest co-expression scores (0.34 < FC.Score) and highest cell specificity () in the root cap (Supplementary Table 8; Extended Data Fig. 10i).
Formulation of a Dominance-Co-Expression-regulatory subfunctionalization Metric
To calculate the Dominance vs. regulatory subfunctionalization score, for each ortholog triplet (S, M1, M2) we calculated the number of cells in which M1 or M2 was dominant or co-expressed together in the same cells where the sorghum and Setaria ortholog was expressed. We defined dominance if the average expression of one of the two duplicate is two time superior as the average expression of the other duplicate in the same cell type. Co-expression was defined when both duplicates were expressed in the same cell type and their respective expression was below a 2-fold range difference. Regulatory subfunctionalization was defined when both duplicates are dominant in different cell types. Regulatory Neo-functionalization was defined when one or both duplicates are expressed in cell type in which the sorghum and Setaria ortholog were not expressed. In this dataset, a gene is defined as expressed if its expression is above the first quartile among genes detected in that cell type, this is necessary to normalize for cell type quality (certain cell types display more UMI and more gene detected per cells than others). The procedure also helps remove the background of very lowly expressed genes that results from noise generated by combining cells and nuclei together.
Score = (number of cells in which M1 is dominant * number of cells in which M2 is dominant) - (number of cell of the dominant ortholog - number of cell of the non dominant ortholog)
If the score is negative, the score is normalized by
If the score is positive, the score is normalized by dividing it by:
Cell Type Marker Identification
Each species marker genes were identified using FindAllmarkers functions from Seurat, log.FC= 0.25, pt.1 > 0.750 pt.2 < 0.250. Differential gene expression was done using the Findmarkers function from Seurat with default parameter function. For Fig2 e, Extended Data Fig. 4 c, 10 a, statistical analysis was performed on R using a pairwise Wilcoxon test with p.adjust method "BH" as data is not normally distributed.
Correlation analysis on Extended Data Fig 1 c was performed using Pearson correlation function on R between whole-root data coming from and single cell or single nuclei. Briefly averaged gene expression was calculated for each gene while combining every cell type using the AverageExpression function from Seurat.
For Fig 4 a, to generate p-values for evaluating the significance of the differences between each pair of AUROCs generated by MetaNeighbor, we utilized the two-sided Hanley McNeil test, which produces a Z-score for the difference60. As each MetaNeighbor AUROC is the averaged AUROC from two reciprocal tests between a pair of cell clusters, we chose the smaller of the two clusters as the number of true positives (NTP) to generate the most conservative p-value. The number of true negatives was the total number of cells, less the number of true positives. Following the calculation of Z-scores for each pairwise combination of AUROCs, we utilized the scipy.stats.norm.sf function in Python to convert the Z-scores into p-values for a two sided test.
“Half Mount” in situ Hybridization
Probes (Hairpin Chain Reaction (HCR) RNA-FISH) and reagents (including the Probe Hybridization Buffer, Probe Wash Buffer and Amplification buffer) are ordered from Molecular Instruments (https://www.molecularinstruments.com/shop)(Supplementary Table 9).
For fixation, germination paper containing 7-day old maize or sorghum roots are unrolled and small volume of fixative FAA (4% formaldehyde, 5% glacial acetic acid, 50% ethanol in RNAse free water) is pipetted onto each root. Then longitudinal sectioning of root tips is performed using a 15° microscalpel. Roots are cut up to ~3cm from the tip, then immediately fixed by transferring to FAA in 5ml screw caps and put under vacuum several times until they no longer float. Roots are then agitated at RT for at least 1 hour in a tube revolver. (All washes in the protocol are performed in a tube revolver or stated otherwise.)
Samples are dehydrated in a series of washes at RT: 70% ethanol for 15 min, 90% ethanol for 15 min, 100% ethanol 2x for 15 min each, 100% methanol 2x for 15 min each. Samples can then be stored at −20°C for several weeks. Samples are washed 2x for 15 min in 100% ethanol at RT before being permeabilized for 30 min in 50% Histo-Clear II / 50% EtOH at RT. Then they are incubated 2x for 30 minutes in a solution of 100% Histo-Clear II at RT. Each time, vacuum is applied for the first 10 minutes.
Samples are rehydrated through a series of washes: 50% Histo-Clear II / 50% EtOH for 15 min, 100% EtOH for 15 min, 50% EtOH / 50% DPBS-T (0.1% Tween20, 1x DPBS) for 15 min (roots will float up then settle after a few minutes), 100% DPBS-T 2x for 15 min (roots will float up again). Samples are incubated with Proteinase K (0.1 M Tris-HCl (pH 8), 0.05 M EDTA (pH 8), Proteinase K 80 μg ml−1 final) at RT under vacuum for 5 min then digested with Proteinase K for 25 min in a 37°C water bath with manual agitation every 5-10 minutes (roots should turn a little yellow after this step). Samples are washed 2x for 15 min in DPBS-T at RT then incubated with Fixative II (4% formaldehyde in DPBS-T) under gentle vacuum for 10 min then in a tube revolver for 30 mins at RT. They are then washed 2x for 15 min each in DPBS-T at RT. Roots are aliquoted into 2 mL Eppendorf tubes and incubated in 500 μL of HCR Probe Hybridization Buffer, vacuum is applied for 10 mins then roots are incubated for 1 hour at 37°C in a thermomixer with agitation (1000 rpm).
Samples can then be stored in Probe Hybridization Buffer at −20°C up to several weeks.
Probe buffers are made by adding 0.8 pmol of each probe set (e.g. 2 μL of the 1 μM stock) to 500 μL of HCR Probe Hybridization Buffer at 37°C. Pre-hybridization solution is removed and replaced with probe solution. Samples are hybridized by incubating overnight (~20h) at 37°C in a thermomixer with agitation (1000 rpm). The following day, excess probes are removed by washing 4x for 15 min each with 1 mL of HCR Probe Wash Buffer at 37°C in a thermomixer with agitation. Samples are washed 2x for 5 min each with 1 mL of 5x SSC-T (25% 20x SSC, 0.1% Tween20) at RT in a thermomixer with agitation. SSC-T is replaced with 500 μL of amplification buffer, gentle vacuum is applied in a fume hood for 10 minutes and then samples are pre-amplified by incubating in a tube rotator at RT for 50 min. While samples pre-amplify, 6 pmol of hairpin h1 and 6 pmol of hairpin h2 (i.e. 5 μL of the 3 μM stocks) are prepared, each in its own separate tube. Hairpins are snap-cooled by heating at 95°C for 90 seconds then kept in a dark drawer at RT for 30 min. Amplification solution is prepared by combining snap-cooled h1 and h2 hairpins in 250 μL of HCR Amplification Buffer at RT. Pre-amplification solution is removed and and replaced with amplification buffer containing hairpin solution overnight (~20h) in the dark at RT in a thermomixer with agitation (1000 rpm). Excess hairpins are removed by washing with 1 mL of 5x SSC-T at RT in a thermomixer with agitation, 2x for 5 min each, then 2x for 30 min each, 1x for 5 min. Samples are transferred onto a glass slide (in 5x SSC-T) and cut using a 30° microscalpel and arranged so that the cut face of the roots is facing upwards. They are then covered with coverslip and imaged on confocal microscope.
Statistics and Reproducibility
HCR-RNA-FISH experiment were performed:
|
Figure 2b: 1 experiment transverse: 2 strong, 1 weak longitudinal: 2 strong, 4 weak Extended Data Figure 7: a: 5 experiments 7 outer cap, 11 transverse, 32 longitudinal - all consistent c: 1 experiment transverse: 4 moderate signal longitudinal: 5 moderate signal d: 1 experiment transverse: 2 no signal, rest moderate-to-strong longitudinal: 1 too high, 5 moderate-to-strong e: 1 experiment transverse: 4 weak, 11 none longitudinal: 2 weak f: 1 experiment transverse: 2 strong 1 weak longitudinal: 2 strong, 4 weak g: 3 experiments transverse: 2 weak, 1 very weak, 1 no signal longitudinal: 2 weak, 8 no signal h: 2 experiments transverse: 1 weak longitudinal: 4 weak, 5 no signal i: 1 experiment transverse: 4 moderate longitudinal: 1 moderate, 1 no signal j: 1 experiment outer cap: 2 weak transverse: 2 weak, 3 no signal longitudinal: 3 weak k: 1 experiment transverse: 4 weak longitudinal: 5 weak |
l: 1 experiment outer cap: 1 weak longitudinal: 3 weak, 1 imaged too low m: 1 experiment transverse: 5 moderate longitudinal: 3 moderate, 1 no signal n: 3 experiments outer cap: 7 strong transverse: 3 strong, 1 no signal longitudinal: 25 strong Extended Data Figure 8 a: 4 experiments 2 outer, 5 transverse, 20 longitudinal - all consistent c: 2 experiments transverse: 3 strong, 2 moderate, 1 weak, 1 no signal longitudinal: 6 strong, 2 moderate, 4 weak, 11 none d: 3 experiments transverse: 7 strong, 2 no signal longitudinal: 7 strong, 1 moderate, 5 imaged too low, 1 none e: 1 experiment transverse: 3 weak longitudinal: 3 weak f: 1 experiment transverse: 3 no signal longitudinal: 5 weak g: 1 experiment outer: 1 moderate longitudinal: 4 moderate h: 1 experiment transverse: 1 very weak, 2 no signal longitudinal: 2 weak, 2 no signal i: 2 experiments transverse: 4 strong longitudinal: 8 strong, 7 imaged too low |
Spatial transcriptomics
Tissue fixation and embedding was performed as described previously61.
Sample slide preparation:
Formaldehyde-fixed paraffin-embedded tissue sections (10 μm) were placed within capture areas on Resolve Bioscience slides and incubated on a hot plate for 10 min at 60 °C to attach the samples to the slides. Slides were treated to allow deparaffinization, permeabilization, acetylation, and refixation. After complete dehydration of the samples, a few drops of SlowFade-Gold Antifade reagent (Invitrogen) were added to the sections and covered with a thin glass coverslip to prevent damage during shipment to Resolve BioSciences (Germany).
Sample pre-treatment and priming:
In preparation for hybridization, the coverslip is removed and the mounting reagent is washed twice in 1x PBS for 30 min 4 °C, followed by one min washes in 50% Ethanol and 70% Ethanol at room temperature. Samples were primed, after the aspiration of ethanol, by the addition of buffer BST1 for optimal hybridization of probes during the Molecular Cartography™ procedure, which uses a combination of probes and single-molecule fluorescence in-situ hybridization to identify 100 separate transcripts. Tissues were hybridized overnight at a constant temperature with all probes specific to the target genes. Samples were washed the next day to remove excess probes and fluorescently labeled in a two-step procedure. Regions of interest were imaged as described below and fluorescent signals were removed after imaging via a decolorization procedure. Color development, imaging, and decolorization were repeated over several cycles to develop a unique combinatorial code for every target gene that was derived from raw images as described below.
Probe design:
The probes for 100 genes were designed based on full-length protein-coding transcript sequences (Supplementary Table 9). Probe design is based the manufacturer’s proprietary algorithm, with probes available from the Resolve. After screening to generate probe candidates and discard ambiguous ones, the probes were mapped to the background transcriptome using ThermonucleotideBLAST, and probes with stable off-target hits were discarded.
Imaging:
Samples were imaged by Resolve BioSciences on a Zeiss Celldiscoverer 7, using the 50x Plan Apochromat water immersion objective with an NA of 1.2 and the 0.5x magnification changer, resulting in a 25x final magnification. Standard CD7 LED excitation light source, filters, and dichroic mirrors were used together with customized emission filters optimized for detecting specific signals. Excitation time per image was fixed at 1000 ms for each channel, 20 ms for DAPI, and 1 ms for Calcofluor White. A z-stack was taken at each region with a distance per z-slice according to the Nyquist-Shannon sampling theorem. A custom CD7 CMOS camera (Zeiss Axiocam Mono 712, 3.45 μm pixel size) was used. The imaging for the cell-wall specific stain, Calcofluor White, was done at the end of all primary imaging. Before the preprocessing of the images, all images were corrected for background fluorescence. Based on the raw data image, the 20% darkest local pixel values and positions were determined and copied to a new empty image (background image) having the same size as the image to be corrected. The remaining 80% of pixels of the background image were generated based upon the surrounding existing pixel values using a distance-weighted average value. Finally, the background-corrected image (bc-image) was created by subtracting the background image values from the raw data image values.
Extraction of features:
In the first step, a target value for the allowed number of maxima was calculated based on the area of the slice in μm2 multiplied by an empirically optimized factor (0.5x). The resulting target value was used to adapt the threshold for the algorithm iteratively searching local 2D-maxima. The threshold leading to the closest number of maxima equal to or smaller than the target value was used for further steps and the respective maxima were stored in a reiterative process for every image slice independently. Maxima that did not have a neighboring maximum in an adjacent slice (termed as z-group) within a radius of one pixel were excluded. For the resulting list of maxima, the absolute brightness (Babs), the local background (Bback), and the average brightness of the pixels surrounding the local maximum (Bperi) were measured and stored. The resulting maxima list was further filtered in an iterative loop by adjusting the allowed thresholds for (Babs-Bback) and (Bperi-Bback) to reach a feature target value based on the total volume of the 3D image. Only maxima still in a z-group with a size of at least 2 passed this stringent filter step. Each z-group was counted as one hit and the members of the z-groups with the highest absolute brightness were used as features to resemble 3D point clouds.
Determination of transformation matrices, pixel evaluation, and decoding: To align the raw data images from different imaging rounds, these images had to be corrected for the 6 degrees of freedom in 3D-space The extracted feature point clouds were used to find the transformation matrices to align the raw data images. Based on the transformation matrices, the corresponding images were processed by a rigid transformation using trilinear interpolation. The aligned images were used to create a profile for each pixel, which were then filtered for a variance from zero normalized by the total brightness of all pixels in the profile. Matched pixel profiles with the highest score were assigned as an ID to the pixel to further group the neighboring pixel with the same ID. The local 3D-maxima of the groups were determined as potential final transcript locations, which were additionally evaluated by the number of maxima in the raw data images where a maximum was expected. The finalized maxima were decoded by the fit to the corresponding code to be written to the results file and considered to resemble transcripts of the corresponding gene. The ratio of signals matching to codes used in the experiment and signals matching to codes not used in the experiment were used as estimation for specificity (false positives). Final image analysis was performed in ImageJ using the Polylux tool plugin from Resolve BioSciences to examine specific Molecular Cartography signals.
All raw RNA-seq data is available under GEO accession GSE225118.
Extended Data
Extended Data Fig. 1: Quality control and fidelity analysis of RNA-seq profiles using violin plots.
a Distribution of the number of UMI detected among cells vs. nuclei. b Distribution of the number of genes detected among cells vs. nuclei. c Pearson correlation distributions of gene expression from single-cell or single-nucleus compared to whole-root RNAseq data in Arabidopsis and maize. The distributions are derived by randomly sampling 2,000 genes for correlation analysis between cells and nuclei. The random sampling was repeated 250 times to generate the distribution of correlation values. Violin plots display show the kernel probability density of the data at different values, boxplot inside display as the middle black line is the median, exact media is displayed on the graphs, the lower and upper hinges correspond to the first and third quartiles (Q1,Q3), extreme line shows Q3+1.5xIQR to Q1-1.5xIQR (interquartile range-IQR). Dots beyond the extreme lines shows potential outliers.
Extended Data Fig. 2: Evaluation of agreement in nuclear and cell type profiles.
a, b UMAP clustering in Arabidopsis single-cells (a) and single-nuclei (b) clustered independently, showing clusters with the same diagnosed cell identities. c, d Dot plots showing expression levels per cluster and expression in percent of cells of the same set of cell-type specific markers in cells (c) or nuclei (d). The markers are in the same order in both plots.
Extended Data Fig. 3: Analysis of sensitivity of nuclear and cell profiles in distinguishing clusters and identifying markers.
a Arabidopsis down sampling analysis shows the number of cells needed to resolve different clusters. A branch signifies that a new cluster with a known cell type identity was distinguished at a given sample size. b A similar analysis using the single nucleus RNA-seq dataset, showing that more nuclei are needed to resolve the same number of clusters compared to cells in (a). Tracking the branches of graphs in (a) vs. (b) leads to a rule-of-thumb that two-fold more nuclei than cells are needed to identify clusters. c UMAP of the combined maize single-cell and -nuclei datasets, clusters are colored by cell type identity. d Dotplot of maize marker genes in cells (blue) or in nuclei (red), showing overall concordance of marker gene expression in the two datasets.
Extended Data Fig. 4: Analysis of differentially regulated genes and cell capture efficiency in nuclear vs. cellular profiles.
a, b Heatmaps of genes known to be induced by protoplast generation (Birnbaum et al., 2003) showing their expression in cells (a) vs. nuclei (b). The analysis shows that stress-induced genes also have higher expression in cells vs. nuclei, with a bias in specific cell types. c Distribution of expression levels of genes annotated for mRNA decay in cells or in nuclei, decay values from Sorenson et al., 2018. A significant increase in expression of mRNA decay-related genes was detected in nuclei, (n=1965 genes, Wilcoxon rank sum test, two-sided, p-value = 1.98e-11), the boxplots display the middle line is the median, the lower and upper hinges correspond to the first and third quartiles (Q1,Q3), extreme line shows Q3+1.5xIQR to Q1-1.5xIQR (interquartile range-IQR). Dots beyond the extreme lines shows potential outliers. d Proportion of cells vs nuclei present in each cell type cluster.
Extended Data Fig. 5: Analysis of marker gene identification in maize single nucleus vs. cell profiles.
a, b UMAPs of maize single-cell and single-nucleus RNA-seq data clustered independently. Only the single nucleus RNA-seq dataset displays a cluster annotated as columella, which is absent in the single-cell dataset. c, d Dotplot of maize marker genes for each cell type cluster, showing expression in cells (c) and in nuclei (d) datasets independently. Markers for columella outlined in the red box are only present in the single nucleus dataset.
Extended Data Fig. 6: Analysis of overall expression similarity among all cellular and nuclear clusters in the three monocot species studied.
a AUROC test comparing every cell type in all species for both cell and nuclei datasets, showing that clusters discovered in either cell or nuclei group by like cell type and not by either species or source of material (cells or nuclei). b-c UMAPs generated by additional integration of the dataset using a Python supervised integration method scGen. This method uses a variational autoencoder to learn the underlying latent space for the cell types. b Different colors represent the clusters identified by the Seurat integration mapped onto the new scGen integration, showing Seurat classification was in relative agreement with the scGen classification. i.e., scGEN clusters have relatively homogenous coloration. c The same UMAP as in (b), this time showing the species distribution. Overall, each cluster has cells from each of the three species.
Extended Data Fig. 7: In-situ hybridization corroborating evidence for marker localization in single cell/nuclei RNA-seq profiles in maize.
a-n in situ hybridization using Hairpin Chain Reaction (HCR) probes labeling various transcripts. Cross sections are on the left and longitudinal sections are on the right. UMAPs showing each transcript’s cluster localization are displayed next to each probe’s fluorescent image. Additionally, spatial transcriptomics imaging data of the same probe is shown in the right column for (c-e). The minimum/maximum values for each fluorescence channel (grey: autofluorescence, magenta: HCR probes) have been adjusted to show the localization more clearly in the merged image.
Extended Data Fig. 8: In-situ hybridization corroborates evidence for localization of marker gene expression from single-cell RNA-seq profiles in sorghum.
a-i In situ hybridization using Hairpin Chain Reaction (HCR) probes labeling various transcripts. Cross sections are on the left and longitudinal sections on the right (a,c,d,e). Longitudinal sections are shown in (f,g,h,i). UMAPs showing each transcript’s cluster localization are shown next to each probe’s fluorescent image. The minimum/maximum values for each fluorescence channel (grey: autofluorescence, magenta: HCR probes) have been adjusted to show the localization more clearly in the merged image.
Extended Data Fig. 9: Regulon conservation across species, and distribution of gene pair expression patterns.
a Conserved regulons found using MINI-EX and their pattern of expression. The regulon is labeled by the transcription factor that putatively regulates it in each row. b-d Distribution of genes pairs on the dominance vs. regulatory subfunctionalization scale for transposed, tandem and proximal duplicate pairs. In blue, neofunctionalized duplicates are shown as a percentage of the bar. e-g Distribution on the dominance to regulatory subfunctionalization scale for dispersed gene duplicate pairs binned in thirds by their Ks value. The graphs suggest that duplicates tend to lose co-expressed patterns and gain dominance over time. h Boxplot of Ks values showing the distribution among all the duplicate classes used in the analysis. In h, statistical analysis was performed using a Kruskal-Wallis one-way ANOVA followed by the Tukey test for all pairwise comparisons. Not sharing a letter represents statistical significance at p < 0.05. In boxplots the middle line is the median, the lower and upper hinges correspond to the first and third quartiles (Q1,Q3), extreme line shows Q3+1.5xIQR to Q1-1.5xIQR (interquartile range-IQR). Dots beyond the extreme lines shows potential outliers. h. n=10,104 WGD, n=860 Proximal, n=3,154 Transposed, n=7,552 Dispersed, n=1,448 Tandem.
Extended Data Fig. 10: Overall analysis of expression conservation in duplicate classes and analysis of columella expression across species.
a-c Dosage compensation analysis representing the expression ratios of maize over sorghum orthologous genes in tandem, transposed, and dispersed duplicate pairs. The first two boxplots represent cases in which a sorghum ortholog is expressed in the same homologous cell type as only a single maize duplicate (either M1 or M2). The third and fourth boxplots represent cases in which both homeologs are expressed in the same cell and a sorghum homolog is expressed in a homologous cell type. The last boxplot shows the ratio when both of the co-expressed homeologs are added together in the numerator, showing a mean ratio close to 1. The higher expression in the first two boxplots compared to the second two indicates dosage compensation. d Conservation rate of cis-regulatory elements between WGD homeolog pairs in promoters. The plot shows no major differences between co-expressed and dominant gene pairs, and no major differences among the different classes of duplication. e-h Distribution of maize genes displaying regulatory neofunctionalization of expression into new cell types. Colors signify the cell type of origin. i Heatmap of maize columella markers, with the orthologous gene expression in the maize cluster of the other two species. j Example of the gene DMR6 switching its expression between columella in maize to epidermis / cortex in sorghum. a-c, statistical analysis was performed using ANOVA followed by the Tukey test for all pairwise comparisons, Not sharing a letter represents statistical significance at p < 0.05. In boxplots the middle line is the median, the lower and upper hinges correspond to the first and third quartiles (Q1,Q3), extreme line shows Q3+1.5xIQR to Q1-1.5xIQR (interquartile range-IQR). Dots beyond the extreme lines shows potential outliers. a-h: n=10,104 WGD, n=860 Proximal, n=3,154 Transposed, n=7,552 Dispersed, n=1,448 Tandem.
Supplementary Material
Metric summary and details of different replicates performed in this study, number of cells nuclei genes, threshold used.
Arabidopsis clustering repartition of Nuclei or Cell alone and merged dataset
Differentially expressed genes between Nuclei and Cells for each species
Cell Type markers in Maize, Sorghum and Setaria, including conserved markers for each cell type across species.
Mini-Ex regulon prediction
GO_Enrichment_S_SM1_SM2_M1M2_SM1M2 used for Fig.3e.
Metrics of orthologs Dominance between M1 M2, including, cis-regulatory element predictions, Ka, Ks, Neofunctionalization caracteristics.
CococoNet Analysis all_functional_scores_calculated_Columella Enrichment Mucilage.
Probe references for In situ hybridization and molecular cartography
Acknowledgements
We thank Michael Purugganan and Gloria Coruzzi for helpful comments. This work was funded by National Science Foundation (IOS-1934388) to K.D.B., D.J, and J.G., the National Institutes of Health (R35GM136362) to K.D.B., and Human Frontiers of Science (LT000972/2018-L) to B.G., startup funds from the University of California Riverside to S.C.G. In addition, M.P. is funded by the William Randolph Hearst Scholarship from the School of Biological Sciences. J.G. is also supported by the National Institutes of Health (R01 LM012736 and R01 MH113005).
Footnotes
The authors declare no competing interests.
Supplementary Information is available for this paper.
Material requests should be addressed to K.D.B.
Data Availability
All reference genomes were downloaded from Arabidopsis TAIR10.38, at https://www.arabidopsis.org/, for Maize B73 v4, Sorghum bicolor v3 and Setaria viridis v2 reference genomes at https://plants.ensembl.org/.
All raw scRNA-seq and snRNA-seq data, expression matrices and analyzed R-Seurat objects are available under GEO accession (GSE225118).
All data used to generate figures is available at https://figshare.com/articles/dataset/Data_for_Guillotin_et_al_/22331002, except for the following figures, for which the data can be found under GEO accession GSE225118, in the following deposited files: Arabidopsis_Cells_Nuclei_Seurat_Obj.RData.gz (Fig. 1c; Extended Data Fig. 2c,d; Extended Data Fig. 4a,b), Maize_Sorghum_Setaria_Cells_Nuclei_Seurat_Obj.RData.gz (Extended Data Fig. 3d, Extended Data Fig. 5c,d). Extended Data Figs. 2c,d; 3d; and Fig. 5c,d are clustered separately.
In Supplementary Information, data on scRNA-seq quality control are provided in Supplementary Table 1. Analysis of sc- vs sn RNA-seq data is provided in Supplementary Tables 2 and 3. All cell specific marker genes for all species, including a shared pan library of marker genes, are provided in Supplementary Table 4. Data on regulon analysis is provided in Supplementary Table 5. All data on duplicate genes are provided in Supplementary Tables 6 and 7. Cellular divergence analysis is provided in Supplementary Table 8 and in-situ probe information is provided in Supplementary Table 9.
Material requests should be addressed to K.D.B.
References
- 1.Woodhouse MR & Hufford MB Parallelism and convergence in post-domestication adaptation in cereal grasses. Philos. Trans. R. Soc. B Biol. Sci 374, (2019). [DOI] [PMC free article] [PubMed] [Google Scholar]
- 2.Rich-Griffin C et al. Single-Cell Transcriptomics: A High-Resolution Avenue for Plant Functional Genomics. Trends Plant Sci. 25, 186–197 (2020). [DOI] [PubMed] [Google Scholar]
- 3.Marioni JC & Arendt D How Single-Cell Genomics Is Changing Evolutionary and Developmental Biology. Annu. Rev. Cell Dev. Biol 33, 537–553 (2017). [DOI] [PubMed] [Google Scholar]
- 4.Shafer MER Cross-Species Analysis of Single-Cell Transcriptomic Data. Front. Cell Dev. Biol 7, 175 (2019). [DOI] [PMC free article] [PubMed] [Google Scholar]
- 5.Kajala K et al. Innovation, conservation, and repurposing of gene function in root cell type development. Cell 184, 3333–3348.e19 (2021). [DOI] [PubMed] [Google Scholar]
- 6.Swigonova Z et al. On the tetraploid origin of the maize genome. Comp. Funct. Genomics 5, 281–284 (2004). [DOI] [PMC free article] [PubMed] [Google Scholar]
- 7.Swigonova Z Close Split of Sorghum and Maize Genome Progenitors. Genome Res. 14, 1916–1923 (2004). [DOI] [PMC free article] [PubMed] [Google Scholar]
- 8.Kozlova LV, Nazipova AR, Gorshkov OV, Petrova AA & Gorshkova TA Elongating maize root: zone-specific combinations of polysaccharides from type I and type II primary cell walls. Sci. Rep 10, 1–20 (2020). [DOI] [PMC free article] [PubMed] [Google Scholar]
- 9.Ma W et al. The mucilage proteome of maize (Zea mays L.) primary roots. J. Proteome Res 9, 2968–2976 (2010). [DOI] [PubMed] [Google Scholar]
- 10.Schittenhelm S & Schroetter S Comparison of Drought Tolerance of Maize, Sweet Sorghum and Sorghum-Sudangrass Hybrids. J. Agron. Crop Sci 200, 46–53 (2014). [Google Scholar]
- 11.Zhang Y et al. Differentially regulated orthologs in sorghum and the subgenomes of maize. Plant Cell 29, 1938–1951 (2017). [DOI] [PMC free article] [PubMed] [Google Scholar]
- 12.Zheng Z et al. Shared Genetic Control of Root System Architecture between Zea mays and Sorghum bicolor1[OPEN]. Plant Physiol. 182, 977–991 (2020). [DOI] [PMC free article] [PubMed] [Google Scholar]
- 13.McKain MR et al. Ancestry of the two subgenomes of maize. BioRxiv (2018). doi: 10.1101/352351 [DOI] [Google Scholar]
- 14.Schnable JC, Springer NM & Freeling M Differentiation of the maize subgenomes by genome dominance and both ancient and ongoing gene loss. Proc. Natl. Acad. Sci. U. S. A 108, 4069–4074 (2011). [DOI] [PMC free article] [PubMed] [Google Scholar]
- 15.Bawa G, Liu Z, Yu X, Qin A & Sun X Single-Cell RNA Sequencing for Plant Research: Insights and Possible Benefits. Int. J. Mol. Sci 23, (2022). [DOI] [PMC free article] [PubMed] [Google Scholar]
- 16.Farmer A, Thibivilliers S, Ryu KH, Schiefelbein J & Libault M Single-nucleus RNA and ATAC sequencing reveals the impact of chromatin accessibility on gene expression in Arabidopsis roots at the single-cell level. Mol. Plant 14, 372–383 (2021). [DOI] [PubMed] [Google Scholar]
- 17.Long Y et al. FlsnRNA-seq: protoplasting-free full-length single-nucleus RNA profiling in plants. Genome Biol. 22, 1–14 (2021). [DOI] [PMC free article] [PubMed] [Google Scholar]
- 18.Marand AP, Chen Z, Gallavotti A & Schmitz RJ A cis-regulatory atlas in maize at single-cell resolution. Cell 184, 3041–3055.e21 (2021). [DOI] [PubMed] [Google Scholar]
- 19.Ortiz-Ramírez C et al. Ground tissue circuitry regulates organ complexity in maize and Setaria. Science (80-. ). 374, 1247–1252 (2021). [DOI] [PMC free article] [PubMed] [Google Scholar]
- 20.Ding J et al. Systematic comparison of single-cell and single-nucleus RNA-sequencing methods. Nat. Biotechnol 38, 737–746 (2020). [DOI] [PMC free article] [PubMed] [Google Scholar]
- 21.Evert Ray F.. Esau’s Plant Anatomy, Meristems, Cells, and Tissues of the Plant Body: their Structure, Function, and Development. 3rd edn. 99, (2006). [Google Scholar]
- 22.Sorenson RS, Deshotel MJ, Johnson K, Adler FR & Sieburth LE Arabidopsis mRNA decay landscape arises from specialized RNA decay substrates, decapping-mediated feedback, and redundancy. Proc. Natl. Acad. Sci. U. S. A 115, E1485–E1494 (2018). [DOI] [PMC free article] [PubMed] [Google Scholar]
- 23.Lotfollahi M, Wolf FA & Theis FJ scGen predicts single-cell perturbation responses. Nat. Methods 16, 715–721 (2019). [DOI] [PubMed] [Google Scholar]
- 24.Ferrari C, Manosalva Pérez N & Vandepoele K MINI-EX: Integrative inference of single-cell gene regulatory networks in plants. Mol. Plant 15, 1807–1824 (2022). [DOI] [PubMed] [Google Scholar]
- 25.Donner TJ, Sherr I & Scarpella E Regulation of preprocambial cell state acquisition by auxin signaling in Arabidopsis leaves. Development 136, 3235–3246 (2009). [DOI] [PubMed] [Google Scholar]
- 26.Wang S et al. RppM, Encoding a Typical CC-NBS-LRR Protein, Confers Resistance to Southern Corn Rust in Maize. Front. Plant Sci 13, (2022). [DOI] [PMC free article] [PubMed] [Google Scholar]
- 27.Ingram GC, Magnard JL, Vergne P, Dumas C & Rogowsky PM ZmOCL1, an HDGL2 family homeobox gene, is expressed in the outer cell layer throughout maize development. Plant Mol. Biol 40, 343–354 (1999). [DOI] [PubMed] [Google Scholar]
- 28.Li Z, Tang J, Srivastava R, Bassham DC & Howell SH The transcription factor bZIP60 links the unfolded protein response to the heat stress response in maize. Plant Cell 32, 3559–3575 (2020). [DOI] [PMC free article] [PubMed] [Google Scholar]
- 29.Guo Z et al. MRG1/2 histone methylation readers and HD2C histone deacetylase associate in repression of the florigen gene FT to set a proper flowering time in response to day-length changes. New Phytol. 227, 1453–1466 (2020). [DOI] [PubMed] [Google Scholar]
- 30.Grover CE et al. Homoeolog expression bias and expression level dominance in allopolyploids. New Phytol. 196, 966–971 (2012). [DOI] [PubMed] [Google Scholar]
- 31.Lynch M & Force A The Probability of Duplicate Gene Preservation by Subfunctionalization. Genetics 154, 459–473 (2000). [DOI] [PMC free article] [PubMed] [Google Scholar]
- 32.Chaudhary B et al. Reciprocal silencing, transcriptional bias and functional divergence of homeologs in polyploid cotton (Gossypium). Genetics 182, 503–517 (2009). [DOI] [PMC free article] [PubMed] [Google Scholar]
- 33.Hughes TE, Langdale JA & Kelly S The impact of widespread regulatory neofunctionalization on homeolog gene evolution following whole-genome duplication in maize. Genome Res. 24, 1348–1355 (2014). [DOI] [PMC free article] [PubMed] [Google Scholar]
- 34.Zhao M, Zhang B, Lisch D & Ma J Patterns and consequences of subgenome differentiation provide insights into the nature of paleopolyploidy in plants. Plant Cell 29, 2974–2994 (2017). [DOI] [PMC free article] [PubMed] [Google Scholar]
- 35.Li L et al. Co-expression network analysis of duplicate genes in maize (Zea mays L.) reveals no subgenome bias. BMC Genomics 17, 1–16 (2016). [DOI] [PMC free article] [PubMed] [Google Scholar]
- 36.Birchler JA & Veitia RA Gene balance hypothesis: Connecting issues of dosage sensitivity across biological disciplines. Proc. Natl. Acad. Sci. U. S. A 109, 14746–14753 (2012). [DOI] [PMC free article] [PubMed] [Google Scholar]
- 37.Muyle A, Marais GAB, Bačovský V, Hobza R & Lenormand T Dosage compensation evolution in plants: theories, controversies and mechanisms. Philos. Trans. R. Soc. B Biol. Sci 377, (2022). [DOI] [PMC free article] [PubMed] [Google Scholar]
- 38.Walsh JR, Woodhouse MR, Andorf CM & Sen TZ Tissue-specific gene expression and protein abundance patterns are associated with fractionation bias in maize. BMC Plant Biol. 20, 1–11 (2020). [DOI] [PMC free article] [PubMed] [Google Scholar]
- 39.Renny-Byfield S, Rodgers-Melnick E & Ross-Ibarra J Gene fractionation and function in the ancient subgenomes of maize. Mol. Biol. Evol 34, 1825–1832 (2017). [DOI] [PubMed] [Google Scholar]
- 40.Xu X et al. Single-cell RNA sequencing of developing maize ears facilitates functional analysis and trait candidate gene discovery. Dev. Cell 56, 557–568.e6 (2021). [DOI] [PMC free article] [PubMed] [Google Scholar]
- 41.Rastogi S & Liberles DA Subfunctionalization of duplicated genes as a transition state to neofunctionalization. BMC Evol. Biol 5, 28 (2005). [DOI] [PMC free article] [PubMed] [Google Scholar]
- 42.Lee J, Shah M, Ballouz S, Crow M & Gillis J CoCoCoNet: Conserved and comparative co-expression across a diverse set of species. Nucleic Acids Res. 48, W566–W571 (2021). [DOI] [PMC free article] [PubMed] [Google Scholar]
- 43.Van Deynze A et al. Nitrogen fixation in a landrace of maize is supported by a mucilage-associated diazotrophic microbiota. PLoS Biol. 16, 1–21 (2018). [DOI] [PMC free article] [PubMed] [Google Scholar]
- 44.Galloway AF, Knox P & Krause K Sticky mucilages and exudates of plants: putative microenvironmental design elements with biotechnological value. New Phytol. 225, 1461–1469 (2020). [DOI] [PubMed] [Google Scholar]
- 45.Werker E & Kislev M Mucilage on the root surface and root Hairs of Sorghum: Heterogeneity in structure, manner of production and site of accumulation. Ann. Bot 42, 809–816 (1978). [Google Scholar]
- 46.Voiniciuc C, Guenl M, Schmidt MH-W & Usadel B Highly Branched Xylan Made by IRX14 and MUCI21 Links Mucilage to Arabidopsis Seeds. Plant Physiol. 169, pp.01441.2015 (2015). [DOI] [PMC free article] [PubMed] [Google Scholar]
- 47.Wang B et al. Genome-wide selection and genetic improvement during modern maize breeding. Nat. Genet 52, 565–571 (2020). [DOI] [PubMed] [Google Scholar]
- 48.Arendt D The evolution of cell types in animals: Emerging principles from molecular studies. Nat. Rev. Genet 9, 868–882 (2008). [DOI] [PubMed] [Google Scholar]
- 49.Wang X et al. Genome alignment spanning major poaceae lineages reveals heterogeneous evolutionary rates and alters inferred dates for key evolutionary events. Mol. Plant 8, 885–898 (2015). [DOI] [PubMed] [Google Scholar]
Methods References
- 50.Efroni I, Ip P-L, Nawy T, Mello A & Birnbaum KD Quantification of cell identity from single-cell gene expression profiles. Genome Biol. 16, 9 (2015). [DOI] [PMC free article] [PubMed] [Google Scholar]
- 51.Stuart T et al. Comprehensive Integration of Single-Cell Data. Cell 177, 1888–1902 e21 (2019). [DOI] [PMC free article] [PubMed] [Google Scholar]
- 52.Hafemeister C & Satija R Normalization and variance stabilization of single-cell RNA-seq data using regularized negative binomial regression. Genome Biol. 20, 296 (2019). [DOI] [PMC free article] [PubMed] [Google Scholar]
- 53.Hernández Coronado M et al. Repel or Repair: Plant Glutamate Receptor-Like Channels Mediate a Defense vs. Regeneration Tradeoff. SSRN Electron. J (2021). doi: 10.2139/ssrn.3818443 [DOI] [Google Scholar]
- 54.Raju SKK, Ledford SM & Niederhuth CE DNA methylation signatures of duplicate gene evolution in angiosperms. bioRxiv 2020.08.31.275362 (2021). [DOI] [PMC free article] [PubMed] [Google Scholar]
- 55.Yanai I et al. Genome-wide midrange transcription profiles reveal expression level relationships in human tissue specification. Bioinformatics 21, 650–659 (2005). [DOI] [PubMed] [Google Scholar]
- 56.Crow M, Paul A, Ballouz S, Huang ZJ & Gillis J Characterizing the replicability of cell types defined by single cell RNA-sequencing data using MetaNeighbor. Nat. Commun 9, 884 (2018). [DOI] [PMC free article] [PubMed] [Google Scholar]
- 57.Fischer S, Crow M, Harris BD & Gillis J Scaling up reproducible research for single-cell transcriptomics using MetaNeighbor. Nat. Protoc 16, 4031–4067 (2021). [DOI] [PMC free article] [PubMed] [Google Scholar]
- 58.Wolf FA, Angerer P & Theis FJ SCANPY: large-scale single-cell gene expression data analysis. Genome Biol. 19, 15 (2018). [DOI] [PMC free article] [PubMed] [Google Scholar]
- 59.Crow M, Suresh H, Lee J & Gillis J Coexpression reveals conserved gene programs that co-vary with cell type across kingdoms. Nucleic Acids Res. 50, 4302–4314 (2022). [DOI] [PMC free article] [PubMed] [Google Scholar]
- 60.Hanley JA & McNeil BJ A method of comparing the areas under receiver operating characteristic curves derived from the same cases. Radiology 148, 839–843 (1983). [DOI] [PubMed] [Google Scholar]
- 61.Jackson D, Veit B & Hake S Expression of maize KNOTTED1 related homeobox genes in the shoot apical meristem predicts patterns of morphogenesis in the vegetative shoot. Development 120, 405–413 (1994). [Google Scholar]
Associated Data
This section collects any data citations, data availability statements, or supplementary materials included in this article.
Supplementary Materials
Metric summary and details of different replicates performed in this study, number of cells nuclei genes, threshold used.
Arabidopsis clustering repartition of Nuclei or Cell alone and merged dataset
Differentially expressed genes between Nuclei and Cells for each species
Cell Type markers in Maize, Sorghum and Setaria, including conserved markers for each cell type across species.
Mini-Ex regulon prediction
GO_Enrichment_S_SM1_SM2_M1M2_SM1M2 used for Fig.3e.
Metrics of orthologs Dominance between M1 M2, including, cis-regulatory element predictions, Ka, Ks, Neofunctionalization caracteristics.
CococoNet Analysis all_functional_scores_calculated_Columella Enrichment Mucilage.
Probe references for In situ hybridization and molecular cartography
Data Availability Statement
All reference genomes were downloaded from Arabidopsis TAIR10.38, at https://www.arabidopsis.org/, for Maize B73 v4, Sorghum bicolor v3 and Setaria viridis v2 reference genomes at https://plants.ensembl.org/.
All raw scRNA-seq and snRNA-seq data, expression matrices and analyzed R-Seurat objects are available under GEO accession (GSE225118).
All data used to generate figures is available at https://figshare.com/articles/dataset/Data_for_Guillotin_et_al_/22331002, except for the following figures, for which the data can be found under GEO accession GSE225118, in the following deposited files: Arabidopsis_Cells_Nuclei_Seurat_Obj.RData.gz (Fig. 1c; Extended Data Fig. 2c,d; Extended Data Fig. 4a,b), Maize_Sorghum_Setaria_Cells_Nuclei_Seurat_Obj.RData.gz (Extended Data Fig. 3d, Extended Data Fig. 5c,d). Extended Data Figs. 2c,d; 3d; and Fig. 5c,d are clustered separately.
In Supplementary Information, data on scRNA-seq quality control are provided in Supplementary Table 1. Analysis of sc- vs sn RNA-seq data is provided in Supplementary Tables 2 and 3. All cell specific marker genes for all species, including a shared pan library of marker genes, are provided in Supplementary Table 4. Data on regulon analysis is provided in Supplementary Table 5. All data on duplicate genes are provided in Supplementary Tables 6 and 7. Cellular divergence analysis is provided in Supplementary Table 8 and in-situ probe information is provided in Supplementary Table 9.
Material requests should be addressed to K.D.B.


