

Abstract
Acquired drug resistance (ADR) is common among adolescents living with perinatal HIV (APHI) in sub-Saharan Africa (SSA). Personalized management has the potential to improve pediatric antiretroviral therapy (ART), even in the presence of long-term treatment and HIV-1 subtype diversity. We sought to evaluate the effect of HIV-1 mutational profiling on immuno-virological response and ADR among APHI. A cohort-study was conducted from 2018-2020 among 311 APHI receiving ART in Cameroon. Clinical, immunological and virological responses were measured at enrolment (T1), 6-months (T2) and 12-months (T3). Immunological failure (IF: CD4 #x003C;250 cells/mm3), VF (viremia ≥1,000 copies/ml), and ADR were analyzed, with P#x003C;0.05 considered significant. Mean age was 15(±3) years; male-female ratio was 1:1; median [IQR] ART-duration was 36[21-81] months. At T1, T2, and T3 respectively, adherence-level was 66.4, 58.3 and 66.5%; 14 viral clades were found, driven by CRF02_AG (58.6%); ADR-mutations favored increased switch to second-line ART (16.1, 31.2, and 41.9%, P#x003C;0.0001). From T1-T3 respectively, there were declining rates of IF (25.5, 18.9, and 9.83%, P#x003C;0.0001), VF (39.7, 39.9, and 28.2%, P=0.007), and HIVDR (96.4, 91.7, and 85.0%, P=0.099). Predictors of ADR were being on first-line ART (P=0.045), high viremia at enrolment (AOR=12.56, P=0.059), and IF (AOR=5.86, P=0.010). Of note, optimized ART guided by mutational profile (AOR=0.05, P=0.002) was protective. Moreover, full Tenofovir+Lamivudine+Dolutegravir efficacy was predicted in 77 and 62% of APHI respectively after first- and second-line failure. Among APHI in this SSA setting, viral mutational profiling prompts the use of optimized Dolutegravir-based ART regimens, leading to improved immuno-virological response and declining ADR burdens. Thus, implementing personalized HIV medicine in this vulnerable population would substantially improve ART response and the achievement of the 95-95-95 goals in these underserved populations.
Key words: HIV care, viral load, antiretroviral therapy, HIV drug resistance, adolescents, Cameroon
Introduction
Over the last decade, the global AIDS prevention and control strategy has registered significant progress towards reducing AIDS-related mortality (1,2). Despite frequent advancement to a chronic state, the specifics of HIV progression from person-person may vary significantly and therefore manifest differently in each affected individual. This variability is alarming, posing the question whether a standard-fixed treatment regimen is optimal for everybody (3,4). The fact that the genetic and physiological make-up of an individual may permit them to benefit from a drug or high dosing regimen while being tolerant to severe side effects, and the availability of multiple ART regimens suggests that customization of treatment to specific individuals or groups of individuals might be envisioned (3,4).
HIV prevalence in Cameroon as of 2018 was 2.7% (5), the country being one of the 15 highest burden countries in terms of HIV infection among adolescents (6). The high rate of virological failure in children and limited laboratory monitoring, result in delayed detection of treatment failure, leading to accumulation of HIVDR at rates as high as 90% among APHI in virological failure, which jeopardizes treatment outcomes (7).
The global scale-up of combination antiretroviral therapy under the public health approach of standardized and simplified regimens and the implementation of the WHO test and treat strategy, has led to improved access to treatment for millions of people, a reduction in new infections as well as HIV-associated morbidity and mortality (2). However, current evidence suggests that children and adolescents infected with HIV face increased risks of developing HIVDR (7). This may be due to their acquisition of drug-resistant HIV strains during the perinatal period, or exposure to antiretroviral drugs (ARVs) with low genetic barriers to resistance for prolonged periods, frequent ARV stockouts, and suboptimal adherence to ART (7,8). Additionally, the limited availability of therapeutic options in Cameroon, with only three treatment regimens available (9), coupled with the scarcity of options for salvage therapies and limited laboratory monitoring, lead to delayed detection of treatment failure. As a result, the accumulation of HIV drug-resistance mutations becomes more likely.
With this perspective in mind, this study aimed at providing evidence-based recommendations to improve the long-term management, and antiretroviral treatment outcomes of adolescents living with HIV in rural and urban contexts of the Centre region of Cameroon. We evaluated therapeutic response to first- and second-line ART regimens, HIV-1 drug resistance profiles, and genotypes in urban and rural settings of the Centre Region of Cameroon over a one-year follow-up period.
Materials and methods
A prospective cohort-study was conducted from 2018-2020 among 311 APHI receiving ART in one of the selected health facilities within the ‘Resistance Evolution among Adolescents in Yaoundé and its surroundings’ (READY-study) in the Centre region of Cameroon. Participants were recruited following exhaustive sampling, and follow-up was performed at enrollment (T1), 6 months (T2), and 12 months (T3).
Sampling method and eligibility criteria.
Consecutive and exhaustive following eligibility criteria.
Eligibility criteria Inclusion criteria.
APHI with documented infection route; aged 10-19 years; receiving a standard reverse transcriptase inhibitor-based (RTI-based) first- or Ritonavir-boosted protease inhibitor-based (PI/r-based) second-line ART regimen for at least 6-months; having provided written assent, and informed consent from their legal guardian(s).
Non-inclusion criteria.
Not formally registered in any ART monitoring system; reported to be ART-naïve; on a drug regimen not included in the national guidelines; on treatment interruption.
Exclusion criteria.
Participants who freely withdrew from the study and transferred out of a study site before mid- or endpoint.
Clinical and laboratory procedures.
CD4 cell count was performed using the Pima CD4 (Abbott/Pantech (Pty) Ltd, Westville, South-Africa) automatic test, and plasma viral load measurement using the Abbott Applied Biosystem platform (Real Time PCR AB m2000RT), with a detection threshold of 40 copies/ml (lower) and 10,000,000 copies/ml (upper).
Genotypic resistance testing (GRT) was carried out at each time point among participants with plasma viral load (PVL) ≥1,000 RNA copies/ml using an in-house protocol as previously described by our working group (10) using blood samples stored at -80˚C. The sequences obtained were assembled and edited using Recall CDC Atlanta GA USA software and drug resistance mutations (DRMs) interpreted using Stanford HIVdb.v8.8; Subtyping was done using MEGA v10 for molecular phylogeny.
Data interpretation.
The major outcomes were the trends of immune-virological failure among APHI, HIVDR profile, and viral genetic diversity. Adequate immunological status was defined as CD4 ≥250 cells/mm3 and Immunological failure (IF) as #x003C;250 CD4 cells/mm311; virological success as PVL #x003C;50 RNA copies/ml; virological suppression (VS) as PVL #x003C;1,000 HIV-1 RNA copies/ml, and virological failure (VF) as PVL ≥1,000 RNA copies/ml (12). Self-reported adherence was evaluated, with poor adherence defined as > one missed ARV dose within 30 days preceding sample collection. Moreover, adequate ART exposure was defined as being on an active HAART regimen as per efficacy scores from the Stanford HIV database v8.8, and respect to previous genotypic resistance test (GRT)-guided switch of ART recommendation was also assessed.
Statistical analysis.
Data were analyzed using SPSS v22 with P#x003C;0.05 considered statistically significant. Chi-square and Fisher's exact tests were used for determining associations, multivariate logistic regression models to identify independently associated factors, and Kaplan Meier curves to examine time to immunological failure and VF, with the use of a log-rank test to test the significance of observed differences between groups.
Ethical considerations.
Ethical clearance was obtained from the National ethics committee for Research on human subjects № 2018/01/981/CE/CNERSH/SP. A research authorization was obtained from the Chantal Biya international reference center (CIRCB) directorate and administrative authorizations from the study sites. Written informed consent and assent were obtained from the parents or legal guardians and from the participants respectively. Confidentiality and core ethical values were respected. Participants were assigned unique identifiers at enrolment, consent and assent forms were stored in locked cabinets, and data were transcribed into password-protected computers. Laboratory results were freely delivered to each participant for improved clinical management.
Table IA.
Socio-demographic data of the study population.
| Enrolment (T1) | 6-months (T2) | 12-months (T3) | ||||
|---|---|---|---|---|---|---|
| Frequency | Percentage | Frequency | Percentage | Frequency | Percentage | |
| Age (years) | ||||||
| 10-14 | 169 | 54.3 | 108 | 39.7 | 102 | 42.3 |
| 15-19 | 142 | 45.7 | 164 | 60.3 | 139 | 57.7 |
| Gender | ||||||
| Male | 142 | 46.1 | 124 | 45.6 | 105 | 43.8 |
| Female | 166 | 53.9 | 148 | 54.4 | 135 | 56.2 |
| Site group | ||||||
| Urban (U) | 213 | 68.5 | 198 | 72.8 | 184 | 75.7 |
| Rural (R) | 98 | 31.5 | 74 | 27.2 | 59 | 24.3 |
| Mean age (±SD) | ||||||
| U | 15 (±3) | - | 16 (±3) | - | 15 (±3) | - |
| R | 13 (±3) | - | 14 (±3) | - | 15 (±3) | - |
Results
Overall, 311 APHI were included at the enrolment phase (T1) with 272 followed-up at 6-months (T2), and 243 at 12-months (T3). Majority (53.9, 54.4, and 56.2%) of participants were females from T1-T3 respectively, with mean age of 15 (±3) years; and median [IQR] ART-duration of 36 [21-81] months (Table IA). Median [IQR] CD4 count was [565 (250-85), 504 (305-776), and 586 (387-811) cells/mm3] from T1 to T3 respectively, while median [IQR] PVL was [60(40-24730), 92 (40-13808) and 51 (40-2622) RNA copies/ml]. There was a statistically significant decline in immunological and virological failure across time points (P#x003C;0.0001 and P=0.007 respectively) (Fig. 1A and B). Elsewhere, there was a decreasing median [IQR] duration on first-line reverse transcriptase inhibitor-based (RTI) ART [36.0 (21.0-81.0), 31.0 (10.0-55.5), and 23.5 (9.0-60.0) months], with a corresponding increased rate of switch to second-line ART, with P#x003C;0.0001 (Table IB).
Factors influencing immunological failure.
At enrolment, younger adolescents were approximately three-times more likely to experience IF (OR=2.90, P=0.0002), with adolescents in early clinical stages having five-times increased odds of IF (OR=5.02, P=0.0013). Moreover, participants in VF had about 9-fold higher odds of IF (OR=8.73, P=0.0001) (Table IIA). At 6-months follow-up, early clinical stages I/II were protective against IF (OR=0.29, P=0.002), with first-line participants having decreased odds of experiencing IF (OR=0.49, P=0.026). In addition, participants experiencing VF were more likely to experience IF (OR=3.96, P=0.0001). IF at enrolment at enrolment was strongly associated to subsequent IF at 6-months (OR=10.90, P=0.0001), as well as high viremia at enrolment >5log (OR=4.71, P=0.0001). Finally, at 12-months follow-up, VF was a strong predictor of IF (OR=4.88, P=0.0002), meanwhile, IF at enrolment at enrolment appeared protective (OR=0.21, P=0.0003).
After multivariate analysis, younger age adolescence; early clinical stages (I/II), and VF were independent risk factors to IF at T1, with VF, follow-up in rural sites, and CD4 #x003C;250 cells/mm3 at enrolment being independent predictors of IF at T2 (Table IIB), and finally, VF and IF at enrolment (T1) being an independent risk factor, and a protective factor respectively of IF at T3.
Factors influencing virological failure.
As concerns VF, at enrolment, younger adolescents were 1.60-times more likely to experience VF (OR=1.60, P=0.047), participants in early clinical stages and those in immunological failure had 3.49 and 8.73-fold increased risks of VF respectively (P=0.017 and 0.0001 respectively) (Table IIC). At 6-months follow-up, participants from rural study sites were 2-times more likely to experience VF (OR=2.08, P=0.008). Those in early clinical stages I/II were less likely to experience VF (OR=0.21, P=0.0003), on the contrary, those on first-line ART were 1.83-times more likely to experience VF (OR=1.83, P=0.0345). Furthermore, good adherence to ART decreased the likelihood of experiencing VF, (OR=0.56, P=0.025). IF increased the odds of experiencing VF (OR=3.96, P=0.0001). Participants who were in IF at enrolment had increased odds of VF, (OR=2.02, P=0.023) as well as those with viremia at enrolment ≥5 log (OR=5.01, P=0.0001) (Table IIC). At 12-months follow-up, participants with good adherence were two-times more likely to experience VF (OR=2.19, P=0.008). Likewise, participants with IF had a 4.88 increase in likelihood of experiencing VF (OR=4.88, P=0.0002).
Table IB.
Clinical and Biological data of study population.
| Enrolment (T1) | 6-months (T2) | 12-months (T3) | ||||||||
|---|---|---|---|---|---|---|---|---|---|---|
| Frequency | Percentage | Frequency | Percentage | Frequency | Percentage | P-value | ||||
| Clinical stage | ||||||||||
| I/II | 286 | 94.7 | 245 | 90.1 | 199 | 90.9 | 0.092 | |||
| III/IV | 16 | 5.3 | 27 | 9.9 | 20 | 9.1 | ||||
| ART line | ||||||||||
| First | 256 | 83.9 | 181 | 68.8 | 129 | 58.1 | #x003C;0.0001 | |||
| Second | 49 | 16.1 | 82 | 31.2 | 93 | 41.9 | ||||
| Adherence | ||||||||||
| Good | 196 | 66.4 | 158 | 58.3 | 153 | 66.5 | 0.076 | |||
| Poor | 99 | 33.6 | 113 | 41.7 | 77 | 33.5 | ||||
| CD4 classes | ||||||||||
| ≥250 | 202 | 74.5 | 215 | 81.1 | 211 | 90.2 | #x003C;0.0001 | |||
| #x003C;250 | 69 | 25.5 | 50 | 18.9 | 23 | 9.8 | ||||
| PVL classes | ||||||||||
| ≥1,000 | 121 | 39.7 | 105 | 39.9 | 68 | 28.2 | 0.007 | |||
| #x003C;1,000 | 184 | 60.3 | 158 | 60.1 | 173 | 71.8 | ||||
Figure 1A.
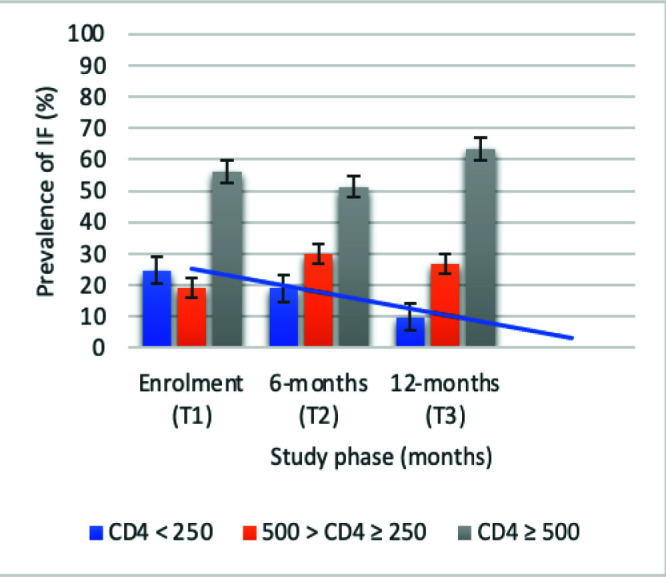
Trends of Immunological failure. Blue line: decreasing prevalence of IF overtime.
Figure 1B.
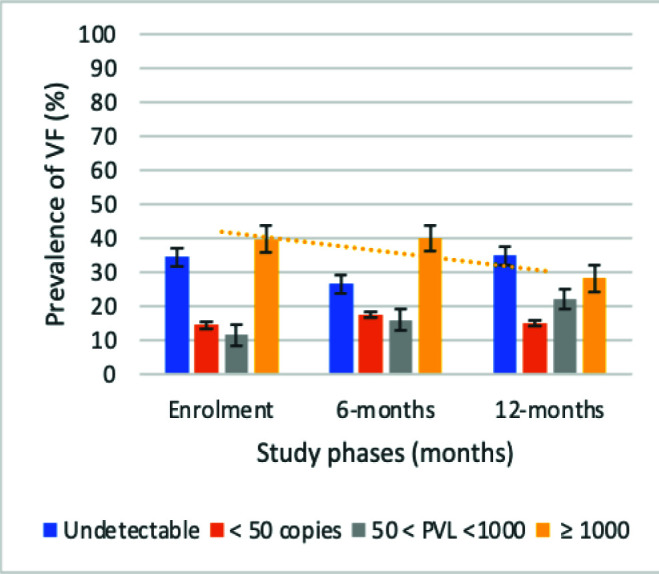
Trends of virological failure. Orange line: declining prevalence of VF overtime.
After multivariate analyses, IF was the lone predictor of VF at enrolment and at 12-months follow-up, while being on first-line ART, IF, and viremia at enrolment >5log, were independent predictors of VF at 6-months; with early clinical stages I/II, and good therapeutic adherence being protective factors (Table IID).
Despite absence of statistical significance, decreasing rates (95% CI) of overall HIVDR of 54/56, 96.4% (87.5-99.6%); 88/96, 91.7% (84.2-96.3%); and 51/60, 85.0% (73.4-92.9%) from T1-T3 respectively were observed among participants in VF, with P=0.099 (Fig. 1C). According to antiretroviral drug classes, HIVDR was highest in primary NNRTIs, 96.4% (87.5-99.6%), 88.5% (80.4-94.1%), and 85.0% (73.4-92.9%) from T1-T3 respectively (Fig. 1D). Assessment of adequate ART exposure and respect of previous GRT-based ART regimen recommendation showed that; 25.0% (16.7-34.9%), and 36.7% (24.6-50.1%) were on adequate ART regimen, with corresponding 34.4% (25.0-44.8%) and 55.0% (41.6-67.9%) being exposed to an ART regimen that respected previous GRT-based ART regimen recommendation at T2 and T3 respectively.
Factors influencing HIVDR.
At enrolment, being on first-line ART was significantly associated to HIVDR (P=0.005). At 6-months follow-up, participants who experienced IF (P=0.037), and high viremia (OR=12.56, P=0.0004) at at enrolmentwere more likely to experience HIVDR. Conversely, good adherence to ART (P=0.031), adequate ART regimen (P#x003C;0.0001), and GRT-guided switch (P#x003C;0.0001), were protective factors against HIVDR. At 12-months follow-up, participants on first line ART had five-times higher odds of experiencing HIVDR (OR=5.29, P=0.021); with those in IF having five-times increased risk of HIVDR (OR=5.86, P=0.021). Meanwhile, being on adequate ART (OR=0.05, P=0.0004), and respect of previous GRT-guided ART switch (OR=0.12, P=0.027), decreased the odds of experiencing HIVDR (Table III).
Figure 1C.
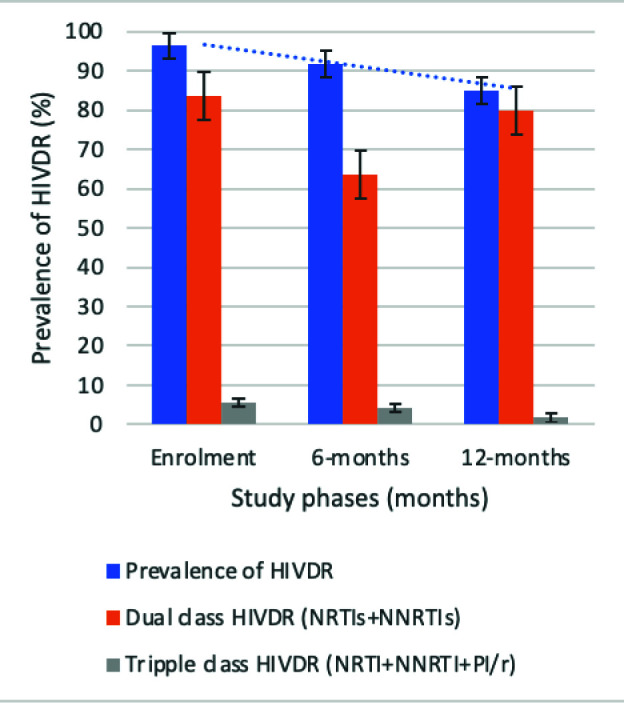
Trends of HIVDR across time points. Blue line: decreasing trend of HIVDR overtime.
Figure 1D.
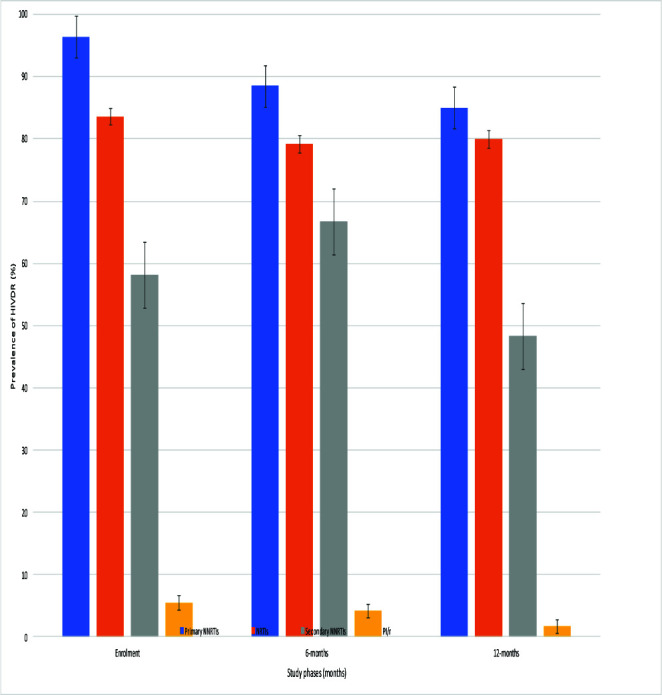
Trends of HIV drug resistance with respect to antiretroviral drug classes.
Following multivariate analyses, being on first-line ART (P=0.045) at enrolment remained an independent predictor of HIVDR. At 6-months, adequate ART (P=0.00002) was protective against HIVDR. At 12-months follow-up, being on first-line ART (P=0.007), and IF (P=0.010) were independent predictors of HIVDR while adequate ART (P=0.002) was a protective factor.
HIV-1 genetic diversity.
We observed a great diversity of HIV-1 genotypes with CRF02_AG predominance from T1-T3 with respective proportions of 69.1% (38/55), 59.4% (57/96), and 58.3% (35/60), followed by the pure subtypes F2 (7.3, 9.4, and 11.7%), A/A1 (9.1, 6.3, and 10.0%), and G (5.5, 6.3, and 6.7%).
Distribution of time to end-point events.
The median (95% CI) survival times from ART initiation to the identification of virological failure (PVL ≥1,000 RNA copies/ml) and immunological failure (#x003C;250 cells/mm3) by Kaplan-Meier plot were 69.00 (56.96-81.04), and 58.00 (52.81-63.18) months respectively; with P=0.017 (Fig. 2A).
Predictive efficacy of TLD.
Considered effective were ARVs with susceptibility scores #x003C;30 according to the Stanford HIVDR database. For participants on 1st line RTI-based regimens, TDF showed 76.6% (95% CI: 67.5-84.3) efficacy; AZT preserved 58.9% (48.9-68.3) efficacy; ABC preserved 41.1% (31.7-51.1) efficacy, and 3TC conserved 14.0% (8.1-22.1) efficacy. All PI/r preserved high levels of efficacy, that is, 98.1% (93.4-99.8) for LPV/r and ATV/r; and finally 96.3% (90.7-98.9) for DRV/r. There was a similar distribution of drug efficacies among those on 2nd line PI/r based regimens, with 61.8% (43.6-77.8) TDF and AZT efficacies, 52.9% (35.1-70.2) and 20.6% (8.7-37.9) ABC and 3TC efficacies respectively. Similar high efficacy was observed with DRV/r 100% (89.7-100.0), as well as LPV/r and ATV/r 88.2% (72.6-96.7)%. Therefore, on account of the efficacy of TDF after first- and second-line exposure (76.6 and 61.8% respectively), the presence of the 3TC-favored M184V mutation that renders TDF hyperactive (hence 3TC is not contraindicated despite its low efficacy scores, 14.0 and 20.6%), and the non-exposure to integrase strand transfer inhibitors (and thus potential full efficacy of Dolutegravir), full TLD efficacy was predicted in 77 and 62% of APHI respectively after RTI-based first- and PI/r based second-line exposure.
Proposal for follow-up of APHIs.
At the end of this evaluation; follow-up in rural sites (OR=2.16, P=0.007), being on 1st line RTI-based ART (OR=1.92, P=0.024), and IF (OR=4.51, P=0.0001) were risk factors of VF (Table IIE). Conversely, good adherence (OR=0.46, P=0.005), and early clinical stages I/II (OR=0.43, P=0.036) were protective against VF. Multivariate analyses confirmed IF [OR (95% CI)=5.41 (2.25-12.91), P=0.0002], and follow-up in rural sites [OR=2.65 (1.24-5.68), P=0.012] were independent risk factors of VF, while being on 1st line RTI-based ART [OR=1.94 (0.99-3.75), P=0.05], and having a median duration on ART ≥50 months [OR=1.83 (0.97-3.45), P=0.06] tended towards significance. Meanwhile, good adherence [OR=0.36 (0.19-0.67), P=0.002] was protective, and early clinical stages [OR=0.44 (0.17-1.14), P=0.091] tended towards significance. Moreover, adequate ART [OR=0.07 (0.01-0.61), P=0.016] was the lone independent protective factor against HIVDR.
Figure 1.

Kaplan-Meier analysis of time to immunological failure (CD4 #x003C;250 cells/mm3) and virological failure (PVL ≥1,000 RNA copies/ml) in the study population.
Figure 2A.
Figure 2B.

Following our results, we propose the following algorithm for optimized management of adolescents in RLS (Fig. 2B).
Discussion
At the end of the 12-months follow-up, this study showed that at enrolment clinical status was acceptable (90% in a less advanced stage of disease), with improving immunological and virological responses [565 (250-851) cells/mm3 and 60 (40-24730) copies/ml] from enrolment to 586[387-811] cells/mm3 and 51[20-2622] copies/ml across 6- and 12-months' time points respectively. Moreover, there was a statistically significant increased rate of switch from RTI-based first-line to PI/r-based second-line ART following genotypic resistance testing (GRT) recommendations.
Table IIA.
Immunological failure and its associated factors at enrolment, 6-months, and 12-months follow-up.
| Immunological failure (IF) | ||||||||||||
|---|---|---|---|---|---|---|---|---|---|---|---|---|
| Enrolment (T1) | 6-months follow-up (T2) | 12-months follow-up (T3) | ||||||||||
| Yes (%) | No (%) | OR | P | Yes (%) | No (%) | OR | P | Yes (%) | No (%) | OR | P | |
| Age ranges | ||||||||||||
| 10-14 | 22 (15.8) | 117 (84.2) | 2.94 | 0.0002 | 16 (15.7) | 86 (84.3) | 0.71 | 0.295 | 8 (8.2) | 89 (91.8) | 1.37 | 0.494 |
| 15-19 | 47 (35.6) | 85 (64.4) | 34 (20.9) | 129 (79.1) | 15 (11.0) | 122 (89.0) | ||||||
| Site group | ||||||||||||
| Rural | 17 (27.9) | 44 (72.1) | 0.85 | 0.624 | 18 (26.9) | 49 (73.1) | 1.91 | 0.053 | 2 (4.0) | 48 (96.0) | 3.09 | 0.118 |
| Urban | 52 (24.8) | 158 (75.2) | 32 (16.2) | 166 (83.8) | 21 (11.4) | 163 (88.6) | ||||||
| Gender | ||||||||||||
| Female | 38 (25.2) | 113 (74.8) | 1.03 | 0.929 | 31 (21.2) | 115 (78.8) | 1.42 | 0.276 | 13 (9.9) | 118 (90.1) | 0.99 | 0.995 |
| Male | 30 (25.6) | 87 (74.4) | 19 (16.0) | 100 (84.0) | 10 (9.9) | 91 (90.1) | ||||||
| Clin. stage class | ||||||||||||
| I/II | 58 (23.0) | 194 (77.0) | 5.02 | 0.0013 | 39 (16.4) | 199 (83.6) | 0.29 | 0.002 | 7 (3.6) | 187 (96.4) | - | 0.388 |
| III/IV | 9 (60.0) | 6 (40.0) | 11 (40.7) | 16 (59.3) | 0 (0.0) | 20(100) | ||||||
| ART line | ||||||||||||
| 1st | 60 (27.4) | 159 (72.6) | 0.56 | 0.157 | 27 (15.4) | 148 (84.6) | 0.49 | 0.026 | 4 (3.2) | 120 (96.8) | 1.02 | 0.977 |
| 2nd | 8 (17.4) | 38 (82.6) | 22 (27.2) | 59 (72.8) | 3 (3.3) | 88 (96.7) | ||||||
| Adherence | ||||||||||||
| Good | 49 (28.2) | 125 (71.8) | 0.71 | 0.273 | 26 (16.7) | 130 (83.3) | 0.74 | 0.341 | 12 (7.9) | 139 (92.1) | 1.75 | 0.21 |
| Poor | 19 (21.8) | 68 (78.2) | 23 (21.3) | 85 (78.7) | 10 (13.2) | 66 (86.8) | ||||||
| VF | ||||||||||||
| Yes | 52 (49.1) | 54 (50.9) | 8.73 | 0.0001 | 31 (30.1) | 72 (69.9) | 3.96 | 0.0001 | 14 (21.5) | 51 (78.5) | 4.88 | 0.0002 |
| No | 16 (9.9) | 145 (90.1) | 15 (9.8) | 138 (90.2) | 9 (5.3) | 160 (94.7) | ||||||
| IF at enrolment | ||||||||||||
| Yes | 29 (50.0) | 29 (50.0) | 10.9 | 0.0001 | 12 (23.5) | 39 (76.5) | 0.21 | 0.0003 | ||||
| No | 15 (8.4) | 164 (91.6) | 10 (5.9) | 158 (94.1) | ||||||||
| High viremia at | ||||||||||||
| enrolment >5 log | ||||||||||||
| Yes | 17 (44.7) | 21 (55.3) | 4.71 | 0.0001 | 4 (12.9) | 27 (87.1) | 0.72 | 0.569 | ||||
| No | 32 (14.7) | 186 (85.3) | 19 (9.6) | 179 (90.4) | ||||||||
Table IIB.
Independent risk/protective factors of immunological failure at enrolment (T1), 6-months, and 12-months follow-up.
| Immunological failure (IF) | |||||||||
|---|---|---|---|---|---|---|---|---|---|
| Enrolment (T1) | 6-months follow-up (T2) | 12-months follow-up (T3) | |||||||
| OR | 95% CI | P | OR | 95% CI | P | OR | 95% CI | P | |
| Age ranges (10-14/15-19) | 2.94 | 1.65-5.24 | 0.003 | 0.291 | 0.778 | ||||
| Gender (female/male) | 0.659 | 1.42 | 0.75-2.67 | 0.091 | 0.614 | ||||
| Clinical stage class (I,II/III,IV) | 5.02 | 1.71-14.68 | 0.012 | 0.415 | |||||
| ART line (1st/2nd) | 0.56 | 0.25-1.26 | 0.079 | 0.525 | |||||
| Adherence (good/poor) | 0.248 | 0.7 | 0.395 | ||||||
| VF (yes/no) | 8.73 | 4.59-16.58 | 0.0001 | 3.96 | 2.01-7.81 | 0.008 | 4.88 | 1.99-11.94 | 0.0001 |
| Site group (rural/urban) | 1.91 | 0.98-3.68 | 0.017 | 0.178 | |||||
| IF at enrolment (yes/no) | 10.93 | 5.23-22.87 | 0.0001 | 0.21 | 0.08-0.51 | 0.0002 | |||
| High viremia at enrolment >5 log (yes/no) | 0.73 | ||||||||
Table IIC.
Virological failure and its associated factors at enrolment, 6-months, and 12-months follow-up.
| Virological failure (VF) | ||||||||||||
|---|---|---|---|---|---|---|---|---|---|---|---|---|
| Enrolment (T1) | 6-months follow-up | 12-months follow-up | ||||||||||
| Yes (%) | No (%) | OR | P | Yes (%) | No (%) | OR | P | Yes (%) | No (%) | OR | P | |
| Age ranges | ||||||||||||
| 10-14 | 57 (34.6) | 108 (65.4) | 1.6 | 0.047 | 43 (40.9) | 62 (59.1) | 1.07 | 0.781 | 27 (26.7) | 74 (73.3) | 1.15 | 0.639 |
| 15-19 | 64 (45.7) | 76 (54.3) | 62 (39.2) | 96 (60.8) | 41 (29.5) | 98 (70.5) | ||||||
| Site group | ||||||||||||
| Rural | 36 (38.3) | 58 (61.7) | 1.09 | 0.743 | 39 (52.7) | 35 (47.3) | 2.08 | 0.008 | 20 (35.1) | 37 (64.9) | 0.65 | 0.187 |
| Urban | 85 (40.3) | 126 (59.7) | 66 (34.9) | 123 (65.1) | 48 (26.1) | 136 (73.9) | ||||||
| Gender | ||||||||||||
| Female | 69 (42.1) | 95 (57.9) | 0.81 | 0.365 | 60 (41.7) | 84 (58.3) | 1.17 | 0.525 | 40 (29.9) | 94 (70.1) | 0.81 | 0.479 |
| Male | 51 (37.0) | 87 (63.0) | 45 (37.8) | 74 (62.2) | 27 (25.7) | 78 (74.3) | ||||||
| Clin. stage class | ||||||||||||
| I/II | 109 (38.7) | 173 (61.3) | 3.49 | 0.0169 | 86 (36.3) | 151 (63.7) | 0.21 | 0.0003 | 50 (25.2) | 148 (74.8) | 1.59 | 0.344 |
| III/IV | 11 (68.7) | 5 (31.3) | 19 (73.1) | 7 (26.9) | 7 (35.0) | 13 (65.0) | ||||||
| ART line | ||||||||||||
| 1st | 105 (42.0) | 145 (58.0) | 0.61 | 0.137 | 79 (44.9) | 97 (55.1) | 1.83 | 0.0345 | 40 (31.2) | 88 (68.8) | 0.6 | 0.108 |
| 2nd | 15 (30.6) | 34 (69.4) | 24 (30.8) | 54 (69.2) | 20 (21.5) | 73 (78.5) | ||||||
| Adherence | ||||||||||||
| Good | 77 (39.5) | 118 (60.5) | 1 | 0.987 | 52 (34.0) | 101 (66.0) | 0.56 | 0.025 | 36 (23.5) | 117 (76.5) | 2.19 | 0.008 |
| Poor | 38 (39.6) | 58 (60.4) | 52 (47.7) | 57 (52.3) | 31 (40.3) | 46 (59.7) | ||||||
| IF | ||||||||||||
| Yes | 52 (76.5) | 16 (23.5) | 8.73 | 0.0001 | 31 (67.4) | 15 (32.6) | 3.96 | 0.0001 | 14 (60.9) | 9 (39.1) | 4.88 | 0.0002 |
| No | 54 (27.1) | 145 (72.9) | 72 (34.3) | 138 (65.7) | 51 (24.2) | 160 (75.8) | ||||||
| IF at enrolment | ||||||||||||
| Yes | 28 (50.0) | 28 (50.0) | 2.02 | 0.023 | 11 (21.6) | 40 (78.4) | 1.53 | 0.262 | ||||
| No | 57 (33.1) | 115 (66.9) | 50 (29.6) | 119 (70.4) | ||||||||
| High viremia at | ||||||||||||
| enrolment >5 log | ||||||||||||
| Yes | 27 (71.1) | 11 (28.9) | 5.01 | 0.0001 | 12 (38.7) | 19 (61.3) | 0.58 | 0.177 | ||||
| No | 71 (32.9) | 145 (67.1) | 55 (27.0) | 149 (73.0) | ||||||||
Table IID.
Virological failure and its independently associated factors at enrolment, 6-months, and 12-months follow-up.
| Virological failure (VF) | |||||||||
|---|---|---|---|---|---|---|---|---|---|
| Enrolment (T1) | 6-months follow-up | 12-months follow-up | |||||||
| OR | 95% CI | P | OR | 95% CI | P | OR | 95% CI | P | |
| Age ranges (10-14/15-19) | 0.351 | 0.849 | 0.237 | ||||||
| Gender (female/male) | 0.226 | 0.942 | 0.427 | ||||||
| Clinical stage class (I,II/III,IV) | 0.274 | 0.21 | 0.08-0.52 | 0.008 | |||||
| ART line (1st/2nd) | 0.502 | 1.83 | 1.04-3.22 | 0.001 | 0.167 | ||||
| IF (yes/no) | 8.73 | 4.59-16.58 | 0.0001 | 3.96 | 2.01-7.81 | 0.007 | 4.88 | 1.99-11.94 | 0.001 |
| Adherence (good/poor) | 0.569 | 0.56 | 0.34-0.93 | 0.006 | 0.296 | ||||
| Site group (rural/urban) | 0.209 | 0.65 | 0.35-1.23 | 0.068 | |||||
| IF at enrolment (yes/no) | 0.192 | 0.226 | |||||||
| High viremia at enrolment >5 log (yes/no) | 5.01 | 2.35-10.68 | 0.0001 | 0.165 | |||||
Table IIE:
Factors affecting virological response at 12-months post-enrolment.
| Overall Virological failure (T3) | ||||||||
|---|---|---|---|---|---|---|---|---|
| Yes | No | Total | ||||||
| Count | Row n % | Count | Row n % | Count | Row n % | OR (95% Confidence interval) | P-value | |
| Site Group | ||||||||
| Rural | 35 | 44.90 | 43 | 55.10 | 78 | 100.00 | 2.16 (1.25-3.72) | 0.007 |
| Urban | 55 | 27.40 | 146 | 72.60 | 201 | 100.00 | ||
| Gender | ||||||||
| Female | 56 | 36.10 | 99 | 63.90 | 155 | 100.00 | 1.51 (0.91-2.53) | 0.124 |
| Male | 34 | 27.20 | 91 | 72.80 | 125 | 100.00 | ||
| Age ranges | ||||||||
| 10-14 | 37 | 31.40 | 81 | 68.60 | 118 | 100.00 | 0.94 (0.56-1.56) | 0.897 |
| 15-19 | 53 | 32.70 | 109 | 67.30 | 162 | 100.00 | ||
| ART line | ||||||||
| 1st | 64 | 37.20 | 108 | 62.80 | 172 | 100.00 | 1.92 (1.11-3.31) | 0.024 |
| 2nd | 25 | 23.60 | 81 | 76.40 | 106 | 100.00 | ||
| Adherence | ||||||||
| Good | 47 | 26.10 | 133 | 73.90 | 180 | 100.00 | 0.46 (0.27-0.77) | 0.005 |
| Poor | 43 | 43.40 | 56 | 56.60 | 99 | 100.00 | ||
| Clin. Stage class | ||||||||
| I/II | 74 | 30.10 | 172 | 69.90 | 246 | 100.00 | 0.43 (0.19-0.95) | 0.036 |
| III/IV | 14 | 50.00 | 14 | 50.00 | 28 | 100.00 | ||
| IF | ||||||||
| Yes | 20 | 60.60 | 13 | 39.40 | 33 | 100.00 | 4.51 (2.11-9.63) | 0.0001 |
| No | 58 | 25.40 | 170 | 74.60 | 228 | 100.00 | ||
| Median duration on | ||||||||
| ART (>=50) | ||||||||
| Yes | 46 | 32.60 | 95 | 67.40 | 141 | 100.00 | 1.03 (0.62-1.71) | 0.921 |
| No | 42 | 32.10 | 89 | 67.90 | 131 | 100.00 | ||
Table III.
HIVDR and its associated variables at enrolment, 6-months, and 12-months follow-up.
| HIV drug resistance (HIVDR) | ||||||||||||
|---|---|---|---|---|---|---|---|---|---|---|---|---|
| Enrolment (T1) | 6-months follow-up | 12-months follow-up | ||||||||||
| Yes (%) | No (%) | OR | P | Yes (%) | No (%) | OR | P | Yes (%) | No (%) | OR | P | |
| Age ranges | ||||||||||||
| 10-14 | 23(100) | 0 (0.0) | ND | 0.377 | 36 (92.3) | 3 (7.7) | 1.15 | 0.851 | 20 (87.0) | 3 (13.0) | 1.29 | 0.737 |
| 15-19 | 29 (96.7) | 1 (3.3) | 52 (91.2) | 5 (8.8) | 31 (83.8) | 6 (16.2) | ||||||
| Gender | ||||||||||||
| Female | 28(100) | 0 (0.0) | ND | 0.275 | 52 (92.9) | 4 (7.1) | 1.44 | 0.6175 | 31 (81.6) | 7 (18.4) | 0.47 | 0.363 |
| Male | 23 (95.8) | 1 (4.2) | 36 (90.0) | 4 (10.0) | 19 (90.5) | 2 (9.5) | ||||||
| Clinical stage class | ||||||||||||
| I/II | 44 (97.8) | 1 (2.2) | 0 | 0.712 | 70 (90.9) | 7 (9.1) | 0.56 | 0.589 | 44 (89.8) | 5 (10.2) | 4.4 | 0.223 |
| III/IV | 6(100) | 0 (0.0) | 18 (94.7) | 1 (5.3) | 2 (66.7) | 1 (33.3) | ||||||
| ART line | ||||||||||||
| 1st | 47(100) | 0 (0.0) | ND | 0.005 | 70 (94.6) | 4 (5.4) | 3.89 | 0.056 | 37 (92.5) | 3 (7.5) | 5.29 | 0.021 |
| 2nd | 5 (83.3) | 1 (16.7) | 18 (81.8) | 4 (18.2) | 14 (70.0) | 6 (30.0) | ||||||
| Adherence | ||||||||||||
| Good | 31 (96.9) | 1 (3.1) | 0 | 0.449 | 42 (85.7) | 7 (14.3) | 0.13 | 0.031 | 27 (90.0) | 3 (10.0) | 2.45 | 0.229 |
| Poor | 18(100) | 0 (0.0) | 46 (97.9) | 1 (2.1) | 22 (78.6) | 6 (21.4) | ||||||
| IF | ||||||||||||
| Yes | 27(100) | 0 (0.0) | 0 | 0.215 | 30 (96.7) | 1 (3.2) | 3.68 | 0.204 | 7 (63.6) | 4 (36.4) | 5.86 | 0.019 |
| No | 17 (94.4) | 1 (5.6) | 57 (89.1) | 7 (10.9) | 41 (91.1) | 4 (8.9) | ||||||
| IF at enrolment | ||||||||||||
| Yes | 27(100) | 0 (0.00) | ND | 0.037 | 7 (77.8) | 2 (22.2) | 0.46 | 0.397 | ||||
| No | 47 (85.4) | 8 (14.6) | 38 (88.4) | 5 (11.6) | ||||||||
| High viremia at | ||||||||||||
| enrolment | ||||||||||||
| Yes | 67 (97.1) | 2 (2.9) | 12.56 | 0.0004 | 31 (86.1) | 5 (13.9) | 1.38 | 0.661 | ||||
| No | 16 (72.7) | 6 (27.3) | 18 (81.8) | 4 (18.2) | ||||||||
| At enrolment VL >5 log | ||||||||||||
| Yes | 85 (92.4) | 7 (7.6) | 4.05 | 0.218 | 49 (87.5) | 7 (12.5) | 7 | 0.131 | ||||
| No | 3 (75.0) | 1 (25.0) | 1 (50.0) | 1 (50.0) | ||||||||
| Adequate therapy | ||||||||||||
| Yes | 16 (66.7) | 8 (33.3) | 0 | 0.0001 | 14 (63.6) | 8 (36.4) | 0.05 | 0.0004 | ||||
| No | 72(100) | 0 (0.0) | 37 (97.4) | 1 (2.63) | ||||||||
| Previous GRT respected | ||||||||||||
| Yes | 25 (75.8) | 8 (24.2) | 0 | 0.0001 | 25 (75.8) | 8 (24.2) | 0.12 | 0.027 | ||||
| No | 63(100) | 0 (0.00) | 26 (96.3) | 1 (3.7) | ||||||||
*ND, not defined.
From T1-T3, early adolescence, early clinical stages, virological failure, follow-up in rural study sites, and experiencing IF during the enrolment phase of the study were all independent predictors of IF. This could be favored by adherence issues, non-disclosure of HIV status or absence of rigorous follow-up of the young adolescent by parents/counselors, which may be worsened by the long distances traveled to access ART services, limited knowledge on HIVDR, and limited resources in rural settings. In addition, despite the discordance with our current findings, poorer virological control correlates with lower CD4 counts and hence resulting in IF thus favoring the emergence of opportunistic infections, the severity of which classifies patients into more advanced clinical stages (7,13-16). This discordance could be due to the characteristic poor adherence among adolescents which could explain the adverse association between early clinical stages with IF.
The high VF rate observed in our study was comparable with those observed in other studies on this population (7,15,17-20). From enrolment to 12-months follow-up, Immunological failure and being on RTI-based first line ART were risk factors for VF, whereas early clinical stages I and II, and good adherence to ART were protective factors. These results are similar to those obtained in previous studies (7,18,21-23). The main targets of HIV are CD4+ helper T cells, which are key regulators of the humoral and cellular immune responses. Thus, their destruction or depletion by HIV-1 mechanisms that are not exhaustively understood render the body unable to defend itself against opportunistic pathogens (13), this combined with ARVs that have a low genetic barrier to HIVDR favor VF. In this regard, the advent of Dolutegravir (DTG) based regimens which have demonstrated high effectiveness even when combined with NRTIs to which DRMs have been selected has been regarded as salutary, with significant decreases in treatment failure (24,25). However, despite the high genetic barrier of DTG to resistance, care must be taken and adherence reinforced with heavily treated patients who have had previous/current acquired drug resistance (ADR) to the NRTI backbone in a bid to secure long-term treatment success (24).
Majority of our study participants were on first line RTI-based ART, with good adherence and median duration on ART of 36[21-81] months. There was a high prevalence of HIVDR (>90%) among participants failing ART mainly driven by resistance to NNRTIs. Similar results were observed in other studies in Sub-Saharan Africa (SSA) (7,18,21-23,26,27). Of note, sequencing was performed in participants experiencing VF, which has HIVDR as one of its main causal factors. Independent risk factors favoring HIVDR were being on first line RTI-based ART and experiencing IF. On the other hand, good adherence to ART, and adequate ART (exposure to a functional tri-therapy) were protective factors. The high resistance to RTI-based regimens could be because fixed dose combination of NRTIs (such as d4T, 3TC) and NNRTIs (such as NVP) were widely used during early ARV rollout in the Cameroonian HIV programme and these guidelines were only renewed as recently as January 2021, with the use of the highly effective integrase strand transfer inhibitor DTG in both first- and third-line ART regimens, in combination with an NRTI-backbone. Prolonged exposure to these ARVs with low genetic barriers to resistance in our study participants favored the accumulation of drug resistance mutations (DRMs), especially to NRTIs that play a key role in HIV tri-therapy in the current treatment guidelines (28,29). Ritonavir-boosted PIs (PI/r), and Dolutegravir-based regimens on the other hand, in surplus to their high genetic barriers to resistance, also have a high degree of tolerance to poor observance, low cost, easy dosage, and potency. Despite the minimal impact on therapy effectiveness of DTG acquired resistance mutations in combination with accumulated resistance mutations to the NRTI backbone, there is only limited knowledge regarding the clinical implications of this in an intention-to-treat approach (24).
Moreover, in the absence of resistance testing at ART initiation, patients infected with resistant HIV strains (transmitted resistance) are likely to receive a suboptimal ART regimen and will most likely accumulate more DRMs. Our results, therefore, underscore the importance of viral load measurement as the primary marker of treatment efficacy and suggest the importance of switching ART regimens when there is evidence of virologic failure, following genotypic resistance testing, to prevent the accumulation of HIV acquired drug resistance. Our results show a statistically significant decrease in median time required to achieve favorable immune-virological responses, thus indicating that close individualized monitoring, and careful selection of proper HAART regimens can improve both effectiveness and sustainability of ART. This is especially crucial in a public health scale-up of ART-context, wherein large numbers of patients are on the same regimens with fewer monitoring resources for follow-up of individuals and for community-wide assessments. In terms of HIV-1 genetic variability, a variety of pure subtypes and genetic variants or recombinants were observed in this study upon sequencing of the HIV-1 polymerase and reverse transcriptase gene regions. Among these, the most prevalent viral clade consecutively was CRF02_AG. This rich genetic diversity and CRF02_AG predominance agree with multiple other studies carried out in Cameroon (21,30-32). Worthy of note, HIV-1 subtypes display clade-specific substitutions in positions relevant to drug resistance that could result in the accelerated emergence of drug-resistant viruses, alter or induce alternative pathways of resistance, influence viral replicative capacity in vitro, impair the interpretation of genotypic resistance algorithms, and alter drug binding affinity (33). It is therefore imperative to carryout molecular epidemiological surveillance especially in hotspots like Cameroon. One of the major limitations of this study was that due to its longitudinal design, loss to follow-up of participants by the end of the study made it difficult to enroll the entire sample population, which may have had an impact on the statistical significance of the study results and the overall impact of the study findings on the target population. Furthermore, limiting sequencing only to those samples that had PVL ≥1,000 RNA copies/ml led to an underestimation of drug resistance mutations as it is possible that samples with lower viral load also carry DRMs.
Conclusions
In the population of APHI within this SSA setting, there is a significant decline in immuno-virological failure following personalized monitoring. Of note, virological failure and HIVDR were independently associated with immunological failure and being on first line RTI-based ART, while optimized ART was a protective factor. Moreover, immunological failure was associated with early age adolescence, early clinical stages, virological failure, follow-up in rural study sites, and experiencing immunological failure at enrolment. Henceforth, promoting personalized ART management and optimized GRT-informed Dolutegravir ART will improve therapeutic outcome.
Acknowledgments
The study team would like to thank the participants and managers of the various hospitals for facilitating the implementation of the study on site.
Funding Statement
Funding: The study was financially supported by EDCTP, the European and Developing Countries Clinical Trials Partnership, under the Career Development Fellowship-TMA 1027.
References
- 1.UNAIDS. Global HIV and AIDS statistics-2020 Fact Sheet. 2020. [cited 2021 Apr 1]. Available from: https://www.unaids.org/en/resources/fact-sheet. [Google Scholar]
- 2.Fokam J, Billong SC, Bissek AC, Kembou E, Milenge P, Abessouguie I, Nkwescheu AS, Tsomo Z, Aghokeng AF, Ngute GD, et al. : Declining trends in early warning indicators for HIV drug resistance in Cameroon from 2008-2010: Lessons and challenges for low-resource settings. BMC Public Health 13: 308, 2013. [DOI] [PMC free article] [PubMed] [Google Scholar]
- 3.Kumbale CM, Voit EO: Toward personalized medicine for HIV/AIDS. J AIDS HIV Treat 3: 37-41, 2021. [DOI] [PMC free article] [PubMed] [Google Scholar]
- 4.Huang C, Sam V, Du S, Le T, Fletcher A, Lau W, Meyer K, Asaki E, Huang DW, Johnson C: Towards personalized medicine: An improved de novo assembly procedure for early detection of drug resistant HIV minor quasi-species in patient samples. Bioinformation 14: 449-454, 2018. [DOI] [PMC free article] [PubMed] [Google Scholar]
- 5.Institut National de la Statistique (INS) et ICF. Enquête Démographique et de Sante du Cameroun, 2018. Indicateurs clés. Yaoundé, Cameroun et Rockville, Maryland, USA, INS et ICF, 2018. [Google Scholar]
- 6.Slogrove AL, Sohn AH: The global epidemiology of adolescents living with HIV: Time for more granular data to improve adolescent health outcomes. Curr Opin HIV AIDS 13: 170-178, 2018. [DOI] [PMC free article] [PubMed] [Google Scholar]
- 7.Fokam J, Takou D, Njume D, Pabo W, Santoro MM, Njom Nlend AE, Beloumou G, Sosso S, Moudourou S, Teto G, et al. : Alarming rates of virological failure and HIV‐1 drug resistance amongst adolescents living with perinatal HIV in both urban and rural settings: Evidence from the EDCTP READY-study in Cameroon. HIV Med 22: 567-580, 2021. [DOI] [PubMed] [Google Scholar]
- 8.Billong SC, Fokam J, Penda CI, Amadou S, Kob DS, Billong EJ, Colizzi V, Ndjolo A, Bisseck AZ, Elat JN: Predictors of poor retention on antiretroviral therapy as a major HIV drug resistance early warning indicator in Cameroon: Results from a nationwide systematic random sampling. BMC Infect Dis 16: 678, 2016. [DOI] [PMC free article] [PubMed] [Google Scholar]
- 9.Ministry of Public health. National guideline on the prevention and management of HIV in Cameroon. [Internet]. 2015. [cited 2023 Mar 12]. Available from: https://www.childrenandaids.org/sites/default/files/2018-05/Cameroon_Nat%20Guidelines%20HIV_2015.pdf](https://www.childrenandaids.org/sites/default/files/2018-05/Cameroon_Nat%20Guidelines%20HIV_2015.pdf). [Google Scholar]
- 10.Fokam J, Salpini R, Santoro MM, Cento V, D'Arrigo R, Gori C, Perno CF, Colizzi V, Nanfack A, Gwom LC, et al. : Performance evaluation of an in-house human immunodeficiency virus type-1 protease-reverse transcriptase genotyping assay in Cameroon. Arch Virol 156: 1235-1243, 2011. [DOI] [PubMed] [Google Scholar]
- 11.World Health Organization. HIV treatment and care. What's new in treatment monitoring: Viral load and CD4 testing. [Internet]. [cited 2023 Apr 6]. Available from: https://apps.who.int/iris/bitstream/handle/10665/255891/WHO-HIV-2017.22-eng.pdf. [Google Scholar]
- 12.Updated recommendations on HIV prevention infant diagnosis antiretroviral initiation and monitoring. Geneva, World Health Organization, 2021. [PubMed] [Google Scholar]
- 13.Kirchhoff F: HIV life cycle: Overview. In: Hope TJ, Stevenson M, Richman D, (eds.). Encyclopedia of AIDS. New York, NY, Springer New York, 2013. [cited 2021 Aug 31]. pp1-9. [Google Scholar]
- 14.Mamo A, Assefa T, Negash W, Takelign Y, Sahiledinigl B, Teferu Z, Mohammed M, Solomon D, Gezahegn H, Bekele K, et al. : Virological and immunological antiretroviral treatment failure and predictors among HIV positive adult and adolescent clients in southeast Ethiopia. HIV AIDS (Auckl) 14: 73-85, 2022. [DOI] [PMC free article] [PubMed] [Google Scholar]
- 15.Bailey H, Cruz MLS, Songtaweesin WN, Puthanakit T: Adolescents with HIV and transition to adult care in the Caribbean, Central America and South America, Eastern Europe and Asia and Pacific regions. J Int AIDS Soc 20: 21475, 2017. [DOI] [PMC free article] [PubMed] [Google Scholar]
- 16.Agwu AL, Fairlie L: Antiretroviral treatment, management challenges and outcomes in perinatally HIV-infected adolescents. J Int AIDS Soc 16: 18579, 2013. [DOI] [PMC free article] [PubMed] [Google Scholar]
- 17.Sithole Z, Mbizvo E, Chonzi P, Mungati M, Juru TP, Shambira G, Gombe NT, Tshimanga M: Virological failure among adolescents on ART, Harare City, 2017-a case-control study. BMC Infect Dis 18: 469, 2018. [DOI] [PMC free article] [PubMed] [Google Scholar]
- 18.Muri L, Gamell A, Ntamatungiro AJ, Glass TR, Luwanda LB, Battegay M, Furrer H, Hatz C, Tanner M, Felger I, et al. : Development of HIV drug resistance and therapeutic failure in children and adolescents in rural Tanzania: An emerging public health concern. AIDS 31: 61-70, 2017. [DOI] [PMC free article] [PubMed] [Google Scholar]
- 19.Judd A, Davies MA: Adolescent transition among young people with perinatal HIV in high-income and low-income settings. Curr Opin HIV AIDS 13: 236-248, 2018. [DOI] [PMC free article] [PubMed] [Google Scholar]
- 20.Marcus R, Ferrand RA, Kranzer K, Bekker LG: The case for viral load testing in adolescents in resource-limited settings. J Int AIDS Soc 20: e25002, 2017. [DOI] [PMC free article] [PubMed] [Google Scholar]
- 21.Meriki HD, Tufon KA, Anong DN, Atanga PN, Anyangwe IA, Cho-Ngwa F, Nkuo-Akenji T: Genetic diversity and antiretroviral resistance-associated mutation profile of treated and naive HIV-1 infected patients from the Northwest and Southwest regions of Cameroon. PLoS One 14: e0225575, 2019. [DOI] [PMC free article] [PubMed] [Google Scholar]
- 22.Deletsu SD, Maina EK, Quaye O, Ampofo WK, Awandare GA, Bonney EY: High resistance to reverse transcriptase inhibitors among persons infected with human immunodeficiency virus type 1 subtype circulating recombinant form 02_AG in Ghana and on antiretroviral therapy. Medicine (Baltimore) 99: e18777, 2020. [DOI] [PMC free article] [PubMed] [Google Scholar]
- 23.Kityo C, Thompson J, Nankya I, Hoppe A, Ndashimye E, Warambwa C, Mambule I, van Oosterhout JJ, Wools-Kaloustian K, Bertagnolio S, et al. : HIV drug resistance mutations in Non-B subtypes after prolonged virological failure on NNRTI-based first-line regimens in Sub-Saharan Africa. J Acquir Immune Defic Syndr 75: e45-e54, 2017. [DOI] [PMC free article] [PubMed] [Google Scholar]
- 24.Paton NI, Musaazi J, Kityo C, Walimbwa S, Hoppe A, Balyegisawa A, Asienzo J, Kaimal A, Mirembe G, Lugemwa A, et al. : Efficacy and safety of dolutegravir or darunavir in combination with lamivudine plus either zidovudine or tenofovir for second-line treatment of HIV infection (NADIA): Week 96 results from a prospective, multicentre, open-label, factorial, randomised, non-inferiority trial. Lancet HIV 9: e381-e93, 2022. [DOI] [PubMed] [Google Scholar]
- 25.Turkova A, White E, Mujuru HA, Kekitiinwa AR, Kityo CM, Violari A, Lugemwa A, Cressey TR, Musoke P, Variava E, et al. : Dolutegravir as First- or second-line treatment for HIV-1 infection in Children. N Engl J Med 385: 2531-2543, 2021. [DOI] [PMC free article] [PubMed] [Google Scholar]
- 26.Melikian GL, Rhee SY, Varghese V, Porter D, White K, Taylor J, Towner W, Troia P, Burack J, Dejesus E, et al. : Non-nucleoside reverse transcriptase inhibitor (NNRTI) cross-resistance: Implications for preclinical evaluation of novel NNRTIs and clinical genotypic resistance testing. J Antimicrob Chemother 69: 12-20, 2014. [DOI] [PMC free article] [PubMed] [Google Scholar]
- 27.Boerma RS, Boender TS, Sigaloff KC, Rinke de Wit TF, van Hensbroek MB, Ndembi N, Adeyemo T, Temiye EO, Osibogun A, Ondoa P, et al. : High levels of pre-treatment HIV drug resistance and treatment failure in Nigerian children. J Int AIDS Soc 19: 21140, 2016. [DOI] [PMC free article] [PubMed] [Google Scholar]
- 28.Boullé C, Guichet E, Kouanfack C, Aghokeng A, Onambany B, Ikaka CM, Ngock E, Tsoumsta L, Msellati P, Mpoudi-Ngolé E, et al. : Virologic failure and human immunodeficiency virus drug resistance in rural cameroon with regard to the UNAIDS 90-90-90 treatment targets. Open Forum Infect Dis 3: ofw233, 2016. [DOI] [PMC free article] [PubMed] [Google Scholar]
- 29.Billong SC, Fokam J, Penda CI, Mvilongo EA, Fodjo R, Messeh A, Anoubissie JD, Kegne C, Nguekam G, Batamack YA, et al. : National profile of early warning indicators of HIV Pharmaco-resistance in Cameroon. Pan Afr Med J 37: 374, 2020. (In French). [DOI] [PMC free article] [PubMed] [Google Scholar]
- 30.Abongwa LE, Nyamache AK, Torimiro JN, Okemo P, Charles F: Human immunodeficiency virus type 1 ((HIV-1) subtypes in the northwest region, Cameroon. Virol J 16: 103, 2019. [DOI] [PMC free article] [PubMed] [Google Scholar]
- 31.Courtney CR, Agyingi L, Fokou A, Christie S, Asaah B, Meli J, Ngai J, Hewlett I, Nyambi PN: Monitoring HIV-1 Group M Subtypes in Yaoundé, Cameroon reveals broad genetic diversity and a novel CRF02_AG/F2 infection. AIDS Res Hum Retroviruses 32: 381-385, 2016. [DOI] [PMC free article] [PubMed] [Google Scholar]
- 32.Banin AN, Tuen M, Bimela JS, Tongo M, Zappile P, Khodadadi-Jamayran A, Nanfack AJ, Okonko IO, Meli J, Wang X, et al. : Near full genome characterization of HIV-1 unique recombinant forms in Cameroon reveals dominant CRF02_AG and F2 recombination patterns. J Int AIDS Soc 22: e25362, 2019. [DOI] [PMC free article] [PubMed] [Google Scholar]
- 33.Santoro MM, Perno CF: HIV-1 genetic variability and clinical implications. ISRN Microbiol 2013: 481314, 2013. [DOI] [PMC free article] [PubMed] [Google Scholar]