

Abstract
A ppbv-level mid-infrared photoacoustic spectroscopy sensor was developed for mouth alcohol tests. A compact CO2 laser with a sealed waveguide and integrated radio frequency (RF) power supply was used. The emission wavelength is ∼9.3 µm with a power of 10 W. A detection limit of ∼18 ppbv (1σ) for ethanol gas with an integration of 1 s was achieved. The sensor performed a linear dynamic range with an R square value of ∼0.999. A breath measurement experiment after consuming lychees was conducted. The photoacoustic signal amplitude decreased with the quality of lychee consumed, confirming the existence of residual alcohol in the mouth. During continuous measurement, the photoacoustic signal decreased in < 10 min when consuming 30 g lychee fruits, proving that the alcohol detected in exhaled breath originated from the oral cavity rather than the bloodstream. This work provided valuable information on the distinction of alcoholism and crime.
Keywords: Photoacoustic spectroscopy, Gas sensor, Lychee fruits, Mouth alcohol test
1. Introduction
Conventional techniques for gas detection include gas chromatography (GC), mass spectrometry (MS), and semiconductor gas sensors [1], [2], [3], [4], [5], [6], [7]. The GC and MS techniques are regarded to be gold standards for gas sensing. For semiconductor gas sensors, metal oxide materials are mainly used as sensitive materials due to their low cost and controllable structure. But this type of gas sensor usually works at high temperatures (above 300 ℃) and lacks selectivity, which undoubtedly increases the difficulty of the operation and makes the sensor consuming [8], [9], [10]. The spectroscopic methods are widely used for gas trace detection as a result of their proven valuable advantages: high selectivity, fast response, high sensitivity, and large dynamic range [5], [6], [11], [12], [13], [14], [15], [16], [17]. Generally, the spectroscopic methods employ a laser as the excitation light source, which has benefited from the fast development of the semiconductor laser industry.
Photoacoustic spectroscopy (PAS) has attracted increasing research interest in recent years [13]. The advantage of PAS is that the sensitivity is proportional to the laser power [18], [19], [20], [21]. The fundamental principle of PAS is to detect the acoustic wave generated by the interaction of a modulated laser with target molecules [22], [23], [24], [25], [26]. The absorption of optical energy by gas molecules results in a transition of energy levels. The molecules are excited. Then the molecules relax to the ground state through the non-radiative process, due to the vibrational-to-translational (V-T) relaxation. This process is also called de-excitation. In such a process, acoustic waves are generated [27], [28], [29], [30]. As a significant spectroscopic technique for trace gas detection, laser-based PAS has unique advantages in addition to the merits of traditional spectroscopic techniques. The PAS signal amplitude S recorded by a sensitive photoacoustic transducer is directly proportional to the excitation optical power P [31]:
| (1) |
where α is the absorption coefficient of the analyte, γ is the adiabatic index, Q is the quality factor of the PAS resonator, C is the transducer efficiency, f is the modulation frequency and V is the PAS cell volume, respectively. It follows that the detection sensitivity can be greatly improved by using a high-power laser as the excitation light source.
For most molecules, the mid-infrared (MIR) spectral region is a fundamental absorption band in which the molecular absorption coefficients are orders of magnitude larger than those in the near-infrared (NIR) region [32]. Therefore, the sensitivity of the sensor can be improved by using the laser with an emission wavelength located in the MIR region as the excitation source. Profits from the favorable wavelength region and high power, many applications in the gas sensing field have been performed with CO2 laser and PAS technique [33], [34], [35], [36]. In the MIR spectral region, limited to the poor beam quality, compared with other techniques like quartz-enhanced photoacoustic spectroscopy (QEPAS) which employs a quartz tuning fork (QTF) as the photoacoustic transducer, the conventional ultrasensitive microphone-based PAS has its unique advantage that it can make the best use of the high power of excitation source to achieve lower detection limit, owing to its large resonator diameter [37], [38], [39]. The PAS gas sensors have been widely used in environmental monitoring, industry process control, and medical breath analysis [40].
Breath analysis of alcohol is commonly used in clinical and law enforcement. The alcohol in pulmonary capillary blood will diffuse into the air in the alveoli, thus the breath alcohol concentration can reveal the arterial blood alcohol concentration, which will persist for several hours after drinking [41]. An accurate breath alcohol concentration always assumes that the measurement occurs on breath alcohol coming from the deep lung. However, alcohol will present in the mouth after the consumption of mouthwashes or ripe fruits such as lychees [42]. Residual alcohol in the oral cavity may contaminate the passing deep lung air, leading to a falsely high result of the breath test [43]. This fact could be used as a defense tactic in court to free subjects who violate the statutory breath alcohol concentration limit. Researches showed that 15 min were required to eliminate all mouth alcohol. As a result, there is a 15–20 min deprivation period before an evidential breath alcohol test [44].
Lychee or litchi (Litchi chinensis Sonn.) is one of the typical foods that may cause residual alcohol in the oral cavity. Lychee is a significant economic fruit crop that is grown in tropical regions and has been spread to many countries due to its beautiful skin color and bizarre and outlandish flavor [45]. The fruit can be round, ovoid, or heart-shaped, and from 2.0 to 3.5 cm in diameter. The flesh is generally translucent white, juicy, sweet, and aromatic and may comprise 80% of fruit weight. During maturation and storage, lychee fruit produces ethanol as a metabolite [46].
In this work, a sensitive ethanol gas sensor based on the PAS technique and a high-power CO2 laser with an emission wavelength of 9.3 µm was developed for mouth alcohol test in breath analysis. In order to realize the laser modulation in the experiment process, the amplitude modulation (AM) method was implemented. The PAS signal was detected by a sensitive microphone. With an integration time of 1 s, a 1σ detection limit of ∼18 ppbv for ethanol trace gas was achieved. As a demonstration of breath tests, we also analyzed the mouth alcohol after consuming different quantities of lychees. The pattern of changes in exhaled ethanol levels was found, proving the detected ethanol after consuming lychees was from the oral cavity.
2. Sensor design
2.1. The selection of excitation source
Generally, most molecules exhibit their characteristic spectra in the fundamental fingerprint region, i.e., MIR spectral range, usually beyond 2.5 µm. The detection sensitivity of the developed sensor can be steeply improved as a result of the implementation of the MIR excitation source. According to the NIST data [47], ethanol gas has strong absorption in the fundamental spectral region, and the transmission spectrum of ethanol gas is depicted in Fig. 1(a). It can be seen that the strongest absorption of the ethanol gas to the radiation locates at the wavelength of ∼9.3 µm.
Fig. 1.

(a) Ethanol transmission spectrum, (b) Ethanol transmission near 9.3 µm (marked in black), and emission of the CO2 laser (marked in red).
As a candidate with good features, such as high power, robust structure, and easy operation, the CO2 laser can be considered for this application [48]. In our experiment, an original equipment manufacturer (OEM) CO2 laser (Coherent) was employed as the excitation source. This kind of CO2 laser is usually used for laser processing of materials such as paper, plastics, wood, etc. Based on a sealed waveguide and integrated RF power supply design, the CO2 laser shows production-proven reliability (lifetime >50,000 h), in a 15.5 × 3.7 × 6.1 in. integrated package. The emission spectrum of the CO2 laser was measured using a Fourier-transform infrared spectrometer (FTIR, VERTEX 70 v, Bruker), as depicted in Fig. 1(b). It shows the emission of the light as a function of the wavelength. The emission wavelength centered at 9.292 µm. A Gauss fit was used to obtain the full width at half maximum (FWHM) of the spectrum ∼49.8 nm. The ethanol transmission spectrum near 9.3 µm was drawn together with the emission spectrum of the CO2 laser. It can be seen from Fig. 1(b) that there is a good consistency between the two. The laser beam profile was analyzed by a mid-infrared charge-coupled device (CCD) camera. The beam emitting by the CO2 laser shows a beam divergence < 7.5 mrad. The profile of the beam spot was obtained by the CCD camera at a distance of 27.8 mm, as shown in Fig. 2. The beam diameter was ∼ 2.169 mm.
Fig. 2.
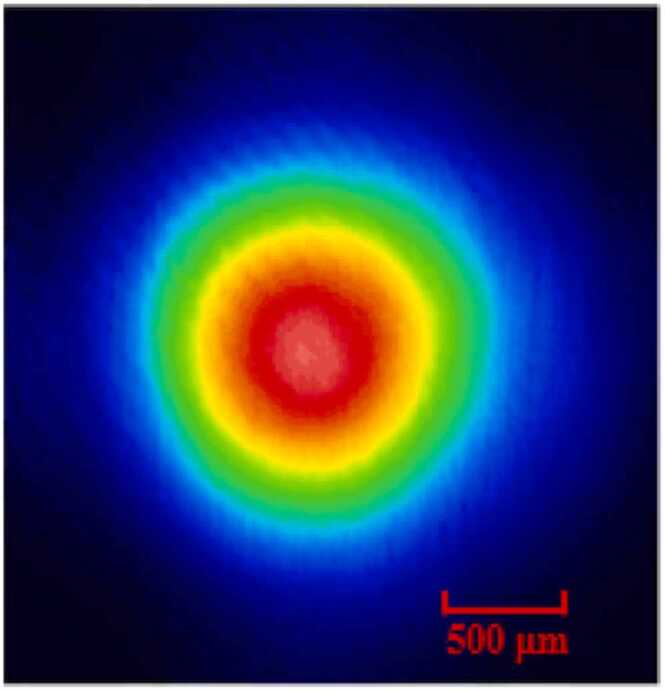
CO2 laser beam spot measured by a mid-infrared CCD.
2.2. Photoacoustic cell design
The photoacoustic cell was designed based on longitudinal resonance. In order to allow the collimation of the used CO2 laser, a resonator with a diameter of 8 mm was used. Aiming at a resonance frequency of around 1.5 kHz, the resonator length was 100 mm. Two identical buffers with a diameter of 40 mm and a length of 50 mm were set at two ends of the resonator. To reduce the propagation loss of the laser beam, two anti-reflection film-coated ZnSe windows with a diameter of 25 mm were mounted, with a transmissivity of > 98% at 9.3 µm. The resonance curve of the photoacoustic cell was measured by scanning the frequency of the driver signal of the CO2 laser, and the cell was filled with 20.06 ppmv of C2H6O. This process was controlled by a LabVIEW program. A Lorentz fit was used to obtain the resonance frequency and Q value of the cell. The fitting result exhibits an R square value of 0.998. The resonance frequency of the photoacoustic cell was f0 = 1608.3 Hz and the FWHM of the resonance curve was , resulting in a Q-factor of 21, as shown in Fig. 3. The average power of the CO2 laser was 8.2 W in the process of frequency scanning. The acquired photoacoustic signal amplitude was normalized to power. When the frequency was equal to 1608.3 Hz, the photoacoustic cell reached a resonant state, and the corresponding peak value of the photoacoustic signal was 0.018 V/W.
Fig. 3.

Frequency response of the photoacoustic cell within 20.06 ppmv of C2H6O background.
3. Experimental apparatus arrangement
The experimental schematic of the developed sensor system is depicted in Fig. 4. The laser beam of the CO2 laser was directly passed through the photoacoustic cell without focusing. A power meter (Nova Ⅱ, Ophir) with a 30 W power probe was positioned behind the photoacoustic cell to monitor the optical power. The laser was modulated with AM technology. An arbitrary function generator (AFG3102C, Tektronix) was used to generate a square wave signal with a duty cycle of 50% and a frequency of f0 to drive the CO2 laser. The frequency f0 of 1608.3 Hz is equal to the resonance frequency of the photoacoustic cell. The amplitude of the square wave signal is 5 V. The acoustic signal produced by the photo-acoustic effect was detected by a microphone with a sensitivity of 50 mV/Pa and then it was converted into an electrical signal. The generated electrical signal was amplified by a pre-amplifier and then fed into a lock-in amplifier (SR830, Stanford Research Systems). The lock-in amplifier operated at 1-f harmonic mode to demodulate the signal. The reference signal from the function generator is fed to the reference channel of the lock-in amplifier to achieve signal synchronization. The time constant and filter slope of the lock-in amplifier were set to 1 s and 12 dB/oct, respectively. The demodulated signal was then transmitted to the personal computer through RS232 serial protocol. A home-coded LabVIEW-based program was used to process the data in real-time.
Fig. 4.

Schematic of the developed sensor system. MFC: mass flow controller, AFG: arbitrary function generator, PC: personal computer.
A gas dilution system consisting of two mass flow controllers (MFCs) and gas cylinders was employed to generate different target gas concentrations and control the gas flow rate. A 100 ppmv C2H6O-N2 gas mixture with an uncertainty of 1% was diluted with pure N2 to vary the concentration of the gas mixture. To reduce the adsorption effect, the gas dilution system was set to flow mode, and the total gas flow rate was set at a constant value of 100 sccm (standard cubic centimeters per minute). In the subsequent breath analysis experiment, in order to eliminate the influence caused by the water vapor, a gas drying process was implemented.
4. Experimental results and discussion
4.1. Sensor performance evaluation
The performance of the developed high-power photoacoustic ethanol sensor was evaluated at different C2H6O:N2 mixing ratios from 0 ppmv to 100 ppmv. To ensure that the sensor evaluation of gas samples is available for real ambient atmospheric monitoring or some kind of analogous measurements like exhaled breath analysis, the measurements were carried out at atmospheric pressure and room temperature. The PAS signal at different concentrations of ethanol gas, as well as pure N2 gas, are plotted in Fig. 5(a). In order to eliminate the influence of laser power fluctuation, the PAS signal was normalized to the real-time monitored optical power. The PAS signal at each concentration level was plotted by 100 points. Each data point was obtained by lock-in amplifier with 1 s integration time. In the case of the 100.3 ppmv C2H6O detection, a PAS signal amplitude of 69.85 mV/W was achieved. The background was measured when the photoacoustic cell was filled with pure N2. Fig. 5(b) shows the enlargement of a background noise floor of 2.25 mV/W with a 1σ noise level of 13 μV/W. Based on the measured signal and noise, a signal-to-noise ratio (SNR) of ∼5373 can be obtained. The corresponding 1σ detection limit of ∼18 ppbv for gaseous ethanol can be calculated as well. The calculated normalized noise equivalent absorption (NNEA) coefficient was 1.94 × 10⁻⁷ W٠cm−1٠Hz−1/2. Fig. 6 depicts the linearity of the developed sensor and the variation of standard deviation with ethanol concentration. The average values of the PAS signal were plotted as a function of ethanol concentration. The measurement cycle is 100 s at each concentration. The results indicated a linear dependence relation between the PAS signal and ethanol concentration. A linear fit was implemented. The obtained R square value of 0.999 confirms the excellent linearity of the sensor response. In Fig. 6, there is a discrepancy between the signal by pure N2 and the intercept of the linear fitting. This may be caused by the nonlinear effect of the used microphone [49].
Fig. 5.

(a) The detected PAS signal at different concentration levels of ethanol gas. (b) Background noise was acquired when the photoacoustic cell was filled with pure N2.
Fig. 6.

Linearity of the PAS-based ethanol sensing system and variation of standard deviation with ethanol concentration (marked in blue).
4.2. Breath experiment after lychee consumption
Ethanol was found to be the most abundant alcohol in lychees [50]. Ethanol production occurs in lychees both before and after being harvested. During lychee fruit maturation on the tree, ethanol has been found to become pronounced [46]. After the harvest of lychees, ethanol will quickly accumulate with the anaerobic respiration increased [51]. In detached lychees, with the loss of water [52], the concentration of ethanol will increase. As ethanol presents in ripe lychee fruits, the ethanol will remain in the oral cavity after consuming lychees, resulting in the present of ethanol in the exhaled breath.
As a proof-of-concept experiment, we experimentally measured the breath ethanol levels after consuming lychees. Compared to pure nitrogen gas, the resonance frequency of the cell filled with breath gas decreased by ∼30 Hz, while the Q factor shifted < 1. According to [53], the cell parameters such as resonance frequency, Q factor, and adiabatic exponent will be influenced by the concentration of CO2 and water vapor, and changes in the adiabatic exponent is less significant. In this experiment, the Q factor was nearly unchanged. To avoid signal changes caused by cell parameters, the resonance curve was re-calibrated before each measurement. The obtained signal of one breath was shown in Fig. 7. The black, red, and blue line were the signal of consuming 10, 20, and 30 g of lychee fruits, respectively. The signal curve of one breath consisted of three parts. At first, we filled the photoacoustic cell with pure N2. Then, our volunteer consumed lychee fruits and started to blow into the PAS cell immediately. In order to eliminate the effects of humidity, a gas drying unit was connected to the gas inlet of the PAS cell to dry the exhaled air. The breath sample was directly blown into the system and measured. The blow process lasted about 15 s, in which the signal started to rise to a peak. After the signal reached a peak, we recorded the value and washed out the PAS cell with pure N2. The wash process cost about 20 s. The signal increasing and decreasing time depended on the gas flow rate of the stream. One blow-wash cycle was about 1 min and then the volunteer started the next blow. As for the sampling condition, the volunteer was required to be fasting before the test. During the experiment, the volunteer had not talked or opened his mouth for maximum mouth alcohol retention.
Fig. 7.

Processes of the exhaled breath measurement after consuming different quantities of lychee fruits.
The breath experiment was conducted repeatedly for 3 times in 3 min. We extracted the peak value after consuming different quantities of lychees over time and plotted it in Fig. 8. Before consuming the lychee, we measured the common human breath. The green dash line was the peak value of the common breath, which was regarded as the baseline of mouth alcohol. After consuming the lychee, we measured the increment of mouth alcohol. The rectangles, rounds, and triangles represent the peak values consuming 10 g, 20 g, and 30 g lychee fruit as a function of time. Dot lines were the liner fits of the values. All three lines exhibited a linear downward trend in 3 min. As the quantities of consumed lychee increased from 10 g to 30 g, the initial mouth alcohol concentration rose from 3.14 ppmv to 7.61 ppmv. With 10 g lychee, the mouth alcohol decreased to the baseline level in 3 min. According to the slope of the dot line with triangles, less than 10 min are required for the mouth alcohol to return to the baseline. The increment of mouth alcohol concentration was calculated by subtracting the value of the baseline signal from the peak value and shown in Table 1.
Fig. 8.

Time-dependent observation of photoacoustic signal after consuming different quantities of lychees. The dash line represents the exhaled air without consuming lychee fruits. The dot line represents the extension of the linear fit.
Table 1.
Mouth alcohol concentration over time.
| Mouth alcohol concentration (ppmv) |
|||
|---|---|---|---|
| Qualities of lychees | 1 min | 2 min | 3 min |
| 10 g | 3.14 | 1.53 | 0.16 |
| 20 g | 4.92 | 3.80 | 2.79 |
| 30 g | 7.61 | 6.68 | 4.79 |
4.3. CO2 compensation in mouth alcohol test
As the CO2 laser was used in the breath experiment, CO2 in exhaled breath was absorbing and contributing to the photoacoustic signal. During the detection of mouth alcohol, the influence of CO2 had been compensated by subtracting the baseline from the increased signal. However, the CO2 concentration may change in each breath cycle. To explore the influence brought about by this alteration, an integrated QEPAS sensor employing a 2004 nm laser was used to detect the variation of CO2 between breath [54]. Among the gas molecules exhaled by human, only CO2 exhibits strong absorption within the 2004 nm laser wavelength range. In this case, the CO2 concentration was continuously monitored. The same gas flow system and drying unit as the mouth alcohol detection were utilized. The blow-wash cycle was conducted using the QEPAS CO2 sensor before and after our volunteer consuming lychees. The CO2 concentrations were shown in Fig. 9.
Fig. 9.

Breath CO2 concentration before and after lychee consumption.
The CO2 concentration of four cycles was extracted, leading to a mean value of 44352 ppmv and a standard deviation of 172 ppmv. This result indicated that the variation in CO2 concentration between breaths was less than 0.5% within a few minutes. In addition, before and after consuming lychee, the exhaled CO2 concentration remains nearly unchanged. To investigate whether such variations in CO2 concentration could affect the PAS mouth alcohol sensor, an absorption simulation was carried out through SpectraPlot [55]. With the removal of the baseline (mean value of ∼4%v CO2), the spectra of 3 ppmv ethanol and 200 ppmv CO2 were shown in Fig. 10. Around 9.3 µm, the absorption of 200 ppmv CO2 is weaker by > 1 order of magnitude compared to 3 ppmv ethanol, which may cause little effect on the signal.
Fig. 10.

Simulated absorbance of 3 ppmv ethanol and 200 ppmv CO2.
To validate the simulated results, consecutive breath measurement before and after lychee consumption was conducted by the PAS sensor. The obtained signal was shown in Fig. 11(a). Before consuming lychees, the three blue cycles exhibited similar peak values, with a standard deviation of < 0.3%. The peak values of three red cycles were extracted and converted to increased mouth alcohol concentration, shown in Fig. 11(b). The initial mouth alcohol concentration was 3.13 ppmv, and it returned to the baseline within 3 min.
Fig. 11.

(a) Breath measurement by PAS sensor before and after lychee consumption. (b) Increased mouth alcohol concentration after consuming lychees over time.
5. Discussion
The breath alcohol concentration can closely predict arterial blood alcohol concentration and is as precise as blood alcohol analysis [56]. After drinking, alcohol enters the bloodstream and the alcohol in the pulmonary capillaries will be in equilibrium with the air in the alveoli, driven by substantial differences in partial pressure and solubility properties. When the air is exhaled, the alcohol vapor passes the airway to the ambient air, allowing for detection through breath analysis [56]. Typically, the blood alcohol concentration takes 6–7 h to eliminate [57].
In the case of lychee consumption, the alcohol present in the fruit can remain in the oral cavity. When measuring the exhaled alcohol, contamination from the alcohol in the oral cavity can lead to higher measurement values. However, the concentration of alcohol in the oral cavity decreases rapidly within 15–20 min compared to the blood alcohol concentration [58]. In our experiment, the more lychees were consumed, the higher the mouth alcohol concentration was. The detected mouth alcohol from lychee fruits would eliminate in a few minutes, which proved that the ethanol in exhaled breath was from the oral cavity rather than blood. This study reaffirmed the importance of the 15–20 min observation period and duplicate breath test to allow any possible mouth alcohol to dissipate.
6. Conclusions
A sensitive high-power PAS sensor for gaseous ethanol detection was developed and demonstrated. A compact CO2 laser with ∼10 W emission power was implemented as the excitation source. A photoacoustic cell was designed to detect the photoacoustic signals. Benefitting from the high optical power and strong absorption in the MIR region, a detection limit of 18 ppbv was achieved with an integration time of 1 s. The linearity of the sensor system was evaluated and an R square value of ∼0.999 was obtained. As an experimental demonstration, the exhaled breath measurement after consuming lychees was performed by measuring the ethanol in the breath. The detected alcohol concentration decreased in a few minutes. Our experiment confirmed the detection of alcohol in the oral cavity, which was indicated by the observed signal patterns and the stability of other exhaled gases, while the blood alcohol concentration could last for several hours after drinking. To the extent that our sensing system can quickly distinguish the mouth alcohol from the exhaled breath, which is of great clinical and forensic significance. Further work can be done by performing a serial measurement with the gold standard measurement device such as gas chromatography–mass spectrometry (GC-MS) or proton-transfer-reaction time-of-flight mass spectrometer (PTR-TOF-MS).
Declaration of Competing Interest
We wish to confirm that there are no known conflicts of interest associated with this publication and there has been no significant financial support for this work that could have influenced its outcome. We confirm that the manuscript has been read and approved by all named authors and that there are no other persons who satisfied the criteria for authorship but are not listed. We further confirm that the order of authors listed in the manuscript has been approved by all of us. We confirm that we have given due consideration to the protection of intellectual property associated with this work and that there are no impediments to publication, including the timing of publication, with respect to intellectual property. In so doing we confirm that we have followed the regulations of our institutions concerning intellectual property.
Acknowledgments
This work is supported by the National Key Research and Development Program of China (2021YFB2800801, 2019YFE0118200), National Natural Science Foundation of China (62362375111, 12174156, 12174155, 62105125, 62005105, 62075088, 62175137), Natural Science Foundation of Guangdong Province (2020B1515020024, 2019A1515011380), the Science and Technology Projects of Guangzhou (202102020445), Key-Area Research and Development Program of Guangdong Province (2019B010138004), Project of Guangzhou Industry Leading Talents (CXLJTD-201607), Aeronautical Science Foundation of China (201808W4001), Special Project in Key Fields of the Higher Education Institutions of Guangdong Province (2020ZDZX3022), Open foundation of CEPREI (NO. 19D09), Foundation for Distinguished Young Talents in Higher Education of Guangdong (2018KQNCX009), the Fundamental Research Funds for the Central Universities (21619402, 11618413), State Key Laboratory of Applied Optics (SKLAO-201914). Special Funds for the Cultivation of Guangdong College Students' Scientific and Technological Innovation (No. pdjh2023a0052).
Biographies

Huijian Luo received his bachelor’s degree in optoelectronics information science and engineering from Jinan University, China, in 2022. He is now pursuing a master’s degree in optical engineering from the department of photoelectric engineering at Jinan University. His research interests include photoacoustic spectroscopy and laser spectroscopy.

Zhifei Yang received his bachelor’s degree in electronic information science and technology from Quanzhou Normal University, China, in 2020. He is now pursuing a master’s degree in electronic information from the department of photoelectric engineering at Jinan University. His research interests include laser spectroscopy techniques and instrument development.

Ruobin Zhuang is now pursuing a bachelor's degree in the department of Optoelectronic Engineering at Jinan University, China. His recent research interests include photoacoustic spectroscopy, gas sensor, and laser spectroscopy.

Haohua Lv received his bachelor’s degree in the department of optoelectronic engineering in 2022 from Jinan University, Guangzhou, Chin. He is now pursuing a master’s degree in the Department of Optoelectronic Engineering at Jinan University, China. His recent research interests include photoacoustic spectroscopy and laser absorption cell.

Chenglong Wang received his bachelor’s degree in the school of electrical and photoelectronic engineering in 2020 from West Anhui University, Anhui, China. He is now pursuing a master's degree in the Department of Optoelectronic Engineering at Jinan University, China. His research interests include gas sensor, multi-pass cell, and photoacoustic spectroscopy.

Haoyang Lin received his bachelor’s degree in the department of optoelectronic engineering in 2021 from Jinan University, Guangzhou, China. He is now pursuing a master’s degree in the Department of Optoelectronic Engineering at Jinan University, China. His recent research His research interests include gas sensor, photoacoustic spectroscopy, and laser spectroscopy.

Di Zhang received a medical master's degree in 2020 from Jinan University, Guangzhou, and now is pursuing a medicine doctor degree at the College of Traditional Chinese Medicine, Jinan University, Guangzhou. His recent research interests include diabetes neuralgia and sciatica.

Wenguo Zhu is now an associate professor in the Department of Optoelectronic Engineering at Jinan University, China. He got both his Ph. D. degree in Optics in 2016 and his bachelor’s degree in optical information in 2011 from Sun Yet-Sen University, China. His recent research interests include optical spin and orbital angular momentum, zero-index metamaterial, novel nano-photonic devices, and novel optical fiber sensors.
Yongchun Zhong received a Ph.D. degree in optics from Sun Yat-sen University, Guangzhou, China, in 2004. Then, he did postdoctoral research with the Hong Kong University of Science and Technology from 2004 to 2009. He is a professor at Jinan University, Guangzhou, China. He has authored more than 30 journal papers. His current research interests include photonic crystal fiber devices, holography, and photoelectric material.

Yuan Cao is currently a postdoc in Prof. Kun Liu’s group at Anhui Institute of Optics & Fine Mechanics, Chinese Academy of Sciences. His research interests are sensing trace gases and aerosols with photoacoustic spectroscopy. He received his Ph.D. degree in physics from the University of Science and Technology of China in 2021.

Kun Liu received his Ph.D. degree in optics from the Anhui Institute of Optics & Fine Mechanics, Chinese Academy of Sciences in 2010. Now he is a professor at the Anhui Institute of Optics & Fine Mechanics, Chinese Academy of Sciences. His research interests include photoacoustic spectroscopy and laser spectroscopy for application in atmospheric photochemistry and environmental science.

Ruifeng Kan received his Ph.D. degree from the Anhui Institute of Optics and Fine Mechanics, CAS. His research interests focus on laser spectroscopy and its application in environmental pollution, production safety, aerospace flow field diagnosis, and deep sea dissolved gas detection.

Yuwei Pan received her doctor’s degree in the department of Traditional Chinese medicine in 2016 from Jinan University, Guangzhou, China. She is now working at the Affiliated TCM Hospital of Guangzhou Medical University. Her recent research interests include peripheral neuropathy and inflammation.

Jianhui Yu is a professor in the Department of Optoelectronic Engineering at Jinan University, China. He got both his Ph. D. degree in optical engineering in 2009 and his bachelor’s degree in physics in 2002 from Sun Yet-Sen University, China. His recent research interests include novel micro/nano fiber-based optical devices, all optical controllable devices, optical momentum in dielectric media and waveguide, measurement, and application of optical force, and novel optical sensors.

Huadan Zheng received his Ph.D. degree in atomic and molecular physics from Shanxi University, China, in 2018. From 2016–2017, he studied as a joint Ph.D. student in the electrical and computer engineering department and rice quantum institute, Rice University, Houston, USA. Currently, he is an associate professor in the Department of Optoelectronic Engineering at Jinan University. His research interests include optical sensors and laser spectroscopy techniques.
Data Availability
Data will be made available on request.
References
- 1.Fathy A., Sabry Y.M., Hunter I.W., Khalil D., Bourouina T. Direct absorption and photoacoustic spectroscopy for gas sensing and analysis: a critical review. Laser Photon. Rev. 2022;16(8) [Google Scholar]
- 2.Sampaolo A., Patimisco P., Giglio M., Zifarelli A., Wu H., Dong L., Spagnolo V. Quartz-enhanced photoacoustic spectroscopy for multi-gas detection: a review. Anal. Chim. Acta. 2022;1202 doi: 10.1016/j.aca.2021.338894. [DOI] [PubMed] [Google Scholar]
- 3.Dumitras D.C., Petrus M., Bratu A.-M., Popa C. Applications of near infrared photoacoustic spectroscopy for analysis of human respiration: a review. Molecules. 2020;25(7) doi: 10.3390/molecules25071728. [DOI] [PMC free article] [PubMed] [Google Scholar]
- 4.Sigrist M.W. Wiley; 1994. Air monitoring by spectroscopic techniques. [Google Scholar]
- 5.Zhang H., Wang Z., Wang Q., Borri S., Galli I., Sampaolo A., Patimisco P., Spagnolo V.L., De Natale P., Ren W. Parts-per-billion-level detection of hydrogen sulfide based on doubly resonant photoacoustic spectroscopy with line-locking. Photoacoustics. 2023;29 doi: 10.1016/j.pacs.2022.100436. [DOI] [PMC free article] [PubMed] [Google Scholar]
- 6.Olivieri M., Menduni G., Giglio M., Sampaolo A., Patimisco P., Wu H., Dong L., Spagnolo V. Characterization of H2S QEPAS detection in methane-based gas leaks dispersed into environment. Photoacoustics. 2023;29 doi: 10.1016/j.pacs.2022.100438. [DOI] [PMC free article] [PubMed] [Google Scholar]
- 7.Popa C., Bratu A.M., Petrus M. A comparative photoacoustic study of multi gases from human respiration: mouth breathing vs. nasal breathing. Microchem J. 2018;139:196–202. [Google Scholar]
- 8.An D., Liu N., Li Y., Zhou Q., Wang Q., Zou Y., Lian X. Synthesis of Sm doped SnO2 nanoparticles and their ethanol gas traces detection. Ceram. Int. 2021;47(18):26501–26510. [Google Scholar]
- 9.Wang L., Kang Y., Liu X., Zhang S., Huang W., Wang S. ZnO nanorod gas sensor for ethanol detection. Sens. Actuator B-Chem. 2012;162(1):237–243. [Google Scholar]
- 10.Wu W.-Y., Ting J.-M., Huang P.-J. Electrospun ZnO nanowires as gas sensors for ethanol detection. Nanoscale Res. Lett. 2009;4(6):513–517. doi: 10.1007/s11671-009-9271-4. [DOI] [PMC free article] [PubMed] [Google Scholar]
- 11.Yin X., Dong L., Wu H., Gao M., Zhang L., Zhang X., Liu L., Shao X., Tittel F.K. Compact QEPAS humidity sensor in SF6 buffer gas for high-voltage gas power systems. Photoacoustics. 2022;25 doi: 10.1016/j.pacs.2021.100319. [DOI] [PMC free article] [PubMed] [Google Scholar]
- 12.Lin H., Liu Y., Lin L., Zhu W., Zhou X., Zhong Y., Giglio M., Sampaolo A., Patimisco P., Tittel F.K., Yu J., Spagnolo V., Zheng H. Application of standard and custom quartz tuning forks for quartz-enhanced photoacoustic spectroscopy gas sensing. Appl. Spectrosc. Rev. 2022:1–23. [Google Scholar]
- 13.Li S., Lu J., Shang Z., Zeng X., Yuan Y., Wu H., Pan Y., Sampaolo A., Patimisco P., Spagnolo V., Dong L. Compact quartz-enhanced photoacoustic sensor for ppb-level ambient NO2 detection by use of a high-power laser diode and a grooved tuning fork. Photoacoustics. 2022;25 doi: 10.1016/j.pacs.2021.100325. [DOI] [PMC free article] [PubMed] [Google Scholar]
- 14.Li B., Feng C., Wu H., Jia S., Dong L. Calibration-free mid-infrared exhaled breath sensor based on BF-QEPAS for real-time ammonia measurements at ppb level. Sens. Actuator B-Chem. 2022;358 [Google Scholar]
- 15.Popa C., Petrus M., Bratu A.M. Alfalfa (Medicago sativa) sprouts respiratory responses to cadmium stress using IR LPAS. Molecules. 2022;27(6) doi: 10.3390/molecules27061891. [DOI] [PMC free article] [PubMed] [Google Scholar]
- 16.Popa C., Petrus M., Bratu A.M. Effect of wearing surgical face masks on gas detection from respiration using photoacoustic spectroscopy. Molecules. 2022;27(11) doi: 10.3390/molecules27113618. [DOI] [PMC free article] [PubMed] [Google Scholar]
- 17.Petrus M., Popa C., Bratu A.-M. Ammonia concentration in ambient air in a peri-urban area using a laser photoacoustic spectroscopy detector. Materials. 2022;15(9) doi: 10.3390/ma15093182. [DOI] [PMC free article] [PubMed] [Google Scholar]
- 18.Yang Z., Lin H., Montano B.A.Z., Zhu W., Zhong Y., Yuan B., Yu J., Kan R., Shao M., Zheng H. High-power near-infrared QEPAS sensor for ppb-level acetylene detection using a 28 kHz quartz tuning fork and 10 W EDFA. Opt. Express. 2022;30(4):6320–6331. doi: 10.1364/OE.449357. [DOI] [PubMed] [Google Scholar]
- 19.Wang Z., Wang Q., Zhang H., Borri S., Galli I., Sampaolo A., Patimisco P., Spagnolo V.L., De Natale P., Ren W. Doubly resonant sub-ppt photoacoustic gas detection with eight decades dynamic range. Photoacoustics. 2022;27 doi: 10.1016/j.pacs.2022.100387. [DOI] [PMC free article] [PubMed] [Google Scholar]
- 20.Liu L., Huan H., Mandelis A., Zhang L., Guo C., Li W., Zhang X., Yin X., Shao X., Wang D. Design and structural optimization of T-resonators for highly sensitive photoacoustic trace gas detection. Opt. Laser Technol. 2022;148 [Google Scholar]
- 21.Cao Y., Wang R., Peng J., Liu K., Chen W., Wang G., Gao X. Humidity enhanced N2O photoacoustic sensor with a 4.53 μm quantum cascade laser and Kalman filter. Photoacoustics. 2021;24 doi: 10.1016/j.pacs.2021.100303. [DOI] [PMC free article] [PubMed] [Google Scholar]
- 22.Ren X., Yan M., Wen Z., Ma H., Li R., Huang K., Zeng H. Dual-comb quartz-enhanced photoacoustic spectroscopy. Photoacoustics. 2022;28 doi: 10.1016/j.pacs.2022.100403. [DOI] [PMC free article] [PubMed] [Google Scholar]
- 23.Lin H., Zheng H., Montano B.A.Z., Wu H., Giglio M., Sampaolo A., Patimisco P., Zhu W., Zhong Y., Dong L., Kan R., Yu J., Spagnolo V. Ppb-level gas detection using on-beam quartz-enhanced photoacoustic spectroscopy based on a 28 kHz tuning fork. Photoacoustics. 2022;25 doi: 10.1016/j.pacs.2021.100321. [DOI] [PMC free article] [PubMed] [Google Scholar]
- 24.Wang F., Cheng Y., Xue Q., Wang Q., Liang R., Wu J., Sun J., Zhu C., Li Q. Techniques to enhance the photoacoustic signal for trace gas sensing: a review. Sens. Actuator A-Phys. 2022;345 [Google Scholar]
- 25.V.R N., Mohapatra A.K., Nayak R., V.K U., Kartha V.B., Chidangil S. UV laser-based photoacoustic breath analysis for the diagnosis of respiratory diseases: Detection of Asthma. Sens. Actuator B-Chem. 2022;370 [Google Scholar]
- 26.Guo M., Chen K., Li C., Xu L., Zhang G., Wang N., Li C., Ma F., Gong Z., Yu Q. High-sensitivity silicon cantilever-enhanced photoacoustic spectroscopy analyzer with low gas consumption. Anal. Chem. 2022;94(2):1151–1157. doi: 10.1021/acs.analchem.1c04309. [DOI] [PubMed] [Google Scholar]
- 27.Qiao S., Qu Y., Ma Y., He Y., Wang Y., Hu Y., Yu X., Zhang Z., Tittel F.K. A sensitive carbon dioxide sensor based on photoacoustic spectroscopy with a fixed wavelength quantum cascade laser. Sensors. 2019;19(19):4187. doi: 10.3390/s19194187. [DOI] [PMC free article] [PubMed] [Google Scholar]
- 28.Xiong L., Bai W., Chen F., Zhao X., Yu F., Diebold G.J. Photoacoustic trace detection of gases at the parts-per-quadrillion level with a moving optical grating. Proc. Natl. Acad. Sci. U. S. A. 2017;114(28):7246. doi: 10.1073/pnas.1706040114. [DOI] [PMC free article] [PubMed] [Google Scholar]
- 29.Li J., Chen W., Yu B. Recent progress on infrared photoacoustic spectroscopy techniques. Appl. Spectrosc. Rev. 2011;46(6):440–471. [Google Scholar]
- 30.Miklos A., Hess P., Bozoki Z. Application of acoustic resonators in photoacoustic trace gas analysis and metrology. Rev. Sci. Instrum. 2001;72(4):1937–1955. [Google Scholar]
- 31.Zheng H., Liu Y., Lin H., Kan R., Patimisco P., Sampaolo A., Giglio M., Zhu W., Yu J., Tittel F.K., Spagnolo V., Chen Z. Sub-ppb-level CH4 detection by exploiting a low-noise differential photoacoustic resonator with a room-temperature interband cascade laser. Opt. Express. 2020;28(13):19446–19456. doi: 10.1364/OE.391322. [DOI] [PubMed] [Google Scholar]
- 32.Zhang Y., Gao W., Song Z., An Y., Li L., Song Z., Yu W.W., Wang Y. Design of a novel gas sensor structure based on mid-infrared absorption spectrum. Sens. Actuator B-Chem. 2010;147(1):5–9. [Google Scholar]
- 33.Apriyanto D.K., Satriawan M. CO2 laser photoacoustic spectrometer for measuring acetone in the breath of lung cancer patients. Biosensors. 2020;10(6):55. doi: 10.3390/bios10060055. [DOI] [PMC free article] [PubMed] [Google Scholar]
- 34.Pushkarsky M., Webber M., Patel C. Ultra-sensitive ambient ammonia detection using CO2-laser-based photoacoustic spectroscopy. Appl. Phys. B-Lasers Opt. 2003;77(4):381–385. [Google Scholar]
- 35.Harren F.J., Cotti G., Oomens J., te Lintel Hekkert S. Photoacoustic spectroscopy in trace gas monitoring. Encycl. Anal. Chem. 2000;3:2203–2226. [Google Scholar]
- 36.Meyer P., Sigrist M. Atmospheric pollution monitoring using CO2‐laser photoacoustic spectroscopy and other techniques. Rev. Sci. Instrum. 1990;61(7):1779–1807. [Google Scholar]
- 37.Wu H., Sampaolo A., Dong L., Patimisco P., Liu X., Zheng H., Yin X., Ma W., Zhang L., Yin W., Spagnolo V., Jia S., Tittel F.K. Quartz enhanced photoacoustic H2S gas sensor based on a fiber-amplifier source and a custom tuning fork with large prong spacing. Appl. Phys. Lett. 2015;107(11) [Google Scholar]
- 38.Wu H., Dong L., Zheng H., Liu X., Yin X., Ma W., Zhang L., Yin W., Jia S., Tittel F.K. Enhanced near-infrared QEPAS sensor for sub-ppm level H2S detection by means of a fiber amplified 1582 nm DFB laser. Sens. Actuator B-Chem. 2015;221:666–672. [Google Scholar]
- 39.Yin X., Dong L., Wu H., Zheng H., Ma W., Zhang L., Yin W., Jia S., Tittel F.K. Sub-ppb nitrogen dioxide detection with a large linear dynamic range by use of a differential photoacoustic cell and a 3.5W blue multimode diode laser. Sens. Actuator B-Chem. 2017;247:329–335. [Google Scholar]
- 40.Wang F., Cheng Y., Xue Q., Wang Q., Liang R., Wu J., Sun J., Zhu C., Li Q. Techniques to enhance the photoacoustic signal for trace gas sensing: a review. Sens. Actuators, A. 2022 [Google Scholar]
- 41.Jones A.W. Alcohol, its analysis in blood and breath for forensic purposes, impairment effects, and acute toxicity. Wiley Inter. Rev. 2019;1.4 [Google Scholar]
- 42.Logan B.K., Distefano S. Ethanol content of various foods and soft drinks and their potential for interference with a breath-alcohol test. J. Anal. Toxicol. 1998;22.3:181–183. doi: 10.1093/jat/22.3.181. [DOI] [PubMed] [Google Scholar]
- 43.Gullberg R.G. The elimination rate of mouth alcohol: mathematical modeling and implications in breath alcohol analysis. J. Forensic Sci. 1992;37(5):1363–1372. [PubMed] [Google Scholar]
- 44.Sterling K. The rate of dissipation of mouth alcohol in alcohol positive subjects. J. Forensic Sci. 2012;57(3):802–805. doi: 10.1111/j.1556-4029.2011.02023.x. [DOI] [PubMed] [Google Scholar]
- 45.Zhao L., Wang K., Wang K., Zhu J., Hu Z. Nutrient components, health benefits, and safety of litchi (Litchi chinensis Sonn.): a review. Compr. Rev. Food Sci. Food Saf. 2020;19(4):2139–2163. doi: 10.1111/1541-4337.12590. [DOI] [PubMed] [Google Scholar]
- 46.Pesis E., Dvir O., Feygenberg O., Arie R.B., Ackerman M., Lichter A. Production of acetaldehyde and ethanol during maturation and modified atmosphere storage of litchi fruit. Postharvest Biol. Technol. 2002;26(2):157–165. [Google Scholar]
- 47.NIST Chemistry WebBook. https://webbook.nist.gov/chemistry.
- 48.Sigrist M.W. Trace gas monitoring by laser photoacoustic spectroscopy and related techniques (plenary) Rev. Sci. Instrum. 2003;74(1):486–490. [Google Scholar]
- 49.Chowdhury S., Ahmadi M., Miller W.C. Proceedings International Conference on MEMS, NANO and Smart Systems. IEEE,; 2003. Nonlinear effects in MEMS capacitive microphone design; pp. 297–302. [Google Scholar]
- 50.Wu Y., Pan Q., Qu W., Duan C. Comparison of volatile profiles of nine litchi (Litchi chinensis Sonn.) cultivars from Southern China. J. Agric. Food Chem. 2009;57(20):9676–9681. doi: 10.1021/jf902144c. [DOI] [PubMed] [Google Scholar]
- 51.Wu Z.X., Ji Z.L., Su M.X., Chen W.X. Postharvest research and handling of litchi in China-a review. I Int. Symp. . Litchi Longan. 2000;558:321–329. [Google Scholar]
- 52.Huang X.M., Wang H.C., Yuan W.Q., Lu J.M., Yin J.H., Luo S., Huang H.B. A study of rapid senescence of detached litchi: roles of water loss and calcium. Postharvest Biol. Technol. 2005;36(2):177–189. [Google Scholar]
- 53.Pangerl J., Moser E., Müller M., Weigl S., Jobst S., Rück T., Bierl R., Matysik F. A sub-ppbv-level acetone and ethanol quantum cascade laser based photoacoustic sensor – characterization and multi-component spectra recording in synthetic breath. Photoacoustics. 2023;30 doi: 10.1016/j.pacs.2023.100473. 1. [DOI] [PMC free article] [PubMed] [Google Scholar]
- 54.Liu Y., Lin H., Montano B.A.Z., Zhu W., Zhong Y., Kan R., Yuan B., Yu J., Shao M., Zheng H. Integrated near-infrared QEPAS sensor based on a 28 kHz quartz tuning fork for online monitoring of CO2 in the greenhouse. Photoacoustics. 2022;25 doi: 10.1016/j.pacs.2022.100332. [DOI] [PMC free article] [PubMed] [Google Scholar]
- 55.Goldenstein C.S., Miller V.A., Spearrin R.M., Strand C.L. SpectraPlot. com: Integrated spectroscopic modeling of atomic and molecular gases. J. Quant. Spectrosc. Radiat. Transf. 2017;200:249–257. [Google Scholar]
- 56.Lindberg L., Grubb D., Dencker D., Finnhult M., Olsson S. Detection of mouth alcohol during breath alcohol analysis. Forensic Sci. Int. 2015;249:66–72. doi: 10.1016/j.forsciint.2015.01.017. [DOI] [PubMed] [Google Scholar]
- 57.Jones A.W. Evidence-based survey of the elimination rates of ethanol from blood with applications in forensic casework. Forensic Sci. Int. 2010;200(1–3):1–20. doi: 10.1016/j.forsciint.2010.02.021. 1. [DOI] [PubMed] [Google Scholar]
- 58.Sterling K. The rate of dissipation of mouth alcohol in alcohol positive subjects. J. Forensic Sci. 2012;57(3):802–805. doi: 10.1111/j.1556-4029.2011.02023.x. 1. [DOI] [PubMed] [Google Scholar]
Associated Data
This section collects any data citations, data availability statements, or supplementary materials included in this article.
Data Availability Statement
Data will be made available on request.