

Abstract
The cytokine interleukin-2 (IL-2) has the potential to treat autoimmune disease but is limited by its modest specificity toward immunosuppressive regulatory T (Treg) cells. IL-2 receptors consist of combinations of α, β, and γ chains of variable affinity and cell specificity. Engineering IL-2 to treat autoimmunity has primarily focused on retaining binding to the relatively Treg-selective, high-affinity receptor while reducing binding to the less selective, low-affinity receptor. However, we found that refining the designs to focus on targeting the high-affinity receptor through avidity effects are key to optimizing Treg selectivity. We profiled the dynamics and dose-dependency of signaling responses in primary human immune cells induced by engineered fusions between either wild-type IL-2 or mutant forms with altered affinity, valency, and fusion to the antibody Fc region for stability. Treg selectivity and signaling-response variations were explained by a model of multivalent binding and dimer-enhanced avidity—a combined measure of the strength, number, and conformation of interaction sites—from which we designed tetravalent IL-2–Fc fusions that had greater Treg-selectivity in culture than do current designs. Biasing avidity toward IL2Rα with an asymmetrical multivalent design consisting of one α/β chain-binding and one α chain-binding mutant further enhanced Treg selectivity. Comparative analysis revealed that IL2Rα was the optimal cell-surface target for Treg selectivity, indicating that avidity for IL2Rα may be the optimal route to producing IL-2 variants that selectively target Treg cells.
INTRODUCTION
Cytokines that bind to the common γ-chain (γc) receptor, interleukins 2, 4, 7, 9, 15, and 21 (IL-2, IL-4, and so on), are a critical hub in modulating both innate and adaptive immune responses1. Each cytokine in this family binds to the common γc receptor alongside a private receptor that is specific for each ligand to induce signaling. These cytokines control the activity of both effector and suppressor immune cell populations. For example, IL-2 can increase the effector functions of CD8+ T cells through the induction of cytotoxic protein expression, as well as promote the suppressive capacity of regulatory T (Treg) cells by inducing the expression of suppressive cytokines and checkpoint proteins2–4. Signaling through γc family receptors also commonly results in the proliferation of both suppressor and effector cell types; consequently, the γc cytokines are an important endogenous and exogenous mechanism for altering the balance of immune cell populations. The importance of these cytokines is observed most extremely from loss-of-function or reduced-activity mutations in γc, which subvert T and natural killer (NK) cell maturation5. Disruptive mutations in the private receptors can lead to more selective reductions in cell types, such as Treg cells (Tregs) in the case of IL2Rα or T cells in that of IL7Rα1. Conversely, activating mutations in these receptors can promote cancers such as B and T cell leukemias6.
The γc cytokines have been explored as immunotherapies in a diverse array of disease indications7. The most studied member of the family, IL-2, acts as both as an immunostimulant and immunosuppressant, and has been explored as a treatment for diseases ranging from cancer to autoimmunity8–11. Its ability to expand Treg populations, particularly at low doses, has great promise as an effective treatment for autoimmune diseases such as graft-versus-host disease and hepatitis-induced vasculitis12,13. The efficacy of these IL-2 therapies has been hindered, however, by IL-2’s activation of off-target immune populations, which simultaneously reduce therapeutic efficacy and drive toxicities14. Enabling more selective activation of Tregs is desired to reduce these detrimental effects. However, this goal has remained elusive; effector and suppressor immune populations have only subtly-differing abundances of each IL-2 receptor subunit, and no truly Treg-specific marker has been discovered for targeting purposes15. Reducing IL-2’s affinity for IL2Rβ moderately increases Treg selectivity by increasing IL-2’s reliance on IL2Rα, which is found in greater abundance on Tregs15,16. However, this increase in selectivity comes at the cost of potency, as IL2Rβ is necessary for signal transduction17. Thus, when targeting Tregs, IL-2 therapies have faced a persistent tradeoff between selectivity and potency18.
The challenges involved in engineering cell-selective forms of IL-2 have inspired varied therapeutic designs. As mentioned, the most common approach has been to alter the receptor affinities of IL-2 to weaken its interaction with IL2Rα, IL2Rβ, or both receptors19–23. In most cases, the wild-type cytokine or mutein is fused to an IgG Fc to take advantage of FcRn-mediated recycling to extend drug half-life. Fc fusion has taken many forms, such as fusion to the cytokine at the N- or C-terminus, including one or two cytokines per IgG, and including or excluding Fc effector functions15. Also used have been so-called immunocytokines that bind to IL-2 and block certain receptor interactions in order to bias signaling responses18. Cis-targeted IL-2 fusions, such as bispecific antibodies in which a non-fused Fab binds to CD8, have been designed to deliver cytokines to cytotoxic T cells24. However, it is unclear whether this approach can be applied to targeting Tregs. Other, more diverse IL-2 engineering has also been explored: “orthogonal” IL-2, which only signals through a synthetic receptor, has shown promise for stimulating ex vivo engineered Tregs25; a signaling-deficient IL-2 with high specificity for IL2Rβ and which attenuates graft-versus-host disease by inhibiting effector cells’ IL-2 signaling has been developed26; and lastly, mRNA delivery of a Treg-selective IL-2 mutein has been shown to provide better pharmacokinetics by sustaining low amounts of the cytokine27. These varied approaches demonstrate the complex nature of cytokine engineering necessitating systematic design principals.
Here, we systematically profiled the signaling specificity effects of engineered cytokine alterations, including affinity-altering mutations and Fc-fusion formats, to map the current landscape of cell-selective IL-2 designs. Through this systematic evaluation, we identified Fc fusion valency to be an important factor in cell-type selectivity. The signaling specificity of all muteins and Fc formats quantitatively matches a multivalent binding model, both between cell types and across cell-to-cell variation within a cell type, indicating that the effect of cytokine multivalency is derived from altered surface receptor binding avidity. Using this model, we then identified that cytokines engineered in higher valency formats are predicted to confer greater specificity towards a variety of immune cell types. These insights were experimentally validated by designing and testing two novel tetravalent IL-2 muteins in both symmetric and asymmetric forms which displayed superior Treg signaling selectivity. The performance of asymmetric, tetravalent IL-2 fusion proteins also demonstrates how bitargeting and asymmetry can decouple targeting from signaling, enabling new therapeutic opportunities. In total, our analysis and experimental findings demonstrate that cytokine valency is an unexplored direction for further enhancing selective signaling responses and that many opportunities for using multivalency engineering exist within the γc cytokine family and beyond.
RESULTS
Systematic IL-2 variant profiling reveals multiple determinants of response
To explore how IL-2 mutations affect signaling across immune populations, we stimulated peripheral blood mononuclear cells (PBMCs), collected from a single donor, with 13 IL-2 muteins (Fig. 1, A and B, and table S1). Our panel included several IL-2 muteins previously developed to confer enhanced Treg-selective signaling15,22,23. In addition to changes in receptor affinities, the muteins included some variation in structural features: Fc fusion at either the C- or N-terminus, which has been shown to alter receptor-interaction kinetics15, and fusion to Fc in both monomeric or dimeric formats. We previously profiled six of the eleven IL-2 muteins15; however, we both expanded this previous panel while also adding dimeric Fc fusions, thus greatly expanding the scope of IL-2 engineering approaches surveyed. Our panel includes several muteins previously published or clinically developed for their Treg selectivity—monomeric N88D and dimeric R38Q/H16N were previously developed by Amgen and Otsuka Pharmaceuticals, respectively22. Our panel was also designed to feature IL-2 variants whose affinities for IL2Rα and IL2Rβ span the range of currently available Treg-selective affinity mutants (Fig. 1B).
Fig. 1. Systematically profiling IL-2 muteins reveals determinants of response.

(A) Schematic of affinity and structural mutants explored. (B) IL2Rα and IL2Rβ affinities of each IL-2 variant. For affinity assays, two technical replicates—meaning independent batches of cells from the single donor—were conducted (N=2). (C) Heatmap of phosphorylated STAT5 measurements for each cell type, time point, ligand, and concentration. pSTAT5 measurements are normalized to the maximum pSTAT5 observed in response to WT IL-2 for each cell type. (D to O) STAT5 phosphorylation response curves for immune cells stimulated with select IL-2 muteins. Time points and cell types are indicated in subplot titles. For all signaling assays, PBMCs were collected from one donor, and three technical replicates were conducted on independent days (N=3).
The panel of IL-2 variants was used to stimulate cells from a single donor at four time points using 12 treatment concentrations. The PBMCs were then stained for canonical cell type markers and phosphorylated STAT5, a commonly used read-out of IL-2 signaling response, allowing us to separate signaling response by cell type. Five different cell types—Treg, helper T (Thelper), CD8+, NK, and NK CD56bright (NKbright) cells—were gated and quantified (fig. S1, A to D). Treg and Thelper cells were further dissected into low, average, and high IL2Rα abundance by isolating subpopulations using three logarithmically spaced bins (fig. S1J). For a surface-level visualization of the effects of time, cell type, receptor abundance, ligand format, ligand affinity, and concentration, we organized our signaling data into a heatmap (Fig. 1C). The complexity of the data demanded closer examination.
We selectively highlighted several dose-response curves to demonstrate the importance of our comprehensive characterization (Fig. 1, D to O). First, as expected, we found that the affinity with which each IL-2 interacted with receptors divided responses (Fig. 1, D to G); for example, wild-type (WT) IL-2 most potently activated all cell types, as expected given it bound to IL2Rβ with the greatest affinity (Fig. 1, B and D to G). Valency also had a prominent effect on signaling response; the bivalent Fc fusion form increased sensitivity and potency of response across all cell types.
Temporal dynamics also affected response characteristics (Fig. 1, H to K). For example, we found that C- or N-terminus Fc-fused IL-2 demonstrated distinct responses in Tregs at 1 hour of treatment but shared responses after 4 hours of treatment (Fig. 1, H to K). Temporal effects are likely influenced by receptor-mediated endocytosis of IL-2 receptor subunits and transcriptional changes arising from IL-2 signaling28,29.
Finally, we found that receptor abundance interacted with cell identity to alter response (Fig. 1, L to O). Treg populations with high amounts of IL2Rα strongly responded to monovalent H16N N-term, and the bivalent form moderately enhanced this response. However, in the IL2Rαlo Treg cells, the effect of bivalency was even greater; only bivalent H16N induced a significant response. IL2Rαhigh Thelper cells also showed a moderate increase in potency with bivalency, like the IL2Rαhigh Treg cells, but the IL2Rαlo population showed no distinction between the monovalent and bivalent fusions. Thus, immune populations are further subdivided by receptor abundance into subpopulations with distinct cellular responses.
In total, the dynamics of response, cell type, concentration, ligand affinity, Fc fusion valency, and Fc fusion orientation all play roles in determining cellular response. These determinants interact in unique and often counter to intuition, requiring a more comprehensive accounting of their effects.
Ligand valency and affinity interact to form unique cell type selectivity profiles
Given the coordinated importance of time, ligand valency, ligand affinity, cell type, and receptor expression, we next sought to focus on how ligand format affected Treg selectivity. The selectivity of IL-2 for specific cell types corresponds closely to its therapeutic potency and potential toxicities19,21,22,30. Therefore, we sought to better understand the relationship between Treg selectivity and ligand properties (Fig. 2, A to I). First, we plotted the ratio of STAT5 phosphorylation (fit by a Hill curve) in Tregs to that of off-target cells for each ligand across our concentration range and saw that the shape of each selectivity curve varied substantially for each ligand and off-target cell type that was considered (Fig. 2, A, B, D, F, and H). Treg selectivity quantified against CD8+, NK, or NKbright cells most prominently separated bivalent from monovalent ligands, with bivalent muteins being most selective for Tregs at lower concentrations. The selectivity demonstrated by bivalent muteins at lower doses can also be quantified by observing their lower Treg activation EC50 values and relatively unchanged off-target EC50 values (table S2). Because IL2Rα affinity varied widely between our IL-2 mutants and is a known Treg selectivity regulator, we sought to understand how affinity differences contribute to Treg selectivity. We plotted IL2Rα affinity against the peak Treg selectivity observed across concentrations (Fig. 2, C, E, G, and I). Due to the high abundance of IL2Rα displayed by Tregs (fig. S1I), we expected to see a positive correlation between IL2Rα affinity and peak Treg selectivity. However, we saw that this relationship varied in a cell type- and valency-dependent manner. When considering either CD8+ or NK cells, decreasing IL2Rα affinity led to decreases in the peak Treg selectivity of monovalent muteins but also, somewhat unexpectedly, little relationship with the bivalent selectivity peaks (Fig. 2, C, E, and F). When considering Thelper populations, which have greater amounts of IL2Rα than CD8+ and NK cells, we observed that decreases in IL2Rα affinity led to increases in maximum selectivity for both monovalent and bivalent muteins (Fig. 2I). Expectedly, the mutein concentration at which the maximum Treg selectivity occurred was higher for ligands with weaker IL2Rα affinity across all cell types (fig. S2, A to D). In total, affinity and valency affected the selectivity profiles across ligand doses in distinct yet intertwined manners. To understand these relationships, a method mapping each of these factors simultaneously is needed.
Fig. 2. IL-2 muteins display structural- and affinity-dependent Treg selectivity that cannot be overcome with cis-targeting strategies.

(A) Schematic describing ratio of activation between target and off-target immune populations. (B and C) Ratio of Treg-to-CD8+T cell pSTAT5 dose-response curve at 4 hours (B), and the maximum ratio of signaling (pSTAT5) in Treg cells to off-target cell type versus IL2Rα affinity (C). (D and E) As described in (B and C), respectively, of Treg cells to NK cells (D and E). (F and G) NKbright cells (F and G), and Thelper cells (H and I). The ratio was defined as the ratio of Hill curves fit to experimental data for target and off-target populations shown in Fig. 1. Lines of best fit were separately fit to monovalent (thin) and bivalent (thick). Signaling data in (B to I) was gathered from PBMCs harvested from a single donor, and three technical replicates were conducted (N=3). (J) Schematic depicting how useful markers for conferring selectivity are selected. (K to N) Top sorted Wasserstein distances (k, m) and Kullback-Leibler divergences (l,n) of surface markers (k,l) and RNA data (m,n) in Tregs in the CITE-seq dataset (GSE164378)31.
Tregs have limited opportunities for cis targeting
Whereas IL2Rα is more abundant in Tregs, the difference is subtle compared to that of some off-target cells, making selectively targeted activation more challenging15,18. Consequently, we wondered whether a cis-targeting strategy—in which IL-2 is fused to a domain binding some other Treg-specific surface marker—would provide even greater selectivity. To explore this possibility, we used a CITE-seq data set in which >211,000 human PBMCs were simultaneously analyzed for 228 surface markers coupled with single-cell RNA-seq (GSE164378)31. Our previous work shows that specificity is conferred by markers expressed at a high ratio between target and off-target cells (Fig. 2J)32. As a measure of difference, we calculated the Wasserstein distance and Kullback-Leibler divergence of each surface marker abundance and expression between Treg populations and all off-target PBMCs. These complimentary distance metrics were chosen to reflect two different measures of difference: the Wasserstein distance is maximized when transforming one distribution to another would require changing the cells to a large degree, whereas the Kullback-Leibler distance is maximized when the overlap between two distributions is minimized. We were surprised to find that IL2Rα was the most differentiating and unique marker on Tregs by both proteomic and transcriptomic analysis (Fig. 2, K to N). These results were reinforced by using both a linear and non-linear classifier to identify which surface markers and transcripts were most informative for Treg classification; this analysis again found that IL2Rα was optimal (fig. S3, A to D). Consequently, binding alternative surface markers would not improve IL-2 Treg selectivity.
Bivalent Fc-cytokine fusions have distinct cell specificity but shared dynamics
Understanding that selectivity for Tregs must be derived through engineering binding to the IL-2 receptors, we sought to develop a more complete view of the various structural choices for IL-2 fusion design. Exploring variation in response across cell types and ligand treatments is challenging due to its multidimensional nature. Restricting ones’ view to a single time point, cell type, or ligand concentration provides only a slice of the picture (Figs. 1 and 2)15,33. Dimensionality reduction is a generally effective tool for exploring multidimensional data. However, flattening our signaling data to two dimensions and using principal components analysis failed to help isolate the effects of concentration, ligand properties, time, and cell type (Fig. 3A). Therefore, to better resolve our data, we organized our profiling experiments into a four-dimensional tensor organized according to the ligand used, concentration, treatment duration, and cell type in the profiling. We then factored this data using non-negative canonical polyadic (CP) decomposition, a technique that represents n-dimensional tensors as additively separable patterns, themselves approximated by the outer product of dimension-specific vectors34. We used CP decomposition to derive factors summarizing the influence of each dimension (Fig. 3B). Three components explained roughly 90% of the variance within the dataset (Fig. 3C).
Fig. 3. Tensor-based decomposition reveals unique selectivity defined by fusion valency.
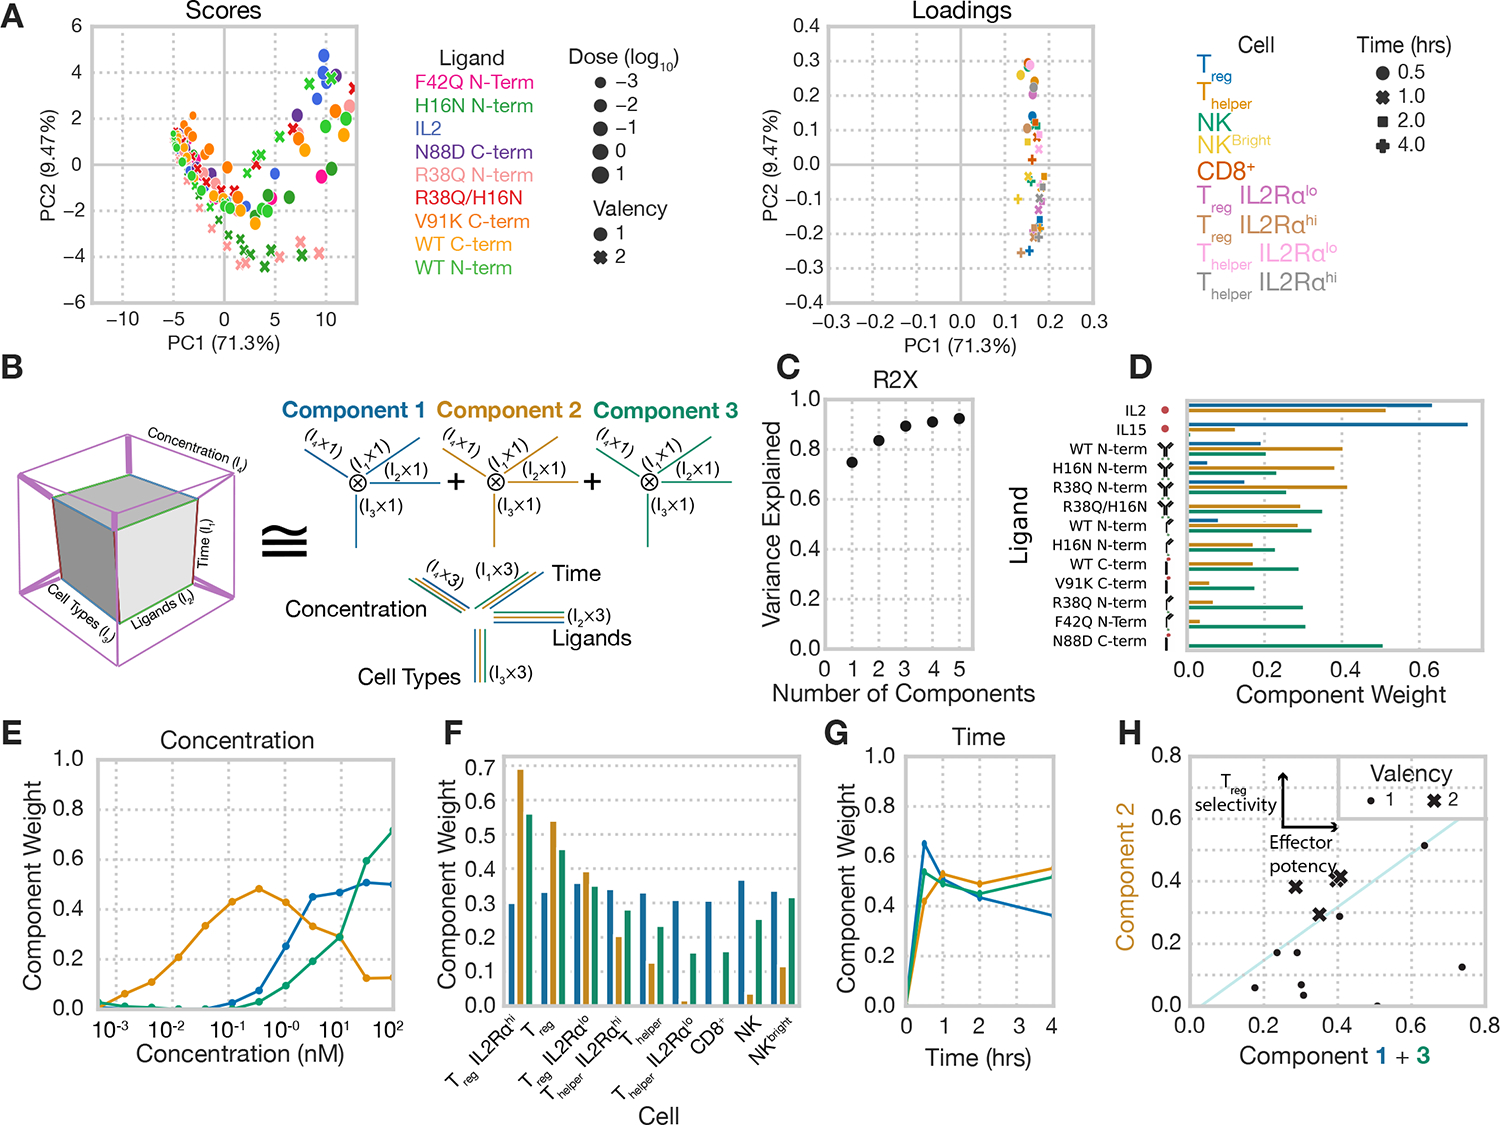
(A) Principal components analysis scores (left) and loadings (right) of pSTAT5 signaling data. Signaling data was gathered from PBMCs harvested from a single donor, and three technical replicates were conducted (N=3). Principal component decomposition was performed on signaling data arranged in matrix form, where each dose and ligand combination is included as a row, and each cell and time combination is included as a column. (B) Schematic representation of non-negative canonical polyadic (CP) decomposition. Experimental pSTAT5 measurements are arranged in a tensor according to the duration of treatment, ligand used, cytokine concentration, and cell type. CP decomposition then helps to identify and visualize patterns across these dimensions. (C) Percent variance reconstructed (R2X) of the signaling dataset versus the number of components used during CP decomposition. (D) Component weights for each IL-2 mutant resulting from CP decomposition of the signaling dataset. (E) Component weights representing the effect of IL-2 concentration resulting from CP decomposition of the signaling dataset. (F) Component weights representing cell type specificity resulting from CP decomposition of the signaling dataset. (G) Component weights for the effect of treatment duration resulting from CP decomposition of the signaling dataset. (H) Sum of component 1 and 3 weights (off-target signaling) versus component 2 (Treg signaling) weight for each monovalent and bivalent ligand. Thin line is included for visualization purposes only.
Factorization separated distinct response profiles into separate components, and the effect of each dimension (such as time or concentration) into separate factors. For instance, component 1 almost exclusively represented responses to wild-type cytokines (Fig. 3D), the only ligands which were not Fc-fused, showing a distinct response primarily at high concentrations (Fig. 3E), with broad specificity (Fig. 3F) and a signaling profile peaking at 30 minutes and then more rapidly decreasing (Fig. 3G). An alternative way to interpret the factorization results is to compare profiles within a single factor. For example, component 1 led to a less sustained profile of signaling response as compared to the other signaling patterns (Fig. 3G).
Notably, components 2 and 3 cleanly separated ligands conjugated in bivalent or monovalent forms, respectively (Fig. 3D and H). In fact, ligand valency was represented more prominently than differences in receptor affinity between muteins. Component 2 had uniquely high Treg specificity (Fig. 3F) most represented at intermediate concentrations (Fig. 3E). Component 2 was also highly correlated with IL2Rα abundance in subsets of Treg and Thelper cells, suggesting that the bivalent molecules’ specificity for Tregs is mediated by their higher abundance of IL2Rα. Component 3 had a broader cell response (Fig. 3F) and increased monotonically with concentration (Fig. 3E). Despite these strong differences in specificities, both components had nearly identical time dynamics (Fig. 3G). While other ligand variation influenced the potency and selectivity of each ligand, only the bivalent Fc fusions, regardless of their receptor affinities, more highly weighted the Treg-selective component 2 over components 1 and 3, which represented effector cell response (Fig. 3H). In total, these results indicated that mono- and multivalent cytokines shared identical dynamics and that, although Fc fusion and affinity modulation affect response, ligand valency was a critical and prominent determinant of specificity.
Variation in IL-2 responses is explained by a simple multivalent binding model
Having observed that Treg selectivity is prominently enhanced by multivalency, we sought to determine whether cell surface binding on its own could explain these selectivity differences. To do so, we applied a two-step, equilibrium, multivalent binding model to predict IL-2 response, assuming that signaling response was proportional to the amount of active receptor-ligand complexes (Fig. 4A)35. Within the model, ligand binding first occurs with kinetics equivalent to the single binding site, and then subsequent interactions occur proportionally to affinity, adjusted by , a cross-lining constant that corrects for differences between monovalent and multivalent interactions. We fit this model to our signaling experiments and evaluated its concordance with the data. The model is very simple, with the cross-linking parameter being the only non-scaling fit parameter; this parameter had an optimum at 1.2 × 10⁻¹¹ #/cell, consistent with that seen for other receptor families36–38. Overall, we observed remarkable consistency between predicted and observed responses (R2 = 0.85; fig. S4), and accuracy was maintained when examining data subsets, including individual cell types and ligands (Fig. 4, B and C).
Fig. 4. Responses are predicted by a simple multivalent binding model.
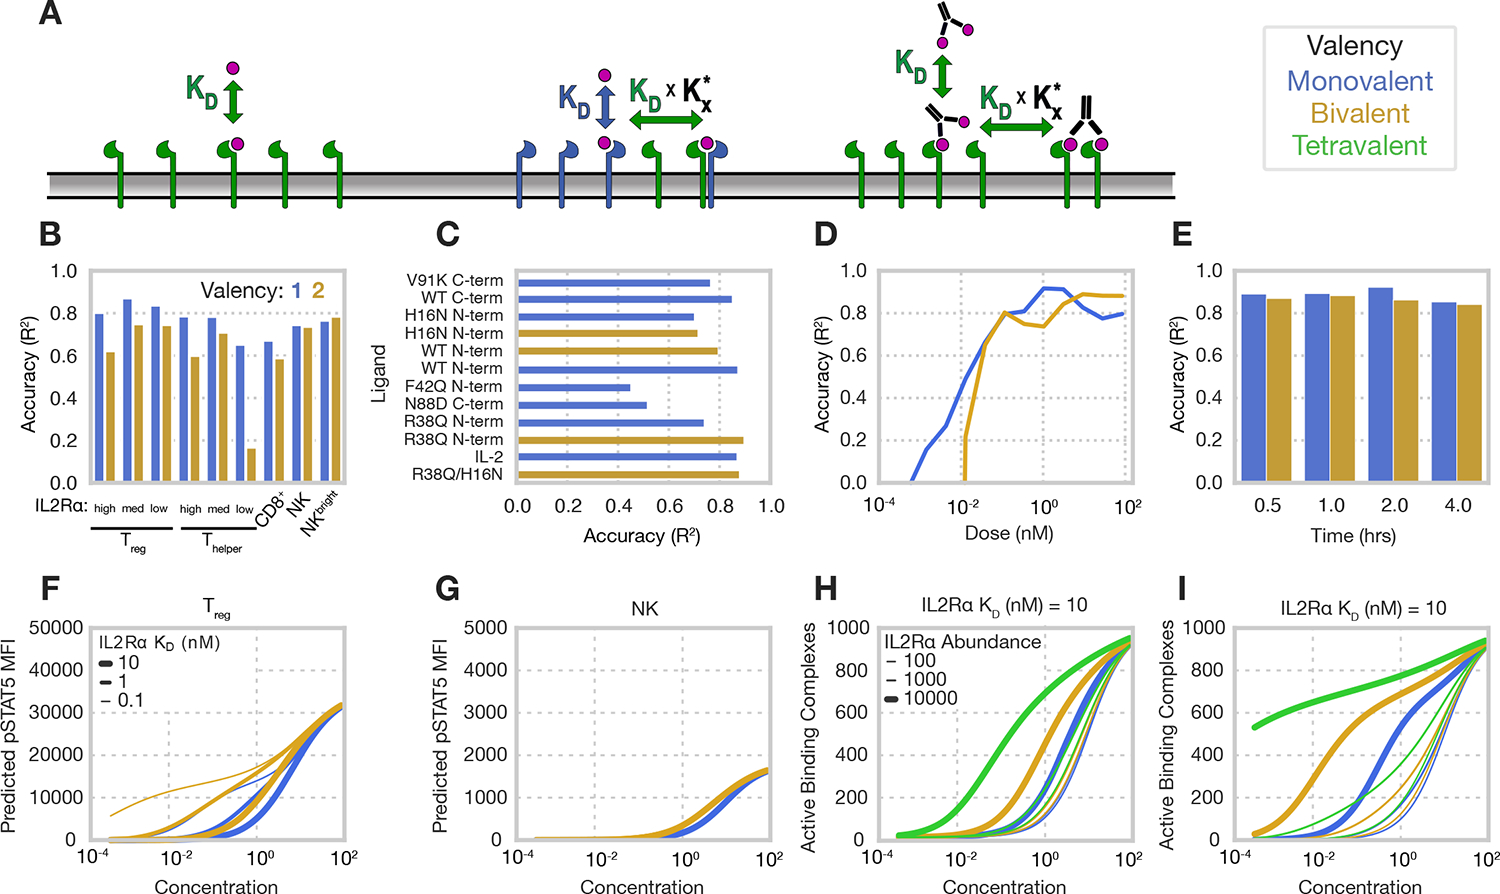
(A) Schematic of the model. Initial association of multivalent ligands proceeds according to monovalent affinity, and subsequent binding events proceed with that affinity scaled by the parameter. Model was fit to the signaling data gathered from PBMCs harvested from a single donor, and three technical replicates were conducted (N=3). Receptor counts used in model simulations for each cell population were measured in PBMCs gathered from a single donor, and four technical replicates were performed (N=4). (B and C) Model’s accuracy subset by cell type (B) and ligand (C) for all monovalent and bivalent IL-2 muteins. (D and E) Model’s accuracy subset by concentration (D) for all ligands and time (E) for all ligands, concentrations, and cell types. All accuracies (B to E) are calculated as a Pearson’s correlation R2 score for experimental cytokine responses at 30 mins and 1 hour. (F and G) Model-predicted pSTAT for Tregs (F) and NK cells (G) in response to mono- and bivalent IL-2 ligands with 10 nM IL2Rβ KD. (H and I) Predicted number of active signaling complexes (proportional to predicted pSTAT5) formed on cells with 1000 IL2Rβ receptors and varying numbers of IL2Rα for ligands with affinities of 10 nM KD for IL2Rβ and either 1 nM (f) or 10 nM (i) KD for IL2Rα.
To ensure that our model was not simply capturing a trend towards higher signaling with increasing concentration, we examined our model’s accuracy within each concentration (Fig. 4D). Our model did not predict response at the lowest concentrations as there was little to no response in the data itself but increased in accuracy at concentrations where responses were observed. Finally, we examined how the model’s accuracy varied within each timepoint (Fig. 4E); each was predicted with consistent accuracy. Some decrease in model accuracy would be expected, given that longer treatments likely involve various compensatory mechanisms such as the degradation or increased transcription of IL-2 receptor subunits29,39. In total, multivalent cell surface binding showed quantitative agreement with the pattern of cell-type-specific responses to IL-2 muteins, supporting that the specificity enhancement of bivalency is derived from receptor avidity effects and is explained by a simple model of cell surface binding.
Upon finding that our model was broadly predictive of cell-type specific signaling responses, we sought to use our model to understand and visualize how valency and affinity interact to determine Treg selectivity. Here, our model showed that Treg response is strongly governed by IL2Rα affinities and that these effects have an exceptionally strong relationship with valency, particularly at intermediate cytokine doses, while NK signaling barely varied across ligands of varying affinities (Fig. 4, F and G). We then used the model to explore how receptor abundance affects multivalent ligand binding (Fig. 4, H and I). Here, theoretical cell populations expressing 104 IL2Rα and 103 IL2Rβ molecules varied widely in their response to multivalent IL-2 muteins (Fig. 4H), while cells expressing very few IL2Rα receptors and the same abundance of IL2Rβ barely varied in their response (Fig. 4I). Therefore, we concluded that multivalent cytokines with high IL2Rα affinities uniquely and selectively target Tregs through IL2Rα-mediated avidity effects.
Multivalency provides a general strategy for enhanced signaling selectivity and guides the development of superior IL-2 muteins
Given that a simple binding model accurately predicted cell type-specific responses to IL-2 and that bivalent, Fc-fused IL-2 muteins have favorable specificity properties, we computationally explored to what extent multivalency might be a generally useful strategy. While monovalent ligand binding scales linearly with receptor abundance, multivalent ligands bind nonlinearly depending upon receptor abundance40. Thus, multivalent ligands should be able to selectively target cells with uniquely high expression of certain γc family receptors.
Valency enhancements are only apparent with coordinated changes in receptor-ligand binding affinities32. Therefore, we optimized the receptor affinities of simulated ligands while varying valency. We first designed IL-2 muteins of varying valency to obtain optimal Treg specificity (Fig. 5A). As expected, ligand valency increased achievable selectivity past that possible using a monovalent cytokine format at any receptor affinities. Muteins of higher valency required reduced IL2Rα affinity to achieve optimal Treg selectivity (Fig. 5B). We then explored whether IL-2 muteins lacking IL2Rα binding could selectively target NK cells, based on their uniquely high expression of IL2Rβ15, with similar results; IL-2 muteins of higher valency were predicted to be increasingly selective for activation of NK cells, so long as IL2Rβ/γc affinity was coordinately decreased (Fig. 5, C and D). Finally, we explored whether multivalent IL-7 could be used to target Thelpers, as they express high amounts of IL7Rα (fig. S1I). We again found that ligands of higher valency should achieve higher selectivity for these cells, but that the benefits of valency were less than the targeting of Tregs or NK cells using IL-2 mutants because CD8+ T cells have similar IL7Rα amounts (Fig. 5E). These benefits were again contingent on decreasing IL7Rα affinity at higher valency (Fig. 5F).
Fig. 5. Multivalency enhances the selectivity of cytokine fusion proteins.

(A and B) Predicted signaling response of Treg cells in response to a ligand of optimal selectivity at different valencies (A), and optimal receptor-ligand dissociation constants for ligand optimized for selectivity (B). Response predictions were normalized to each population’s response for the monovalent case. (C and D) As described in (A and B), respectively, of NK cells (C and D). (E and F) As described in (A and B), respectively, of Thelper cells (E and F). Selectivity for Treg and NK cells were derived from IL-2 muteins, and selectivity for Thelpers was calculated using IL-7 muteins. During affinity optimization (B, D, and F), mutein affinity for IL2Rα and IL2Rβ/γc was allowed to vary for IL-2 muteins, and affinity for IL7Rα was allowed to vary for IL-7 muteins. Affinities were allowed to vary across KDs of 10 pM–1 μM while was fixed at its fitting optimum. All optimizations were performed using a concentration of 1 nM. Selectivity was calculated as the ratio of predicted pSTAT5 in target cells to the mean pSTAT5 predicted in off-target cells. Receptor counts used in model simulations for each cell population were measured in PBMCs gathered from a single donor, and four technical replicates were performed (N=4). (G) Schematic of multivalent IL-2 mutant design. (H to K) Ratio of STAT5 phosphorylation in Tregs to Thelpers (H), NK cells (I), NKbright (J), and CD8+ (K) cells at varying dosages for R38Q/H16N in various valency formats. Dots are representative of mean of biological replicates. Responses in PBMCs from 5 donors were included, and two experimental replicates were conducted for each donor (N=5). Statistical significance was determined by comparing the ratios achieved by tetravalent R38Q/H16N to bivalent R38Q/H16N using a Student’s t-test. Full ratio plots including experimental error are shown in figure S7.
To experimentally show that muteins of higher valency could be engineered to increase Treg selectivity, we expressed and purified Fc fusions of R38Q/H16N IL-2 in monovalent, bivalent, and tetravalent formats (fig. S6). PBMCs from five donors were used to account for patient-to-patient variability. Tetravalent IL-2 was designed by Fc-fusing IL-2 muteins at both the C- and N-terminus and allowing the Fc to dimerize (Fig. 5G). The harvested cells were stimulated for 30 minutes and stained for cell type markers as well as pSTAT5. R38Q/H16N was selected as the mutant closest to optimal binding affinities in tetravalent form, though further optimization is possible (Figs. 1B and 5B). As predicted, valency increased the responsiveness of both Tregs and off-target immune cells at each concentration (fig. S7, A to E). However, the Treg response increase far exceeded that in off-target cells; consequently, tetravalent R38Q/H16N was able to achieve much greater Treg selectivity than bivalent and monovalent formats—two IL-2 fusions with near-optimal selectivity in our initial panel (Fig. 5, H to K).
In total, these results show that valency beyond bivalency has unexplored potential for engineered cytokines with enhanced therapeutic potency and reduced toxicity. Critically, our tetravalent R38Q/H16N far outperformed its lower valency counterparts that already represented state-of-the-art selectivity. These results demonstrate that multivalent complexes can achieve selective cytokine signaling in Tregs beyond what is achievable with only changes to receptor affinity. They also show the benefit of mechanistic modeling to guide ligand design, particularly when ligand affinity must be considered together with other parameters such as valency.
Bitargeted IL-2–Fc fusions demonstrate even greater Treg selectivity
Through the CITE-seq data analysis, we found that IL2Rα was the optimal surface target for Treg selectivity (Fig. 2, I to M). This result was further strengthened when we integrated these data with our binding model and ligand optimization approach. We used the model to consider whether WT IL-2 fused to a selective binder for any surface markers could increase Treg selectivity. WT IL-2 fusion to an IL2Rα binder was predicted to enhance Treg selectivity over off-target immune cells (Fig. 6, A and B). This was initially surprising because IL-2 itself binds IL2Rα, but indicated to us that multivalent complexes provide the potential opportunity to decouple Treg selectivity (by binding IL2Rα) from cytokine potency.
Fig. 6. Asymmetric IL-2 mutants display even greater Treg selectivity.

(A and B) Predicted enhancements to Treg selectivity for IL-2 muteins including a separate targeting domain as calculated using CITE-seq surface marker data (A) or surface expressed RNA transcripts (B). Selectivity was calculated for Tregs against all other PBMC cells as the increase in average Treg to off-target cell binding against WT IL-2 at a simulated concentration of 0.1 nM. Model predicted signaling was predicted on a single-cell basis for cells within the CITE-seq dataset. (C) Schematic of asymmetric IL-2 mutant design. (D) Predicted normalized Treg selectivity displayed by bivalent WT IL-2, IL2Ra biased IL-2 (IL2Rα affinity of R38Q/H16N), and Bitargeted IL-2 across IL2Rβ affinities. (E to G) Ratio of STAT5 phosphorylation in Tregs to Thelper (E), NK (F), NKbright (G) and CD8+ (H) cells at varying concentrations for R38Q/H16N in various valency formats. Dots are representative of mean of experimental replicates. Responses in PBMCs from 5 donors were included, and two experimental replicates were conducted for each donor. Statistical significance was determined by comparing the ratios achieved by bivalent bitargeted to bivalent R38Q/H16N using a Student’s t-test. Full ratio plots including experimental error are shown in figure S8. (I to L) Tensor factorization of the signaling responses to R38Q/H16N and bitargeted variants. Experimental pSTAT5 measurements are arranged in a tensor according to the duration of treatment, ligand used, cytokine concentration, and cell type. The results of decomposition of this tensor are shown as percent variance reconstructed (R2X) versus the number of components used (I), component values representing cell type specificity (J), component values for each IL-2 mutant (K), and component values representing the effect of concentration (L).
To decouple cell-selective binding from signaling response, we expressed an asymmetric Fc fusion including both a signaling-competent R38Q/H16N IL-2 and signaling-deficient V91K/D20A/M104V IL-2 with only IL2Rα binding (Fig. 6C and fig. S6). V91K/D20A/M104V IL-2 is reported to effectively eliminate IL2Rβ binding while maintaining IL2Rα interaction23. We henceforth refer to this asymmetric construct as “bitargeted” IL-2 to reflect the inclusion of two IL-2 muteins with separate signaling and targeting roles. To ensure homogeneity of signaling and non-signaling IL-2, bivalent bitargeted ligand was designed by introducing Fc mutations preventing Fc dimerization (Fig. 6C). Tetravalent bitargeted constructs were predicted to have greater Treg specificity than their non-bitargeted counterparts for any IL2Rβ affinity, using either the IL2Rα affinity of WT or R38Q/H16N (Fig. 6D). We tested our bivalent and tetravalent bitargeted constructs by again stimulating PBMCs gathered from five donors and quantifying their pSTAT5 responses. Both bivalent and tetravalent bitargeted ligand increased or maintained high potency in Treg cells (fig. S8, A to E). This potency translated to greater Treg selectivity for both bivalent and tetravalent bitargeted forms, both of which outperformed any previously characterized monovalent and bivalent IL-2 fusions, and modestly outperformed tetravalent R38Q/H16N (Fig. 6, E to H).
Though both our tetravalent R38Q/H16N molecules and bitargeted constructs were able to target Tregs with superior selectivity with respect to Thelper, NK, NKbright, and CD8+ cells, principally through the targeting of IL2Rα, we considered whether our molecule could also select for Tregs with respect to type 2 innate lymphoid cells (ILC2s). ILC2s are able to secrete large quantities of inflammatory cytokines such as IL-5 and IL-13, are known to respond to IL-2 through expression of IL2Rα, and have been implicated as a potential source of eosinophilia in low-dose IL-2 therapy. We quantified the abundance of IL2Rα on ILC2s and Tregs from four donors and found that both populations expressed nearly identical levels of the receptor (fig. S9H). Thus, neither our nor any other existing approaches for targeting Tregs through the IL-2 receptors themselves offer superior selectivity against ILC2s.
We again applied non-negative CP decomposition of the R38Q/H16N and bitargeted ligand signaling responses to summarize our ligand engineering efforts (Fig. 6, I to L). Three components captured >90% of the variation in the data. Here, Treg responses were primarily represented by component 2, Teff cell responses by component 1, and NK cell responses by component 3 (Fig. 6J). Valency again determined ligand component 2 weight most potently, with both tetravalent constructs, bitargeted or R38Q/H16N, demonstrating highest component 2 weight. However, whereas the bivalent bitargeted construct demonstrated no NK cell activity (component 3), both tetravalent constructs had some NK activity (Fig. 6K). Thus, our experimental results demonstrate that tradeoffs still exist between Treg potency and selectivity. As before, Treg selectivity was maximized at low and intermediate dosages (Fig. 6L). Despite these tradeoffs, the selectivity demonstrated by both model-guided “cis”-targeting or higher valency fusion formats greatly improved upon the selectivity possible with existing approaches.
DISCUSSION
Here, we systematically explored how ligand properties determine signaling response and specificity across 13 engineered IL-2 variants. Our study included clinically relevant muteins alongside variation in Fc fusion format. Dimensionality reduction in tensor form identified how ligand properties alter response, revealing that multivalent cytokines have unique specificity advantages. Using a multivalent binding model, we uncovered that this unique specificity arises from surface binding avidity effects. Both our analysis using this model and experimental validation indicated that modulating the valency of cytokines may offer Treg selectivity far beyond that achievable through affinity modulation alone (Fig. 5), and we demonstrated this strategy experimentally by expressing tetravalent IL-2 fusions with greater Treg selectivity than current state-of-the-art monovalent or bivalent affinity muteins. Finally, we uncovered that IL2Rα itself is the optimal target for designing Treg-selective binding, and that cis-targeting can be designed into multivalent IL-2 fusions through asymmetric tetravalent IL-2 fusions, again improving on signaling selectivity (Fig. 6). In total, our results show that not only do multivalency and cis targeting of IL2Rα improve Treg selectivity, but that these paired strategies represent the only known method for overcoming the selectivity-potency tradeoff faced by Treg-selective muteins18.
Our results have clear implications for the design of Treg-directed IL-2 therapies, an area of enormous interest for the treatment and management of autoimmune diseases22,41. We showed computationally and experimentally that multivalency and bitargeting can enhance IL-2 Treg selectivity for potential use in clinical settings, where IL-2 based therapies have traditionally struggled42. Engineering valency requires precise compensatory adjustments in the ligand affinity; given that we limited our experiments to pre-existing muteins, we expect that our selectivity gains might be improved even further by identifying muteins with optimal affinities. Various Treg selective affinity mutants continue to be published and many previously developed affinity mutants were not included in our analysis—as we have shown, paired affinity and valency engineering confers selectivity beyond what is achievable in monovalent formats of any affinity; we believe the approach here will synergize with the continued development of affinity variants20,27. Our multivalent and bitargeted designs will additionally need to be tested in vivo to see that these selectivity gains translate to the in vivo setting23. In the majority of previous studies, the selectivity with which pSTAT5 activity is induced in Tregs has consistently translated to selective expansion of Tregs in in vivo, and thus we are confident that our mutein’s heightened selectivity will translate to such settings18,21,23,27,43. Treg selectivity is central to the mechanism of action for these therapies, and so we expect that these benefits to selectivity will improve therapeutic properties in several ways: more potent activation of signaling in Tregs without off-target effects may improve the potency of these therapies and the breadth of applications18,25,44; reduced toxicity may allow for more routine use with minimal patient monitoring14. The superior selectivity offered by engineered multivalent ligands will likely further increase their in vivo pharmacokinetic lifetimes, in turn requiring less frequent dosing, as most drug clearance occurs via receptor-mediated endocytosis in off-target populations21,27,45,46. However, known differences exist in IL-2 receptor expression between humans and mice, so we do not expect that results from murine models would be a reliable indication for the comparative advantages of these molecules15,16, and primate studies are outside the scope of the present work.
Heterospecificity, in our case exploited through bitargeting, opens a whole range of new possibilities through its ability to decouple the targeting and signaling properties of cytokine therapy and/or combine synergistic signals. This capability has been demonstrated through bispecific antibodies previously, and through the design of cis-targeted cytokine-antibody fusions. However, we showed that, unlike other immune cells, Tregs do not express any surface marker more selective than IL2Rα (Fig. 2, I to L). Consequently, there are no alternative targeting options to our approach of using the IL-2 receptors themselves (Fig. 6). Beyond our results, heterospecificity creates opportunities for synergistic receptor agonism. For example, PD-1 cis-targeting with IL-2 increases the stemness of CD8+ T cells and consequently their tumor killing capacity47,48. Although IL-2 has been used as a therapy because of its relative Treg selectivity, there is no reason to believe that the cytokine’s signaling effects are optimal for enhancing Treg cells’ suppressive activities. In fact, with cell therapies, where selectivity is not a concern and non-natural cytokine receptors can be introduced, other cytokine signaling such as IL-9 is qualitatively more effective than IL-2 at promoting cytotoxic T cell function49,50. Thus, one possibility enabled by bitargeting is potentially plug-and-play combinations of one or more cytokines that are more capable than IL-2 of driving desirable Treg properties, made Treg-selective through their fusion to multivalent IL2Rα-targeting complexes51–53. More systems-level research into the signaling regulation of Treg proliferation and suppressive activities, and comparisons to other cytokines beyond IL-2, is needed to develop these possibilities. Such studies, which will be used to not only identify the optimal signal using functional suppressive assays, but also to further improve the selectivity with which that signal is delivered, will justify the translation of such fusion proteins into in vivo disease model studies.
Most generally, our results demonstrate the value of computationally directed biologics design, particularly for fusion constructs incorporating more than one binding moiety. The design of these modular ligands leads to a combinatorial explosion of ligand configurations54. Furthermore, multivalent ligands have several documented effects, including altered signal transduction55,56, binding avidity, pharmacokinetics57, and intracellular trafficking58. While valency has been extensively applied as a means to introduce binding selectivity based on receptor density59,60, multiple receptors, ligands subunits with varied targeting, and differences in signaling effects lead to additional complexity. For instance, while we found that the contribution of multivalency was explained primarily through avidity effects, bitargeting as a strategy arises through differences in the signaling capacity of IL2Rα versus IL2Rβ. The approach here—computationally designed, multivalent, bitargeted ligands for enhanced therapeutic selectivity—has widespread application to other receptor-ligand pathways, including IL-4/IL-13, bone morphogenic proteins, and the TNF cytokines54,61,62. There are likely still other design strategies to be found across these many signaling pathway structures.
MATERIALS AND METHODS
EXPERIMENTAL METHODS
Receptor abundance quantitation, octet binding assays, expression of recombinant bivalent and monovalent IL-2 muteins (Figs. 1–4), and measurement of those muteins’ signaling in PBMCs were performed as described in Farhat et al.15.
Receptor abundance quantitation
Receptor quantitation data was gathered as described previously in Farhat et al.15; the preprocessing of fluorescence measurements, population gating, and receptor abundance calculations were performed using these data. To quantify the number of antibodies bound to cells and to standard beads, the fluorescence intensity of isotype controls was subtracted from the signal from matched receptor stains and then calibrated using the two lowest quantitation standards. Cell gating was conducted as shown in fig. S1, A to H. The geometric means of replicates were calculated to summarize the results.
pSTAT5-based measurement of IL-2 and IL-15 signaling in PBMCs
Cryopreserved PBMCs (ATCC, PCS-800–011, Lot #81115172) were thawed to room temperature and slowly diluted with 9 mL pre-warmed RPMI-1640 (Corning, 10040CV) supplemented with 10% FBS (VWR, 97068–091, lot#029K20) and Penicillin/Streptomycin (Gibco, 15140122). Media was removed, and cells were brought to 3×10⁶ cells/mL, distributed at 300,000 cells per well in a 96-well V-bottom plate, and allowed to recover 2 hrs at 37℃ in an incubator at 5% CO2. IL-2 (R&D Systems, 202-IL-010) or IL-15 (R&D Systems, 247-ILB-025) were diluted in RPMI-1640 in the absence of FBS. These dilutions were then added to the concentrations indicated. To quantify STAT5 phosphorylation, the media was taken away, and cells were fixed using 100 μL of 10% formalin (Fisher Scientific, SF100–4) for 15 mins at room temperature. Formalin was removed from the cells, and the PBMCs were placed on ice. They were then suspended in 50 μL of cold methanol (−30°C). PBMCs were then kept at −30°C overnight. PBSA was used to wash the cells twice. The cells were then split into two identical plates and stained with fluorescent antibodies for 1 hr at room temperature in darkness using 50 μL of antibody panels 4 and 5 per well. Cells were suspended in 100 μL PBSA per well, and beads to 50 μL, and analyzed on an IntelliCyt iQue Screener PLUS with VBR configuration (Sartorius) using a sip time of 35 secs and beads 30 secs. Compensation of measured fluorescent values was calculated as detailed above. Gating of cell populations was performed as shown in fig. S1, and the median pSTAT5 level was calculated for each population in each well.
Recombinant proteins
The Expi293 expression system was used to express IL-2/Fc fusion proteins. Expression was conducted as prescribed by the manufacturer instructions (Thermo Scientific). Proteins were formulated as the Fc of human IgG1 fused at its N- or C-terminus to human IL-2 using a (G4S)4 linker. C-terminal lysine residues of human IgG1 were not included in C-terminal fusions. The AviTag sequence GLNDIFEAQKIEWHE was added to the Fc terminus which did not contain IL-2. Fc mutations which prevented dimerization were introduced into the Fc sequence for monovalent muteins63. MabSelect resin (GE Healthcare) was used to purify protein. Biotinylation of proteins was conducted using BirA enzyme (BPS Biosciences) according to manufacturer instructions. Extensive buffer-exchanging into phosphate buffered saline (PBS) was conducted using Amicon 10 kDa spin concentrators (EMD Millipore). The sequence which was used to express the IL2Rβ/γ Fc heterodimer was the same as that of a reported, active heterodimeric molecule (patent application US20150218260A1); a (G4S)2 linker was added between the Fc portion and each receptor ectodomain. The Expi293 system was used to express the protein, which was subsequently purified on MabSelect resin as above. The IL2Rα ectodomain was generated to include a C-terminal 6xHis tag and then purified on Nickel-NTA spin columns (Qiagen) according to manufacturer instructions.
pSTAT5-based measurement of tetravalent IL-2 signaling in PBMCs
Cryopreserved PBMCs (UCLA Virology Core, sex of donors unknown) were thawed to room temperature and slowly diluted with 9 mL pre-warmed RPMI-1640 (Corning, 10040CV) supplemented with 10% FBS (VWR, 97068–091, lot#029K20) and Penicillin/Streptomycin (Gibco, 15140122). Media was removed, and cells were brought to 3×10⁶ cells/mL, distributed at 300,000 cells per well in a 96-well V-bottom plate, and allowed to recover 2 hrs at 37°C in an incubator at 5% CO2. IL-2 (Peprotech, 200–02-50μg) and tetravalent IL-2 (expressed and purified as described below) were diluted in RPMI-1640 without FBS and added to the indicated concentrations. Cells were stained with antibodies from panel 1 described below. To measure pSTAT5, media was removed, and cells fixed in 100 μL of 4% paraformaldehyde (PFA, Election Microscopy Sciences, 15714) diluted in PBS for 15 mins at room temperature.
PFA was removed, cells were gently suspended in 100 μL of cold methanol (−30°C). Cells were stored overnight at −30°C, and then washed twice with 0.1% bovine serum albumin (BSA, Sigma-Aldrich, B4287–25G) in PBS (PBSA), and stained 1 hr at room temperature in darkness using antibody panel X with 40 μL per well. Cells were then washed twice with 0.1% PBSA and resuspended in 150 μL PBSA per well. Cells were analyzed on a BD FACSCelesta flow cytometer. Populations were gated (as shown in fig. S1, A to H), and the median pSTAT5 level was extracted for each population in each well. Wells with fewer than 1000 cells were excluded from analysis (resulted in removal of 6 wells over 5 experimental replicates.
Tetravalent IL-2 expression
Proteins were expressed as human IgG1 Fc-fused at the N- or C- terminus to mutant human IL-2 through a flexible (G4S)4 linker. C-terminal fusions omitted the C-terminal lysine residue of human IgG1. In monovalent R38Q/H16N variants, Fc mutations to prevent dimerization were introduced into the Fc sequence. In R38Q/H16N variants, each IL-2 fused via the 20 amino acid long linker to the Fc domain contained R38Q and H16N mutations to reduce the IL-2’s affinity with which it binds IL2Rβ. In bitargeted variants, one IL-2 included R38Q/H16N mutations, and the other IL-2 fused to the Fc domain included V91K/D20A/M104V mutations to ablate binding to IL2Rβ. In bivalent bitargeted IL-2, Fc mutations were included to prevent Fc dimerization. Plasmid DNA prepared by maxi-prep (Qiagen, 12162) were transfected into adherent HEK293T cells using Lipofectamine 3000 (Thermo-Fisher, L3000008) in 15 cm dishes in DMEM (Corning, 15017CV) supplemented with GlutaMax (Gibco, 35050061) and 10% FBS. Media was exchanged after 24 hrs with fresh DMEM supplemented with GlutaMax and 5% ultra-low IgG FBS (Thermo-Fisher, A3381901). Media was harvested after an additional 72 hrs. Media was incubated in the presence of Protein A/G Plus Agarose resin (Santa Cruz Biotechnology, sc-2003) overnight. The following day, the media-resin mixture was centrifuged, and the supernatant discarded. Resin was washed with PBS five times or until protein was no longer detected in supernatant by UV-Vis using a NanoDrop One Spectrophotometer (Thermo-Fisher, ND-ONE-W). IL-2 was eluted from resin using 0.1M glycine, pH 2.3, into 2M Tris-HCl, pH 8. IL-2 was then buffer exchanged into PBS for storage at −80°C. Concentration was determined by BCA assay and confirmed using an IgG1 ELISA.
Octet binding assays
An Octet RED384 (ForteBio) was used to measure the binding affinity of each IL-2 mutein. Monomeric, biotintylated IL-2/Fc fusion proteins were loaded to Streptavidin biosensors (ForteBio) at roughly 10% of saturation point and allowed to equilibrate for 10 min in PBS + 0.1% bovine serum albumin (BSA). Up to 40 min of association time in IL2Rβ/γ titrated in 2x steps from 400 nM to 6.25 nM, or IL2Rα from 25 nM to 20 pM, which was followed by dissociation in PBS + 0.1% BSA. A zero-concentration sample was included in each measurement and served as a negative control/reference signal. The affinity quantification experiments were performed in quadruplicate across two days. Binding of IL-2 to IL2Rα on its own did not fit to a simple binding model; KD was calculated using equilibrium binding within each assay for this case. IL2Rβ/γ binding data fit a 1:1 binding model; thus, in these cases on-rate (kon), off-rate (koff) and KD were determined by fitting to the entire binding curve. The average of each kinetic parameter across all concentrations with detectable binding (typically 12.5 nM and above) was used to calculate KD.
CD25 measurement in Tregs and ILC2s
Cryopreserved PBMCs (UCLA Virology Core, sex of donors unknown) from each donor were thawed to room temperature and slowly diluted with 9 mL pre-warmed RPMI-1640 (Corning, 10040CV) supplemented with 10% FBS (VWR, 97068–091, lot#029K20) and Penicillin/Streptomycin (Gibco, 15140122). Media was then removed and PBMCs were washed with ice cold 1% bovine serum albumin (BSA, Sigma-Aldrich, B4287–25G) in PBS (PBSA). PBMCs were then stained for one hour at 4°C in a cocktail of anti-lineage FITC (Invitrogen, 22–7778-72), anti-FcεR1 FITC (Biolegend 334608), anti-CD25 APC/Fire 810 (Biolegend 356150), anti-CD127 Brilliant Violet 421 (Biolegend 351310), and anti-CRTH2 Brilliant Violet 605 (Biolegend 350122), (panel 2 below) all at a dilution of 1:20 in PBSA except for the anti-lineage antibody, which was diluted 1:10. Cells were then washed once with cold PBSA and once with cold PBS, then fixed in 2% paraformaldehyde (PFA) at room temperature for 15 minutes. Paraformaldehyde (PFA, Election Microscopy Sciences, 15714) diluted in PBS for 15 mins at room temperature. PFA was then removed, and cells were washed once with PBS. Cells were then resuspended in ice cold methanol and incubated on ice for 30 minutes. Cells were then washed with PBS and resuspended in anti-Foxp3 Alexa Fluor 647 (Biolegend 320114) diluted 1:20 in PBSA for 1 hour. Cells were then washed twice with PBSA before being resuspended in PBSA for analysis on a BD FACSCelesta flow cytometer. Populations were gated as shown in supplementary figures, and the median IL2Rα abundance was extracted for each population.
Statistical analysis
The number of replicates performed for each experimental measurement, and the values of confidence intervals are described in corresponding figure captions. N is used to describe the number of times a particular experiment was performed. Flow cytometry experiments performed using initial panel of monovalent and bivalent cytokines (Figs. 1–4) were performed on hPBMCs were conducted using separate experimental replicates on cells gathered from a single donor. Each replicate of the flow cytometry signaling experiments in Figures 5 and 6 were conducted using hPBMCs from different donors. To quantify population-level flow cytometry measurements for both signaling and receptor quantitation experiments, the mean fluorescent intensity (MFI) of a gated population was measured. Compensation to remove fluorescent spectral overlap was performed for each experimental measurement. Subtraction of either negative controls or cells treated with isotype antibodies was performed on signaling and receptor quantitation data respectively to remove background signal. Cells which were measured to display fluorescent intensities above 1,000,000 were excluded from analysis during signaling experiments. Pearson correlation coefficients (R2) values were used to describe model accuracy when predicting signaling response to IL-2 and IL-2 muteins. The Kx* parameter was fit with least-squares fitting using the Broyden–Fletcher–Goldfarb–Shanno minimization algorithm as implemented in SciPy.
Antibodies
Antibodies (listed in table S4) used to quantify receptor abundances, as well as to perform initial pSTAT5 response quantification in PBMCs can be found in Farhat et al.15
Newly created materials
All novel IL-2 muteins were synthesized as described above, and contained the mutations as described above. No restrictions on access to these materials are noted.
Binding model
The model was formulated as described in Tan et al35. The monomer composition of a ligand complex was represented by a vector , where each was the fraction of monomer ligand type out of all monomers on that complex. Let be the proportion of the complexes in all ligand complexes, and be the set of all possible ’s. .
The binding between a ligand complex and a cell expressing several types of receptors can be represented by a series of . The relationship between ’s and is given by . Let the vector , and the corresponding of a binding configuration be . For all in , we define where and . The relative number of complexes bound to a cell with configuration at equilibrium is:
Then we can calculate the relative amount of bound receptor as
By mass conservation, (), we can solve numerically for each type of receptor.
Application of multivalent binding model to IL-2 signaling pathway
Each IL-2 molecule was allowed to bind to one free IL2Rα and one IL2Rβ/γc receptor. Initial IL-2-receptor association proceeded with the known kinetics of monomeric ligand-receptor interaction (table S1). Subsequent ligand-receptor binding interactions then proceeded with an association constant proportional to available receptor abundance and affinity multiplied by the scaling constant, , as described above. To predict the pSTAT5 response to IL-2 stimulation, we assumed that pSTAT5 is proportional to the amount of IL-2-bound IL2Rβ/γc, because complexes which contain these species actively signal through the JAK/STAT pathway. Scaling factors converting from predicted active signaling species to pSTAT5 abundance were fit to experimental data on a per-experiment and cell type basis. A single value was fit for all experiments and cell types.
CITE-seq marker selectivity analysis
To assist in identifying possible markers to increase IL-2 selectivity towards Tregs, a publicly available Cellular Indexing of Transcriptomes and Epitopes by sequencing (CITE-seq) dataset containing data gathered from human PBMCs was analyzed31. Only RNA transcripts encoding cell membrane extracellular-facing proteins were included. We first analyzed the data by determining the Wasserstein distance and Kullback-Leibler divergence of markers and RNA measured in Tregs against the distribution of these markers displayed by all other cells. We also analyzed the data using a ridge classification model, where all markers and RNA sequences were used by the model to distinguish between Tregs and all other cell types.
Markers of interest were then used in conjunction with the binding model to determine whether they could confer selectivity, using the CITE-seq data to inform the number of markers per cell. Conversion factors for calculating marker abundance from CITE-seq marker and mRNA reads were estimated using proportional conversions from the data to previously experimentally determined marker abundances15. Single cell marker abundances were calculated for 1000 cells at a time, and the ratio of Treg signaling to off-target signaling was calculated. To simulate bispecific binding, two distinct binding domains for each ligand were modeled, one for IL-2, with affinity for IL2Rα and IL2Rβ/γc, and the other for the marker of interest. The ligand affinities were varied while defining selectivity as the summed Treg signaling divided by the signaling across all off-target cell populations. After finding IL2Rα to be the optimal epitope for increasing selectivity, we sought to explore the effects of increasing valency by doubling the number of binding domains per ligand.
Tensor Factorization
Before decomposition, the signaling response data was background subtracted and variance scaled across each cell population. Non-negative canonical polyadic decomposition was performed using the Python package TensorLy, using the HALS algorithm with non-negative SVD initialization64.
Supplementary Material
Acknowledgements:
The authors thank Cori Posner for contributing to initial profiling studies that enabled the study.
Funding:
This work was partly supported by startup funds from UCLA Engineering and by NIH U01-AI148119 to A.S.M.
Footnotes
Competing interests: A.S.M. has filed a patent PCT/US22/35711 on the use of multivalent cytokines to enhance cell type-selective responses. A.S.M., B.O.J., and P.C.E. have filed a provisional patent on the use of bitargeting for engineered cytokine responses.
Data and materials availability:
All analysis was implemented in Python v3.10 and can be found at https://doi.org/10.5281/zenodo.8322891, along with all the experimental data. All other data needed to evaluate the conclusions in the paper are present in the paper or the Supplementary Materials.
References and Notes
- 1.Leonard WJ, Lin J-X & O’Shea JJ The γc Family of Cytokines: Basic Biology to Therapeutic Ramifications. Immunity 50, 832–850 (2019). [DOI] [PubMed] [Google Scholar]
- 2.Janas ML, Groves P, Kienzle N & Kelso A IL-2 Regulates Perforin and Granzyme Gene Expression in CD8+ T Cells Independently of Its Effects on Survival and Proliferation. The Journal of Immunology 175, 8003–8010 (2005). [DOI] [PubMed] [Google Scholar]
- 3.Chinen T et al. An essential role for the IL-2 receptor in Treg cell function. Nat Immunol 17, 1322–1333 (2016). [DOI] [PMC free article] [PubMed] [Google Scholar]
- 4.Fan MY et al. Differential Roles of IL-2 Signaling in Developing versus Mature Tregs. Cell Rep 25, 1204–1213.e4 (2018). [DOI] [PMC free article] [PubMed] [Google Scholar]
- 5.Noguchi M et al. Interleukin-2 receptor gamma chain mutation results in X-linked severe combined immunodeficiency in humans. Cell 73, 147–157 (1993). [PubMed] [Google Scholar]
- 6.Zenatti PP et al. Oncogenic IL7R gain-of-function mutations in childhood T-cell acute lymphoblastic leukemia. Nat Genet 43, 932–939 (2011). [DOI] [PMC free article] [PubMed] [Google Scholar]
- 7.Dwyer CJ et al. Fueling Cancer Immunotherapy With Common Gamma Chain Cytokines. Frontiers in Immunology 10, (2019). [DOI] [PMC free article] [PubMed] [Google Scholar]
- 8.Abbas AK, Trotta E, Simeonov DR, Marson A & Bluestone JA Revisiting IL-2: Biology and therapeutic prospects. Science Immunology 3, (2018). [DOI] [PubMed] [Google Scholar]
- 9.Choudhry H et al. Prospects of IL-2 in Cancer Immunotherapy. BioMed Research International 2018, e9056173 (2018). [DOI] [PMC free article] [PubMed] [Google Scholar]
- 10.Tahvildari M & Dana R Low-Dose IL-2 Therapy in Transplantation, Autoimmunity, and Inflammatory Diseases. The Journal of Immunology 203, 2749–2755 (2019). [DOI] [PMC free article] [PubMed] [Google Scholar]
- 11.Spolski R, Li P & Leonard WJ Biology and regulation of IL-2: from molecular mechanisms to human therapy. Nat Rev Immunol 18, 648–659 (2018). [DOI] [PubMed] [Google Scholar]
- 12.Koreth J et al. Interleukin-2 and regulatory T cells in graft-versus-host disease. N Engl J Med 365, 2055–2066 (2011). [DOI] [PMC free article] [PubMed] [Google Scholar]
- 13.Saadoun D et al. Regulatory T-cell responses to low-dose interleukin-2 in HCV-induced vasculitis. N Engl J Med 365, 2067–2077 (2011). [DOI] [PubMed] [Google Scholar]
- 14.Krieg C, Létourneau S, Pantaleo G & Boyman O Improved IL-2 immunotherapy by selective stimulation of IL-2 receptors on lymphocytes and endothelial cells. Proc. Natl. Acad. Sci. U.S.A. 107, 11906–11911 (2010). [DOI] [PMC free article] [PubMed] [Google Scholar]
- 15.Farhat AM et al. Modeling cell-specific dynamics and regulation of the common gamma chain cytokines. Cell Rep 35, 109044 (2021). [DOI] [PMC free article] [PubMed] [Google Scholar]
- 16.Gonnord P et al. A hierarchy of affinities between cytokine receptors and the common gamma chain leads to pathway cross-talk. Sci Signal 11, (2018). [DOI] [PubMed] [Google Scholar]
- 17.Mitra S & Leonard WJ Biology of IL-2 and its therapeutic modulation: Mechanisms and strategies. J. Leukoc. Biol. 103, 643–655 (2018). [DOI] [PubMed] [Google Scholar]
- 18.VanDyke D et al. Engineered human cytokine/antibody fusion proteins expand regulatory T cells and confer autoimmune disease protection. Cell Reports 41, (2022). [DOI] [PMC free article] [PubMed] [Google Scholar]
- 19.Silva D-A et al. De novo design of potent and selective mimics of IL-2 and IL-15. Nature 565, 186–191 (2019). [DOI] [PMC free article] [PubMed] [Google Scholar]
- 20.Khoryati L et al. An IL-2 mutein engineered to promote expansion of regulatory T cells arrests ongoing autoimmunity in mice. Sci Immunol 5, eaba5264 (2020). [DOI] [PMC free article] [PubMed] [Google Scholar]
- 21.Bell CJM et al. Sustained in vivo signaling by long-lived IL-2 induces prolonged increases of regulatory T cells. J Autoimmun 56, 66–80 (2015). [DOI] [PMC free article] [PubMed] [Google Scholar]
- 22.Peterson LB et al. A long-lived IL-2 mutein that selectively activates and expands regulatory T cells as a therapy for autoimmune disease. J. Autoimmun. 95, 1–14 (2018). [DOI] [PMC free article] [PubMed] [Google Scholar]
- 23.Ghelani A et al. Defining the Threshold IL-2 Signal Required for Induction of Selective Treg Cell Responses Using Engineered IL-2 Muteins. Front Immunol 11, 1106 (2020). [DOI] [PMC free article] [PubMed] [Google Scholar]
- 24.Moynihan K et al. 717 Selective activation of CD8+ T cells by a CD8-targeted IL-2 results in enhanced anti-tumor efficacy and safety. J Immunother Cancer 9, (2021). [Google Scholar]
- 25.Hirai T et al. Selective expansion of regulatory T cells using an orthogonal IL-2/IL-2 receptor system facilitates transplantation tolerance. J Clin Invest 131, (2021). [DOI] [PMC free article] [PubMed] [Google Scholar]
- 26.Mitra S et al. Interleukin-2 activity can be fine tuned with engineered receptor signaling clamps. Immunity 42, 826–838 (2015). [DOI] [PMC free article] [PubMed] [Google Scholar]
- 27.de Picciotto S et al. Selective activation and expansion of regulatory T cells using lipid encapsulated mRNA encoding a long-acting IL-2 mutein. Nat Commun 13, 3866 (2022). [DOI] [PMC free article] [PubMed] [Google Scholar]
- 28.Feinerman O et al. Single-cell quantification of IL-2 response by effector and regulatory T cells reveals critical plasticity in immune response. Mol. Syst. Biol. 6, 437 (2010). [DOI] [PMC free article] [PubMed] [Google Scholar]
- 29.Lowenthal JW, Robson MacDonald H & Iacopetta BJ Intracellular pathway of interleukin 2 following receptor-mediated endocytosis. European Journal of Immunology 16, 1461–1463 (1986). [DOI] [PubMed] [Google Scholar]
- 30.Klatzmann D & Abbas AK The promise of low-dose interleukin-2 therapy for autoimmune and inflammatory diseases. Nature Reviews Immunology 15, 283–294 (2015). [DOI] [PubMed] [Google Scholar]
- 31.Hao Y et al. Integrated analysis of multimodal single-cell data. Cell 184, 3573–3587.e29 (2021). [DOI] [PMC free article] [PubMed] [Google Scholar]
- 32.Tan ZC, Orcutt-Jahns BT & Meyer AS A quantitative view of strategies to engineer cell-selective ligand binding. Integrative Biology 13, 269–282 (2021). [DOI] [PMC free article] [PubMed] [Google Scholar]
- 33.Tan ZC, Murphy MC, Alpay HS, Taylor SD & Meyer AS Tensor-structured decomposition improves systems serology analysis. Mol Syst Biol 17, e10243 (2021). [DOI] [PMC free article] [PubMed] [Google Scholar]
- 34.Kolda TG & Bader BW Tensor Decompositions and Applications. SIAM Rev. 51, 455–500 (2009). [Google Scholar]
- 35.Tan ZC & Meyer AS A general model of multivalent binding with ligands of heterotypic subunits and multiple surface receptors. Math Biosci 108714 (2021) doi: 10.1016/j.mbs.2021.108714. [DOI] [PMC free article] [PubMed] [Google Scholar]
- 36.Robinett RA et al. Dissecting FcγR Regulation through a Multivalent Binding Model. Cell Syst 7, 41–48.e5 (2018). [DOI] [PMC free article] [PubMed] [Google Scholar]
- 37.Perelson AS & DeLisi C Receptor clustering on a cell surface. I. theory of receptor cross-linking by ligands bearing two chemically identical functional groups. Mathematical Biosciences 48, 71–110 (1980). [Google Scholar]
- 38.Stone JD, Cochran JR & Stern LJ T-cell activation by soluble MHC oligomers can be described by a two-parameter binding model. Biophys J 81, 2547–2557 (2001). [DOI] [PMC free article] [PubMed] [Google Scholar]
- 39.Voss SD et al. Increased expression of the interleukin 2 (IL-2) receptor beta chain (p70) on CD56+ natural killer cells after in vivo IL-2 therapy: p70 expression does not alone predict the level of intermediate affinity IL-2 binding. J Exp Med 172, 1101–1114 (1990). [DOI] [PMC free article] [PubMed] [Google Scholar]
- 40.Mazor Y et al. Enhanced tumor-targeting selectivity by modulating bispecific antibody binding affinity and format valence. Sci Rep 7, 40098 (2017). [DOI] [PMC free article] [PubMed] [Google Scholar]
- 41.Ye C, Brand D & Zheng SG Targeting IL-2: an unexpected effect in treating immunological diseases. Signal Transduct Target Ther 3, 2 (2018). [DOI] [PMC free article] [PubMed] [Google Scholar]
- 42.Siegel JP & Puri RK Interleukin-2 toxicity. J Clin Oncol 9, 694–704 (1991). [DOI] [PubMed] [Google Scholar]
- 43.Tchao N et al. Amg 592 Is an Investigational IL-2 Mutein That Induces Highly Selective Expansion of Regulatory T Cells. Blood 130, 696 (2017).28798058 [Google Scholar]
- 44.Buitrago-Molina LE et al. Treg-specific IL-2 therapy can reestablish intrahepatic immune regulation in autoimmune hepatitis. Journal of Autoimmunity 117, 102591 (2021). [DOI] [PubMed] [Google Scholar]
- 45.Carr A et al. Outpatient continuous intravenous interleukin-2 or subcutaneous, polyethylene glycol-modified interleukin-2 in human immunodeficiency virus-infected patients: a randomized, controlled, multicenter study. Australian IL-2 Study Group. J Infect Dis 178, 992–999 (1998). [DOI] [PubMed] [Google Scholar]
- 46.Bernett MJ et al. An IL15/IL15Ra heterodimeric Fc-fusion engineered for reduced potency demonstrates an optimal balance of in vivo activity and exposure. (2018). [Google Scholar]
- 47.Hashimoto M et al. PD-1 combination therapy with IL-2 modifies CD8+ T cell exhaustion program. Nature 610, 173–181 (2022). [DOI] [PMC free article] [PubMed] [Google Scholar]
- 48.Codarri Deak L et al. PD-1-cis IL-2R agonism yields better effectors from stem-like CD8+ T cells. Nature 610, 161–172 (2022). [DOI] [PMC free article] [PubMed] [Google Scholar]
- 49.Kalbasi A et al. Potentiating adoptive cell therapy using synthetic IL-9 receptors. Nature 607, 360–365 (2022). [DOI] [PMC free article] [PubMed] [Google Scholar]
- 50.Mo F et al. An engineered IL-2 partial agonist promotes CD8+ T cell stemness. Nature 597, 544–548 (2021). [DOI] [PMC free article] [PubMed] [Google Scholar]
- 51.Elyaman W et al. IL-9 induces differentiation of TH17 cells and enhances function of FoxP3+ natural regulatory T cells. Proceedings of the National Academy of Sciences 106, 12885–12890 (2009). [DOI] [PMC free article] [PubMed] [Google Scholar]
- 52.Zaiss DMW et al. Amphiregulin enhances regulatory T cell suppressive function via the epidermal growth factor receptor. Immunity 38, 275–284 (2013). [DOI] [PMC free article] [PubMed] [Google Scholar]
- 53.Marie JC, Letterio JJ, Gavin M & Rudensky AY TGF-β1 maintains suppressor function and Foxp3 expression in CD4+CD25+ regulatory T cells. Journal of Experimental Medicine 201, 1061–1067 (2005). [DOI] [PMC free article] [PubMed] [Google Scholar]
- 54.Antebi YE et al. Combinatorial Signal Perception in the BMP Pathway. Cell 170, 1184–1196.e24 (2017). [DOI] [PMC free article] [PubMed] [Google Scholar]
- 55.Kiessling LL, Gestwicki JE & Strong LE Synthetic Multivalent Ligands as Probes of Signal Transduction. Angewandte Chemie International Edition 45, 2348–2368 (2006). [DOI] [PMC free article] [PubMed] [Google Scholar]
- 56.Moraga I et al. Synthekines are surrogate cytokine and growth factor agonists that compel signaling through non-natural receptor dimers. Elife 6, e22882 (2017). [DOI] [PMC free article] [PubMed] [Google Scholar]
- 57.Cuesta AM, Sainz-Pastor N, Bonet J, Oliva B & Alvarez-Vallina L Multivalent antibodies: when design surpasses evolution. Trends Biotechnol 28, 355–362 (2010). [DOI] [PubMed] [Google Scholar]
- 58.York SJ, Arneson LS, Gregory WT, Dahms NM & Kornfeld S The rate of internalization of the mannose 6-phosphate/insulin-like growth factor II receptor is enhanced by multivalent ligand binding. J Biol Chem 274, 1164–1171 (1999). [DOI] [PubMed] [Google Scholar]
- 59.Csizmar CM et al. Multivalent Ligand Binding to Cell Membrane Antigens: Defining the Interplay of Affinity, Valency, and Expression Density. J Am Chem Soc 141, 251–261 (2019). [DOI] [PMC free article] [PubMed] [Google Scholar]
- 60.Cb C, P M, Rm O, Ec D & Ll K Selective tumor cell targeting using low-affinity, multivalent interactions. ACS chemical biology 2, (2007). [DOI] [PubMed] [Google Scholar]
- 61.Kelly-Welch AE, Hanson EM, Boothby MR & Keegan AD Interleukin-4 and interleukin-13 signaling connections maps. Science 300, 1527–1528 (2003). [DOI] [PubMed] [Google Scholar]
- 62.Efimov GA et al. Cell-type-restricted anti-cytokine therapy: TNF inhibition from one pathogenic source. Proc Natl Acad Sci U S A 113, 3006–3011 (2016). [DOI] [PMC free article] [PubMed] [Google Scholar]
- 63.Ishino T et al. Engineering a monomeric Fc domain modality by N-glycosylation for the half-life extension of biotherapeutics. J Biol Chem 288, 16529–16537 (2013). [DOI] [PMC free article] [PubMed] [Google Scholar]
- 64.Kossaifi J, Panagakis Y, Anandkumar A & Pantic M TensorLy: Tensor Learning in Python. arXiv:1610.09555 [cs] (2018). [Google Scholar]
Associated Data
This section collects any data citations, data availability statements, or supplementary materials included in this article.
Supplementary Materials
Data Availability Statement
All analysis was implemented in Python v3.10 and can be found at https://doi.org/10.5281/zenodo.8322891, along with all the experimental data. All other data needed to evaluate the conclusions in the paper are present in the paper or the Supplementary Materials.