

Abstract
Diagnostic errors in medicine represent a significant public health problem but continue to be challenging to measure accurately, reliably, and efficiently. The recently developed Symptom-Disease Pair Analysis of Diagnostic Error (SPADE) approach measures misdiagnosis related harms using electronic health records or administrative claims data. The approach is clinically valid, methodologically sound, statistically robust, and operationally viable without the requirement for manual chart review. This paper clarifies aspects of the SPADE analysis to assure that researchers apply this this method to yield valid results with a particular emphasis on defining appropriate comparator groups and analytical strategies for balancing differences between these groups. We discuss four distinct types of comparators (intra-group and inter-group for both look-back and look-forward analyses), detailing the rationale for choosing one over the other and inferences that can be drawn from these comparative analyses. Our aim is that these additional analytical practices will improve the validity of SPADE and related approaches to quantify diagnostic error in medicine.
Keywords: Diagnostic Errors, Missed Diagnosis, Delayed Diagnosis, Quality Improvement, Outcome Assessment, Health Care, Stroke
Introduction
Reducing diagnostic error, defined as the failure to establish an accurate and timely explanation of the patient’s health problem, is key to achieving high quality and safe healthcare.(1) Accurate measurements of diagnostic error rates are essential to assure high quality healthcare; “you can’t fix what you don’t measure” is a fundamental principle of performance improvement.(2)
In our 2018 paper we described the Symptom-Disease Pair Analysis of Diagnostic Error (SPADE) approach to measure diagnostic errors using information available in existing databases.(3) At its core, SPADE is an inferential framework for estimating misdiagnosis-related harms based on time-linked markers of diagnostic delay that are specific to biologically plausible symptom-disease pairs.(3, 4) Misdiagnosis-related harms are harms resulting from either (a) the delay or failure to treat a condition actually present when the working diagnosis was wrong or unknown (i.e., a delayed or missed diagnosis) or (b) treatment provided for a condition not actually present (i.e., a wrong diagnosis).(4, 5) To use SPADE to track these harms, changes in diagnostic labeling must take place over at least two discrete care episodes. The symptoms or signs manifest at an initial encounter (i.e., index visit) must plausibly link to a subsequent care encounter (i.e., outcome visit). Administrative claims databases wherein individuals can be tracked across multiple clinical encounters are well-suited to the SPADE approach.(6)
Over the years, researchers deploying SPADE and SPADE-style analyses in individual studies have sought to improve the validity and reliability of these approaches in a number of ways including the use of comparison groups, propensity score matching, and simulation-based analysis.(7–21) In this manuscript, we briefly review core SPADE concepts before turning to additional methodological issues in the selection, incorporation, and analysis of symptom- or disease-based comparison groups within the SPADE framework. We use examples linked to cerebrovascular disease misdiagnosis because of the robust extant literature on this topic, the authors’ content expertise in this area, and the large public health burden associated with stroke misdiagnosis.(22, 23) Our aim is to facilitate further use of SPADE to estimate symptom-specific diagnostic errors and thereby evaluate diagnostic quality and safety across a broad range of acute diseases. This is an important area of study since acute medical conditions, including cerebrovascular events, are responsible for over half of all serious misdiagnosis-related harms.(24)
Symptom-Disease pairs and direction of analysis
The SPADE approach conceptualizes a patients’ presenting symptom(s) as the exposure of interest while the underlying disease(s) leading to this symptom(s)’s manifestation represents the outcome of interest. SPADE relies on a basic premise about the natural history of dangerous, acute diseases—if you miss such a disease (e.g., stroke, heart attack, or sepsis), the short-term risk of an adverse event (a return visit, hospitalization, death, or other relevant patient-centered health outcome) is high. If the patient manages to survive that short-term risk period without an adverse event, the risk of an adverse event (i.e., cardiac tamponade after an aortic dissection) may gradually normalize to a level that roughly approximates the patient’s baseline level of risk for such an event. Though, in many cases, there may be additional adverse effects of an initial misdiagnosis including progression to a chronic disease state. For example, while the risk of stroke, acute coronary syndrome, and death after TIA/minor stroke is highest in the first 90 days after index event it remains somewhat elevated at one year as well as five years thereafter.(25, 26)
Symptom-disease pairs, where the symptom under evaluation can be a missed manifestation of a dangerous disease, can be identified and evaluated using two different approaches: (A) “look-back” and (B) “look-forward.”(3) The look-back approach starts with a dangerous disease and then identifies antecedent symptom or other clinical manifestation of that disease that may have been misinterpreted and mislabeled. The look-forward approach, in contrast, starts with the original symptom (or “benign” disease) label and determines whether a dangerous disease may have been missed at the original clinical presentation. Since, in the real-world, patients present with symptoms rather than a disease the look-forward approach often provides more actionable information since it can be more readily used to develop interventions.
In SPADE, the initial symptom represents the exposure of interest (i.e., the look-back numerator or look-forward denominator), while the disease represents the outcome of interest (i.e., the look-back denominator or look-forward numerator). When little is known about a misdiagnosis scenario, it often makes sense to begin with a look-back analysis. Starting with a look-back analysis helps identify symptom-disease pairs for that disease—put differently, this stage of analysis identifies what sorts of symptoms or clinical problems may be unrecognized manifestations of the target disease. This analysis can then be followed by a look-forward analysis to confirm that a symptom-disease pair is a true “diagnostic-error dyad” (i.e., confirmed to be associated with an elevated risk of short-term harms above expected) and to estimate the rate at which adverse events (i.e., misdiagnosis-related harms) are occurring.(3) Selection of control or comparison groups is crucial in both SPADE analytic directions, and this is the focal point for new methods described in later sections of this manuscript.
One versus many symptoms or diseases using SPADE
Regardless of the direction of analysis, there must be a biologically plausible relationship between symptom(s) and disease(s) included in the symptom-disease pair. For simplicity, we have (and will continue) to use language describing a “symptom-disease pair” as if it always represents a single symptom and a single disease. However, analytically speaking, this will often not be the case—symptoms or diseases are often grouped together for analysis. The “symptom” may be a single symptom or sign (e.g., headache or chest pain) or a cluster of symptoms or signs (e.g., neurologic symptoms, including headache, dizziness, double vision, numbness, weakness, ataxia, and so on). The “disease” may be a single disease (e.g., ischemic stroke), a narrow disease category (e.g., cerebrovascular events, including ischemic stroke, transient ischemic attack [TIA], or intracerebral hemorrhage), or a broad disease category (e.g., all major vascular events, including cerebrovascular disease, myocardial infarction, pulmonary embolus, and so on).
The rationale for choosing a single symptom or disease versus a cluster is often based on balancing the tradeoff between measurement precision (which is a function of event frequency) and purpose or actionability of the information to be gleaned from the analysis. For example, imagine the goal of measurement is to determine the overall missed stroke rate in the emergency department (ED). It may be preferable to lump together all ED index treat-and-release visits with any neurologic symptom reported in a look-forward analysis to get an overall diagnostic error rate that is very precise, without concern for the actionability of the results since it would be difficult to design a real-world intervention to improve diagnostic accuracy among patients with a variety of different neurological symptoms. By contrast, if the goal of measurement is to assess the risk factors for missed stroke in order to build diagnostic safety interventions, it may be preferable to sacrifice some precision in order to have a more granular, actionable result. In the latter case, it may make sense to use a look-back analysis from stroke hospitalizations that compares across individual neurologic symptoms at antecedent ED treat-and-release visits to determine which symptom (e.g., dizziness, speech difficulty) is most often being missed to inform targeted, symptom specific, intervention. Determining the accuracy of the chosen diagnostic codes or other markers in the electronic medical record being used to identify symptoms or diseases of interest is a key preliminary step to establishing the precision of a given symptom-disease pair, however, a detailed discussion of strategies to validate diagnostic codes and other detection methods is beyond the scope of this manuscript.
Incorporating comparison groups into SPADE
In either direction of SPADE analysis, comparison (control) groups can help test the strength, coherence, and specificity of the relationship(s) being inferred to enhance the validity of a proposed diagnostic-error dyad assuming the selected database is a reliable one.(3) Symptom and disease comparison groups can be drawn from within a target cohort (intra-group comparison) or from a separate (inter-group comparison) cohort (Figure 1A–D). The intra-group comparisons are “one-to-many” (single cohort, multiple outcomes), while the inter-group comparisons are “many-to-one” (multiple cohorts, single outcomes). Disease or symptom control groups can be either positive (expecting higher odds or risk) or negative (expecting lower odds or risk) comparators.
Figure 1. Comparison group options in SPADE analysis.
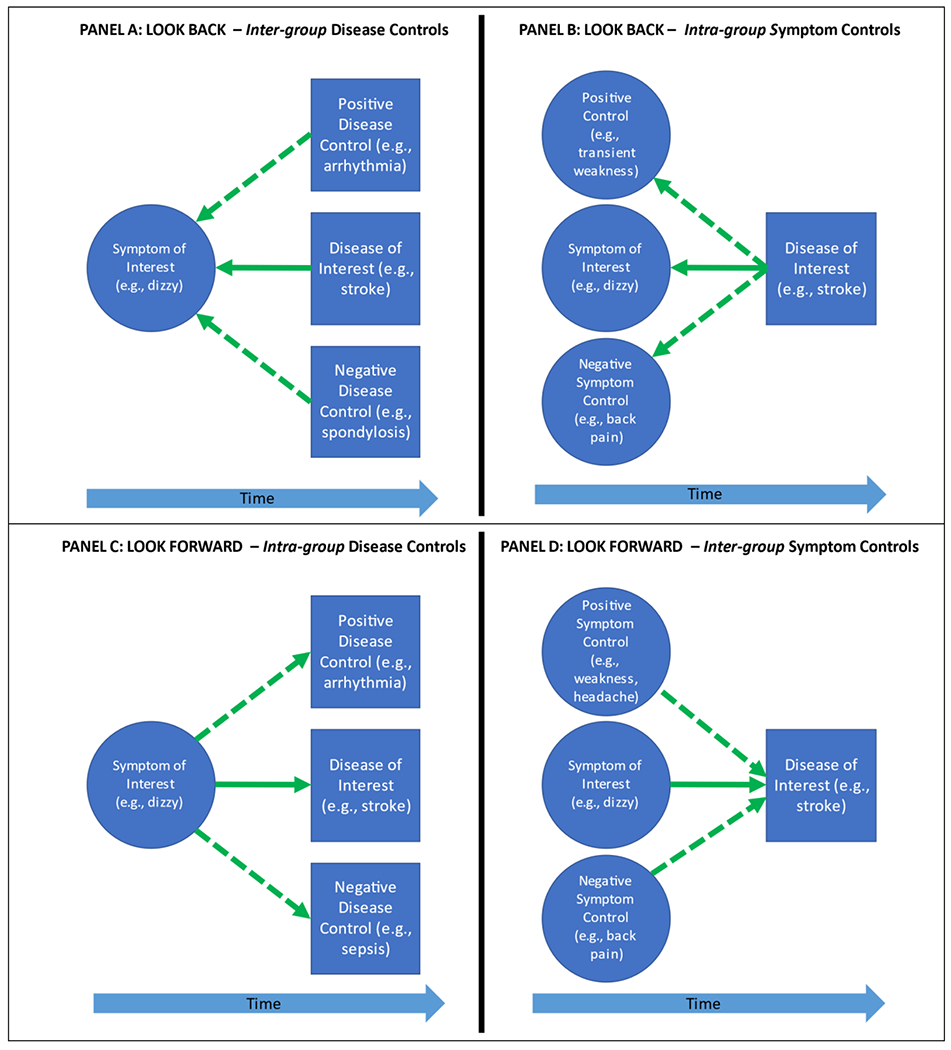
Comparison groups can be used in both directions of SPADE analysis to assess the relationships between symptoms and diseases and infer expected visit rates to enhance the validity of the proposed symptom-disease pair as a true diagnostic-error dyad. Symptom and disease comparison groups can be drawn from within a cohort of interest (intra-group comparison) or from a separate (inter-group comparison) cohort. Using the look-back approach, researchers can use an inter-group disease comparator (A) or an intra-group symptom comparator (B). Using the look-forward approach, researchers can use an intra-group disease comparator (C) or an inter-group symptom comparator (D). We use the dizzy-stroke exemplar to illustrate these four types of comparators. Solid arrows indicate a symptom-disease pair of interest; dotted arrows indicate the comparison group. Note that the intra-group comparisons are “one-to-many” (single cohort, multiple outcomes) (B, C), while the inter-group comparisons are “many-to-one” (multiple cohorts, single outcomes) (A, D). Rationales for choosing one type of comparator over another can be found in Table 1, but the most commonly used forms shown are intra-group (B, C).
The rationale for using one or the other of these potential control populations is shown in Table 1. Once a symptom-disease pair is established via bi-directional analyses, it is useful to evaluate the construct validity of the pair using clinically plausible disease and/or symptom comparison groups.(27) To illustrate the utility of these different sorts of control comparison groups, we will consider the diagnostic-error dyad of dizziness-stroke, paying careful attention to the direction of analysis and inferences drawn from different comparators.(6, 28, 29)
Table 1.
Rationale and inferences to be drawn from different comparator groups
| Comparator Type | Rationale for Choice | Inferences for Different Controls |
|---|---|---|
| Look backa inter-group disease comparator (Figure 1A) | Disease discovery: Use this comparator in a look-back analysis to determine which diseases are missed presentations (or not) for a particular target symptom. Be cautious of prevalence-linked confounders for downstream adverse events. | Negative controls are used to show specificity (discriminant construct validity) of one or more disease associations in a symptom-disease pairing. Positive controls are used to demonstrate alternative-forms reliability for disease clusters linked to a symptom. |
| Look backa intra-group symptom comparator (Figure 1B) | Symptom discovery: Use this comparator in a look-back analysis to determine which symptoms are missed presentations (or not) for a particular target disease. | Negative controls are used to show specificity (discriminant construct validity) of one or more symptom associations in a symptom-disease pairing. Positive controls are used to demonstrate alternative-forms reliability for symptom clusters linked to a disease. |
| Look-forwardb intra-group disease comparator (Figure 1C) | Disease specificity: Use this comparator in a look-forward analysis to compare harm rates across diseases for a particular target symptom. | Negative controls are used to show specificity (discriminant construct validity) of one or more disease associations in a symptom-disease pairing. Positive controls are used to demonstrate alternative-forms reliability for disease clusters linked to a symptom. |
| Look-forwardb inter-group symptom comparator (Figure 1D) | Symptom specificity: Use this comparator in a look-forward analysis to compare harm rates across symptoms for a particular target disease. Be cautious of prevalence-linked confounders for downstream adverse events. | Negative controls are used to show specificity (discriminant construct validity) of one or more symptom associations in a symptom-disease pairing. Positive controls are used to demonstrate alternative-forms reliability for symptom clusters linked to a disease. |
Look-back analyses begin with diseases as the denominator, so largely normalize disease prevalence/risk when comparing across symptoms that might be associated. This effectively controls for disease prevalence effects. For example, patients with acute dizziness or vertigo have a roughly 3-5% prevalence of cerebrovascular causes, but the prevalence of cerebrovascular causes is higher among patients with new unilateral weakness. In a look-back analysis, this difference in prevalence has little impact on the result. The outcome is that dizziness or vertigo are found to have higher odds of missed stroke than unilateral weakness. The inference takes as a given that the patient actually has a stroke, so the result relates solely to the relative likelihood of error for target symptoms.
Look-forward analyses begin with symptoms as the denominator, so do NOT normalize disease prevalence/risk when comparing across diseases that might be associated. This does not control for disease prevalence effects, so analytic results admix prevalence effects and diagnostic error-related effects. As a result, look-forward analyses most closely approximate real-world harm rates. For example, patients with acute dizziness or vertigo have a roughly 3-5% prevalence of cerebrovascular causes, but the prevalence of cerebrovascular causes is higher among patients with new unilateral weakness. In a look-forward analysis, this difference in prevalence has a substantial impact on the result. The outcome is that weakness is found to have higher absolute rates/risks of missed stroke than dizziness or vertigo, even though dizziness and vertigo create a far higher (relative) risk of misdiagnosis when the patient does have a stroke. The inference just takes as a given that the patient has one or the other symptom, so the result admixes the prevalence of stroke in those symptoms with the relative likelihood of error for target symptoms.
Look-Back comparators
To evaluate which symptoms are associated with misdiagnosis of dangerous target disease, comparisons between symptom subtypes can be useful. For example, a look-back study of stroke misdiagnosis could compare the proportion of visits preceding stroke hospitalization for a symptom that might be an early, difficult to evaluate neurological complaint (e.g., dizziness/vertigo or headache) to the proportion of visits for preceding typical TIA symptoms (e.g., focal weakness, speech changes)(25, 30) or the proportion of visits for a symptom not known to be related to cerebrovascular disease (e.g., low back pain). These are intra-group symptom controls since every subject in each symptom comparison group has had an outcome visit for stroke (Figure 1B). In this example, the proportion of visits for typical TIA symptoms (e.g., focal weakness) should be lower than those for the target symptom (e.g., a non-specific neurological complaint that can sometimes be the manifestation of cerebral ischemia such as dizziness/vertigo) but higher than the proportion of visits for lower back pain. However, this type of intra-group comparison in the look-back direction does not account for the fact that, in clinical practice, the prevalence of certain symptoms may differ across diseases, independent of the underlying risk of misdiagnosis with that symptom. In order to explore the proportion of preceding visits for a symptom that is being considered for inclusion in a symptom-disease pair, an inter-group comparison in the look-back direction can be performed (Figure 1A). In this sort of comparison, the proportion of visits for the symptom of interest (e.g., dizziness) prior to hospitalization for dangerous disease of interest (e.g., stroke) is compared to the proportion of visits for that same symptom of interest preceding hospitalization for one (or more) dangerous disease(s) that does have (positive control) or does not have (negative control) a biologically plausible connection to the symptom of interest (e.g., dizziness). For example, an inter-group positive disease control in a look-back analysis for the dizziness-stroke pair could be patients diagnosed with cardiac arrhythmia which can present with dizziness(31) (Figure 1A). Thus, look back analyses focus on discovery of true diagnostic-error dyads—intra-group comparisons to discover symptoms associated (or not) with a disease and inter-group comparisons to discover diseases associated (or not) with a symptom (Table 1).
Look-forward comparators
Using comparator groups with a look-forward approach can help to further establish the validity of a chosen symptom-disease pair as a tool to measure diagnostic error. To begin with, different symptom comparison groups can be used to evaluate the uniqueness of the observed relationship between the symptom(s) of interest and the disease(s) of interest. Using the dizziness-stroke exemplar again, one could compare the short-term stroke rates between dizzy patients, low back pain patients (negative control), and those with focal weakness or headache (positive controls) to assess how substantial the connection between dizziness and stroke is (Figure 1D). Comparing among different symptoms in the look-forward direction is an inter-group style comparison. If adverse events (e.g., hospitalizations) after the target symptom occur as infrequently as those for a negative control symptom, then it is unlikely that many diagnostic errors have occurred for patients who presented with the symptom of interest in the symptom-disease dyad. Alternatively, the rate of additional dangerous diseases could be compared after an encounter for the symptom of interest to evaluate the relative strength of the chosen symptom-disease pair in a way that accounts for the fact that some symptoms can be the manifestation of multiple diseases (Figure 1D). Relevant disease comparison groups to stroke might be patients who are admitted for arrhythmias (positive control), which is closely associated with dizziness,(31) or sepsis (negative control), which is not. These comparator groups are intra-group comparisons because having an index visit for the symptom of interest defines the study cohort (Figure 1C). Which comparison groups to use in a look-forward analysis depends on the symptom(s) and disease(s) included in the pair being evaluated.
Comparing incidence rate patterns
Once comparison groups are selected, the incidence rate pattern of the disease of interest (target disease) can be compared to the incidence rate pattern of a comparator disease or between populations with different symptoms over the short-term. Comparing incidence rates over a defined time allows one to demonstrate that certain symptoms are associated with higher rates of a subsequent disease or, vice versa, that certain diseases are more closely associated with particular symptoms to support the chosen symptom-disease pair.(32) For example, in a recent study of acute myocardial infarction misdiagnosis, the cumulative incidence of myocardial infarction after treat-and-release ED visit for diagnosis of chest pain or dyspnea showed a rapid initial rise (probable missed acute myocardial infarction) whereas in an inter-group comparison cohort of patients with an ED treat-and-release visit for sprains or strains, cumulative incidence of acute myocardial infarction was nearly flat after ED discharge.(19) Direct comparison of incidence rates without accounting for baseline differences in the prevalence of factors known to be associated with the outcome of interest (e.g., comparing stroke incidence between a comparator group that is much older with more vascular comorbidities than the main study cohort) should be avoided. Comparisons without accounting for known risk factors for the disease of interest may lead to erroneous conclusions about the effects of misdiagnosis on outcomes since the baseline rate of adverse events (disease) among patients with known risk factors for these events will be higher than those without risk factors. It is therefore best to only compare unadjusted incidence rates between groups that are expected to have a similar rate of the outcome events if no diagnostic errors occur within the study timeframe.(33)
Analytical strategies for balancing differences between comparison groups
Various strategies may be used to balance differences between comparison groups (Table 2), which is particularly important for inter-group comparisons. There are a few different methods detailed below to adjust for differences between groups included in a look-forward SPADE analysis.
Table 2.
Summary of SPADE analytical strategies using comparison groups
| What is the strategy? | What does the strategy accomplish? | Comments |
|---|---|---|
| Use comparison groups | - Improve the validity of the proposed symptom-disease pair as a true diagnostic-error dyad - Once a symptom-disease pair is established, comparisons with positive and negative controls can be used to evaluate the reliability of the database being used |
- See Figure 1 for details on direction of analysis and comparison group type |
| Determine incidence rate patterns | - The absolute risk for the disease of interest can be calculated - The pattern of disease risk over time in the group of interest can be compared to that of other groups |
- Does not account for baseline factors associated with risk of disease |
| Direct risk factor adjustment | - Allows for adjustment for multiple confounders using a binary or time-to-event outcome | - Important to assure that model assumptions are not violated when using time-to-event analyses |
| Propensity score matching | - Accounts for differences in measured confounders between groups | - Can easily compare outcome event rates between groups |
Direct risk factor adjustment
One way to account for confounders between groups is to perform direct covariate adjustment for known risk-factors of the disease of interest, typically by fitting a regression model for the outcome of interest. For example, a recent large look-forward style study used multivariable logistic regression models to compare subgroups of patients with ED treat-and-release visits for stroke-like symptoms versus other symptoms and reported the odds of a subsequent stroke hospitalization for each patient subgroup within one year of index ED visit after adjustment for vascular comorbidities.(34) The assumptions needed in this approach will depend on the specific model chosen, however, many models will greatly reduce effective sample size and become impractical when the number of potential risk factors for the disease of interest is large. Additionally, if disease risk factors are not well-established, investigators will be unable to support direct covariate adjustment.
Cox proportional hazards models and other semiparametric models also allow for direct adjustment for multiple prognostic independent variables, such as comorbid medical conditions or baseline risk factors in order to evaluate if the observed number of outcome events in the group of interest significantly differs from the expected number of outcome events in a comparison group.(8, 35) However, these and other model types often have assumptions that restrict the shape of the survival curves that may make them poorly suited for the SPADE framework. For example, the proportional hazard assumption states that the hazard functions, representing the risk of an event over time, must be proportional to each other for all patient groups. Given that the SPADE look-forward approach essentially identifies misdiagnosis based on the rationale that disease hospitalizations increase in the short-term if the index visit diagnosis is incorrect, we would expect a higher short-term hump or increase in the population with symptoms that are associated with misdiagnosis than in a negative control comparator group (and a smaller short-term hump as compared to a positive control group). Therefore, the proportional hazard assumption is likely frequently violated in any SPADE analysis using comparator groups.(3) For this reason, visual inspection of all hazard curves is essential to assure that a models’ assumptions are not violated; additional tests to verify proportionality assumptions may be warranted.(36) Parametric time-to-event analyses hold a great deal of promise in characterizing and studying the distribution of outcome events in SPADE analysis. Major advantages of parametric models in the study of diagnostic error is that these models can be highly efficient (greater power) which would be very useful with smaller sample sizes and that they can be used to model survival times when the proportional hazard assumption is not met.(37, 38) However, these methods have not yet been used to measure diagnostic error using administrative claims data.
Propensity score matching
In SPADE analyses, propensity score matching is another way to make a comparison group similar to the study group in either direction of analysis to help infer the expected rate of the dangerous disease of interest had a misdiagnosis not occurred. Unlike direct adjustment for a relatively small number of risk factors, propensity score matching allows adjustment for a large number of covariates including those not established disease risk factors, and therefore enable researchers to analyze an observational (nonrandomized) study in a way that mimics some of the characteristics of a randomized controlled trial due to the reduction of confounding effects.(39) Propensity scores are often used to compare treatments, but they can also be used to estimate the relationship between any nonrandomized factor, such as exposure to an ED treat-and-release visit for a particular symptom, and the outcome of interest.
The propensity score is best conceptualized as a balancing score. Conditional on the propensity score, the distribution of observed baseline covariates will be similar between subjects in relevant comparison groups so that the propensity of each group for the outcome of interest can be assessed. By accounting for measured confounders, propensity score matching provides an extremely useful way to quantify relative risk. This matching approach takes full advantage of the fact that when using observational data we already know which subjects have had the outcome of interest (e.g., hospitalization for dangerous disease) instead of other more traditional matching approaches using only patients’ demographics and comorbidities.(39) The propensity score is used to match on covariates that are potentially related to risk of the outcome so that the baseline risk profile between comparator groups is similar. However, one should always examine the propensity score matched population and evaluate whether an acceptable balance of measured covariates has been reached. This is often done by examining the standardized bias of the risk factors’ marginal (or higher order) distributions between the matched groups.(40)
To date, propensity score matching has been successfully used in only a few SPADE style analyses.(11, 12, 41) For example, in an elegant Canadian study comparing patients with an ED treat-and-release visit with vertigo to propensity score matched counter-parts with an ED treat-and-release visit for renal colic using patients’ demographic and clinical factors, the relative risk of stroke at 7 days was 50 (95% CI: 7-362) for vertigo patients as compared to those with renal colic, although the crude rate of stroke after discharge for vertigo patients was still low (0.14%; 95% CI: 0.10-0.17).(11) Propensity score matching is a particularly important tool to analyze clinical situations that do not permit randomization, like diagnostic error (i.e., patients cannot be assigned or randomized to a misdiagnosis study arm for obvious ethical reasons). It is important to note that even when using propensity scores to match between symptom groups (inter-group comparisons), differences may still exist if important factors that influenced exposure were not measured which can bias the results (unmeasured confounders).(42) Use of propensity score matched negative and positive comparison cohorts to more fully quantify the risk of misdiagnosis among patients with symptoms initially thought to be benign represents an important step forward in quantifying diagnostic error that can easily be incorporated in to SPADE.
Interpreting harms from misdiagnosis with comparators
Once a SPADE analysis is complete, there is an unfortunate tendency in the literature to compare adverse clinical outcomes between initially misdiagnosed patients versus patients with the symptoms or disease of interest who were correctly diagnosed initially.(10, 43) However, from the perspective of measuring misdiagnosis-related harms, the key question is not whether those initially misdiagnosed have similar or dissimilar mortality or other adverse outcomes to those correctly diagnosed, but whether correctly diagnosing those initially misdiagnosed would reduce patient harms.(23) To answer this counterfactual question, risk adjustments for baseline clinical severity are essential when making comparisons. Since it is very difficult to adjust for clinical severity using administrative claims data, SPADE analyses that rely on these data sources should not be used for evaluating outcomes of potential diagnostic errors. Indeed, prior authors have clearly demonstrated that baseline clinical severity frequently confounds the relationship between initial diagnostic evaluation and outcome event. For example, in a study of patients with subarachnoid hemorrhage, those who were misdiagnosed were 1.7-fold less likely to be dead within 12 months than those initially diagnosed correctly—this would seem to imply a health “benefit” of being misdiagnosed. But, when the analysis is restricted to a subgroup of patients with the same initial symptom severity this implication is disproven. Specifically, among subarachnoid hemorrhage patients who present with headache without changes in mental status (Hunt-Hess Grade I or II), misdiagnosed patients are 4.7-fold more likely to be dead within 12 months. This subgroup analysis indicates that in fact diagnostic error was associated with adverse outcomes at 12 months in the relevant subgroup.(44) Similar studies looking at functional outcomes have also found adverse effects of delayed diagnosis in the subgroup of SAH patients with good Hunt-Hess grades.(45)
Conclusion
In this manuscript, we have outlined additional approaches to aide in the selection of comparator groups and statistical analysis of these comparisons to improve the validity and reliability of SPADE. We recommend choosing symptom-disease pairs based on the known pathophysiology of the disease and symptoms of interest using comparison cohorts, both negative and positive controls, in two directions of analysis. In general, inter-group comparisons require the most careful consideration with regard to potential confounders. Once a pair is established, misdiagnosis-related harms can be assessed using the look-forward direction with direct adjustment for risk factors or propensity score matching to increase the accuracy of diagnostic error estimates using the SPADE approach. In closing, the use of comparison groups and the analytical methods outlined above are a helpful way to improve the validity of our operationalizable measurement strategy to estimate diagnostic error rates using large datasets.
Funding:
NIH research grant K23NS107643 supports Dr. Liberman. NIH research grant R01AG068002 supports Dr. Wang. NIH research grant K23NS112459 supports Dr. Johansen. AHRQ research grant R01HS027614 supports Drs. Wang, Zhu, Hassoon, Austin, and Newman-Toker. Dr. Newman-Toker’s effort was also partially supported by the Armstrong Institute Center for Diagnostic Excellence. No financial support for this study was provided by contract with any other agency, foundation, company, institute, or philanthropic foundation.
Footnotes
Disclosures:
Dr. Newman-Toker conducts research related to diagnosis of dizziness and stroke, as well as diagnostic error (including the SPADE method). He serves as the principal investigator for multiple grants and contracts on these topics. Johns Hopkins has been loaned research equipment (video-oculography [VOG] systems) by two companies for use in Dr. Newman-Toker’s research; one of these companies has also provided funding for research on diagnostic algorithm development related to dizziness, inner ear diseases, and stroke. Dr. Newman-Toker has no other financial interest in these or any other companies. Dr. Newman-Toker is an inventor on a provisional patent (US No. 62/883,373) for smartphone-based stroke diagnosis in patients with dizziness. He gives frequent academic lectures on these topics and occasionally serves as a medico-legal consultant for both plaintiff and defense in cases related to dizziness, stroke, and diagnostic error. There are no other conflicts of interest. None of the authors have any financial or personal relationships with other people or organizations that could inappropriately influence (bias) their work.
References
- 1.EP Balogh, BT Miller, JR Ball, editors. Improving Diagnosis in Health Care. Washington (DC). 2015. [Google Scholar]
- 2.Graber ML. The incidence of diagnostic error in medicine. BMJ Qual Saf. 2013;22 Suppl 2:ii21–ii7. [DOI] [PMC free article] [PubMed] [Google Scholar]
- 3.Liberman AL, Newman-Toker DE. Symptom-Disease Pair Analysis of Diagnostic Error (SPADE): a conceptual framework and methodological approach for unearthing misdiagnosis-related harms using big data. BMJ Quality & Safety. 2018;27(7):557–66. [DOI] [PMC free article] [PubMed] [Google Scholar]
- 4.Newman-Toker DE. A unified conceptual model for diagnostic errors: underdiagnosis, overdiagnosis, and misdiagnosis. Diagnosis. 2014;1(1):43–8. [DOI] [PMC free article] [PubMed] [Google Scholar]
- 5.Newman-Toker DE, Pronovost PJ. Diagnostic errors--the next frontier for patient safety. JAMA. 2009;301(10):1060–2. [DOI] [PMC free article] [PubMed] [Google Scholar]
- 6.Kerber KA, Newman-Toker DE. Misdiagnosing Dizzy Patients: Common Pitfalls in Clinical Practice. Neurol Clin. 2015;33(3):565–75, viii. [DOI] [PMC free article] [PubMed] [Google Scholar]
- 7.Dubosh NM, Edlow JA, Goto T, Camargo CA, Jr., Hasegawa K. Missed Serious Neurologic Conditions in Emergency Department Patients Discharged With Nonspecific Diagnoses of Headache or Back Pain. Ann Emerg Med. 2019. [DOI] [PubMed] [Google Scholar]
- 8.Kim AS, Fullerton HJ, Johnston SC. Risk of vascular events in emergency department patients discharged home with diagnosis of dizziness or vertigo. Ann Emerg Med. 2011;57(1):34–41. [DOI] [PubMed] [Google Scholar]
- 9.Newman-Toker DE, Moy E, Valente E, Coffey R, Hines AL. Missed diagnosis of stroke in the emergency department: a cross-sectional analysis of a large population-based sample. Diagnosis (Berl). 2014;1(2):155–66. [DOI] [PMC free article] [PubMed] [Google Scholar]
- 10.Liberman AL, Gialdini G, Bakradze E, Chatterjee A, Kamel H, Merkler AE. Misdiagnosis of Cerebral Vein Thrombosis in the Emergency Department. Stroke. 2018;49(6):1504–6. [DOI] [PMC free article] [PubMed] [Google Scholar]
- 11.Atzema CL, Grewal K, Lu H, Kapral MK, Kulkarni G, Austin PC. Outcomes among patients discharged from the emergency department with a diagnosis of peripheral vertigo. Ann Neurol. 2016;79(1):32–41. [DOI] [PubMed] [Google Scholar]
- 12.Grewal K, Austin PC, Kapral MK, Lu H, Atzema CL. Missed strokes using computed tomography imaging in patients with vertigo: population-based cohort study. Stroke. 2015;46(1):108–13. [DOI] [PubMed] [Google Scholar]
- 13.Chang TP, Bery AK, Wang Z, Sebestyen K, Ko YH, Liberman AL, et al. Stroke hospitalization after misdiagnosis of “benign dizziness” is lower in specialty care than general practice: a population-based cohort analysis of missed stroke using SPADE methods. Diagnosis (Berl). 2021;9(1):96–106. [DOI] [PubMed] [Google Scholar]
- 14.Cifra CL, Westlund E, Ten Eyck P, Ward MM, Mohr NM, Katz DA. An estimate of missed pediatric sepsis in the emergency department. Diagnosis (Berl). 2021;8(2):193–8. [DOI] [PMC free article] [PubMed] [Google Scholar]
- 15.Horberg MA, Nassery N, Rubenstein KB, Certa JM, Shamim EA, Rothman R, et al. Rate of sepsis hospitalizations after misdiagnosis in adult emergency department patients: a look-forward analysis with administrative claims data using Symptom-Disease Pair Analysis of Diagnostic Error (SPADE) methodology in an integrated health system. Diagnosis (Berl). 2021;8(4):479–88. [DOI] [PubMed] [Google Scholar]
- 16.Miller AC, Arakkal AT, Koeneman S, Cavanaugh JE, Gerke AK, Hornick DB, et al. Incidence, duration and risk factors associated with delayed and missed diagnostic opportunities related to tuberculosis: a population-based longitudinal study. BMJ Open. 2021;11(2):e045605. [DOI] [PMC free article] [PubMed] [Google Scholar]
- 17.Miller AC, Polgreen LA, Cavanaugh JE, Hornick DB, Polgreen PM. Missed Opportunities to Diagnose Tuberculosis Are Common Among Hospitalized Patients and Patients Seen in Emergency Departments. Open Forum Infect Dis. 2015;2(4):ofv171. [DOI] [PMC free article] [PubMed] [Google Scholar]
- 18.Nassery N, Horberg MA, Rubenstein KB, Certa JM, Watson E, Somasundaram B, et al. Antecedent treat-and-release diagnoses prior to sepsis hospitalization among adult emergency department patients: a look-back analysis employing insurance claims data using Symptom-Disease Pair Analysis of Diagnostic Error (SPADE) methodology. Diagnosis (Berl). 2021;8(4):469–78. [DOI] [PubMed] [Google Scholar]
- 19.Sharp AL, Baecker A, Nassery N, Park S, Hassoon A, Lee MS, et al. Missed acute myocardial infarction in the emergency department-standardizing measurement of misdiagnosis-related harms using the SPADE method. Diagnosis (Berl). 2021;8(2):177–86. [DOI] [PubMed] [Google Scholar]
- 20.Miller AC, Koeneman SH, Arakkal AT, Cavanaugh JE, Polgreen PM. Incidence, Duration, and Risk Factors Associated With Missed Opportunities to Diagnose Herpes Simplex Encephalitis: A Population-Based Longitudinal Study. Open Forum Infect Dis. 2021;8(9):ofab400. [DOI] [PMC free article] [PubMed] [Google Scholar]
- 21.Miller AC, Polgreen PM. Many Opportunities to Record, Diagnose, or Treat Injection Drug-related Infections Are Missed: A Population-based Cohort Study of Inpatient and Emergency Department Settings. Clin Infect Dis. 2019;68(7):1166–75. [DOI] [PubMed] [Google Scholar]
- 22.Tarnutzer AA, Lee SH, Robinson KA, Wang Z, Edlow JA, Newman-Toker DE. ED misdiagnosis of cerebrovascular events in the era of modern neuroimaging: A meta-analysis. Neurology. 2017;88(15):1468–77. [DOI] [PMC free article] [PubMed] [Google Scholar]
- 23.Newman-Toker DE, Wang Z, Zhu Y, Nassery N, Saber Tehrani AS, Schaffer AC, et al. Rate of diagnostic errors and serious misdiagnosis-related harms for major vascular events, infections, and cancers: toward a national incidence estimate using the “Big Three”. Diagnosis (Berl). 2020. [DOI] [PubMed] [Google Scholar]
- 24.Newman-Toker DE, Schaffer AC, Yu-Moe CW, Nassery N, Saber Tehrani AS, Clemens GD, et al. Serious misdiagnosis-related harms in malpractice claims: The “Big Three” - vascular events, infections, and cancers. Diagnosis (Berl). 2019;6(3):227–40. [DOI] [PubMed] [Google Scholar]
- 25.Amarenco P, Lavallee PC, Labreuche J, Albers GW, Bornstein NM, Canhao P, et al. One-Year Risk of Stroke after Transient Ischemic Attack or Minor Stroke. N Engl J Med. 2016;374(16):1533–42. [DOI] [PubMed] [Google Scholar]
- 26.Amarenco P, Lavallee PC, Monteiro Tavares L, Labreuche J, Albers GW, Abboud H, et al. Five-Year Risk of Stroke after TIA or Minor Ischemic Stroke. N Engl J Med. 2018;378(23):2182–90. [DOI] [PubMed] [Google Scholar]
- 27.Karras DJ. Statistical methodology: II. Reliability and validity assessment in study design, Part B. Acad Emerg Med. 1997;4(2):144–7. [DOI] [PubMed] [Google Scholar]
- 28.Savitz SI, Caplan LR, Edlow JA. Pitfalls in the diagnosis of cerebellar infarction. Acad Emerg Med. 2007;14(1):63–8. [DOI] [PubMed] [Google Scholar]
- 29.Newman-Toker DE. Missed stroke in acute vertigo and dizziness: It is time for action, not debate. Ann Neurol. 2016;79(1):27–31. [DOI] [PMC free article] [PubMed] [Google Scholar]
- 30.Tuna MA, Rothwell PM, Oxford Vascular S. Diagnosis of non-consensus transient ischaemic attacks with focal, negative, and non-progressive symptoms: population-based validation by investigation and prognosis. Lancet. 2021;397(10277):902–12. [DOI] [PMC free article] [PubMed] [Google Scholar]
- 31.Newman-Toker DE, Hsieh YH, Camargo CA, Jr., Pelletier AJ, Butchy GT, Edlow JA. Spectrum of dizziness visits to US emergency departments: cross-sectional analysis from a nationally representative sample. Mayo Clin Proc. 2008;83(7):765–75. [DOI] [PMC free article] [PubMed] [Google Scholar]
- 32.Zhu Y, Wang Z, Liberman AL, Chang TP, Newman-Toker D. Statistical insights for crude-rate-based operational measures of misdiagnosis-related harms. Stat Med. 2021;40(20):4430–41. [DOI] [PMC free article] [PubMed] [Google Scholar]
- 33.Pearl J, (2009). Simpson’s Paradox, Confounding, and Collapsibility In Causality: Models, Reasoning and Inference (2nd ed.). New York: : Cambridge University Press. [Google Scholar]
- 34.Rosenman MB, Oh E, Richards CT, Mendelson S, Lee J, Holl JL, et al. Risk of stroke after emergency department visits for neurologic complaints. Neurol Clin Pract. 2020;10(2):106–14. [DOI] [PMC free article] [PubMed] [Google Scholar]
- 35.Tolles J, Lewis RJ. Time-to-Event Analysis. JAMA. 2016;315(10):1046–7. [DOI] [PubMed] [Google Scholar]
- 36.Hess KR. Graphical methods for assessing violations of the proportional hazards assumption in Cox regression. Stat Med. 1995;14(15):1707–23. [DOI] [PubMed] [Google Scholar]
- 37.Schober P, Vetter TR. Survival Analysis and Interpretation of Time-to-Event Data: The Tortoise and the Hare. Anesth Analg. 2018;127(3):792–8. [DOI] [PMC free article] [PubMed] [Google Scholar]
- 38.Zhu Y, Wang Z, Newman-Toker D. Misdiagnosis-related harm quantification through mixture models and harm measures. Biometrics. 2022. [DOI] [PMC free article] [PubMed] [Google Scholar]
- 39.Austin PC. An Introduction to Propensity Score Methods for Reducing the Effects of Confounding in Observational Studies. Multivariate Behav Res. 2011;46(3):399–424. [DOI] [PMC free article] [PubMed] [Google Scholar]
- 40.Harder VS, Stuart EA, Anthony JC. Propensity score techniques and the assessment of measured covariate balance to test causal associations in psychological research. Psychol Methods. 2010;15(3):234–49. [DOI] [PMC free article] [PubMed] [Google Scholar]
- 41.Liberman AL, Wang C, Friedman BW, Prabhakaran S, Esenwa CC, Rostanski SK, et al. Head Computed tomography during emergency department treat-and-release visit for headache is associated with increased risk of subsequent cerebrovascular disease hospitalization. Diagnosis (Berl). 2020. [DOI] [PubMed] [Google Scholar]
- 42.Haukoos JS, Lewis RJ. The Propensity Score. JAMA. 2015;314(15):1637–8. [DOI] [PMC free article] [PubMed] [Google Scholar]
- 43.Vaillancourt S, Guttmann A, Li Q, Chan IY, Vermeulen MJ, Schull MJ. Repeated emergency department visits among children admitted with meningitis or septicemia: a population-based study. Ann Emerg Med. 2015;65(6):625–32 e3. [DOI] [PubMed] [Google Scholar]
- 44.Kowalski RG, Claassen J, Kreiter KT, Bates JE, Ostapkovich ND, Connolly ES, et al. Initial misdiagnosis and outcome after subarachnoid hemorrhage. JAMA. 2004;291(7):866–9. [DOI] [PubMed] [Google Scholar]
- 45.Ois A, Vivas E, Figueras-Aguirre G, Guimaraens L, Cuadrado-Godia E, Avellaneda C, et al. Misdiagnosis Worsens Prognosis in Subarachnoid Hemorrhage With Good Hunt and Hess Score. Stroke. 2019;50(11):3072–6. [DOI] [PubMed] [Google Scholar]