

Abstract
Triple oxygen isotope ratios offer new opportunities to improve reconstructions of past climate by quantifying evaporation, relative humidity, and diagenesis in geologic archives. However, the utility of in paleoclimate applications is hampered by a limited understanding of how precipitation values vary across time and space. To improve applications of , we present , d-excess, and data from 26 precipitation sites in the western and central United States and three streams from the Willamette River Basin in western Oregon. In this data set, we find that precipitation tracks evaporation but appears insensitive to many controls that govern variation in , including Rayleigh distillation, elevation, latitude, longitude, and local precipitation amount. Seasonality has a large effect on variation in the data set and we observe higher seasonally amount-weighted average precipitation values in the winter (40 ± 15 per meg [± standard deviation]) than in the summer (18 ± 18 per meg). This seasonal precipitation variability likely arises from a combination of sub-cloud evaporation, atmospheric mixing, moisture recycling, sublimation, and/or relative humidity, but the data set is not well suited to quantitatively assess isotopic variability associated with each of these processes. The seasonal pattern, which is absent in d-excess and opposite in sign from , appears in other data sets globally; it showcases the influence of seasonality on values of precipitation and highlights the need for further systematic studies to understand variation in values of precipitation.
1. Introduction
Ratios of oxygen isotopes (18O/16O, or ) are often used to reconstruct past environmental and climatic conditions (e.g., Koch, 1998; Liu et al., 2017; Rowley, 2007; Zachos et al., 2001). However, interpreting data from geologic archives can be challenging as it is often difficult to attribute variation to specific fractionating processes (e.g., Rech et al., 2019; Thompson et al., 2000; Wostbrock & Sharp, 2021). This challenge can be particularly problematic in terrestrial paleoclimate archives that often integrate information about temperature, seasonality, vegetation cover, evaporation, the amount and isotopic composition of local precipitation, atmospheric and oceanic conditions, and biological physiology (e.g., Breecker et al., 2009; Bryant & Froelich, 1995; Kelson et al., 2020; Kohn, 1996; Quade et al., 2007). Differentiating among these controls is a critical component to improving reconstructions of past climate.
Recent advances in characterizing distributions of 17O, the third and least abundant stable isotope of oxygen, demonstrate potential for using 17O/16O ratios to help constrain interpretations of records (see recent reviews by Aron et al., 2021a; Galewsky et al., 2016; Passey & Levin, 2021; Surma et al., 2021). The power of measurements comes from assessing how their distributions vary from expected relationships with values. When used in studies of the hydrosphere (past and present), the parameter is defined as the deviation from a reference relationship between and (Barkan & Luz, 2007):
| (1) |
where , R is the ratio of heavy-to-light isotopes, and is the logarithmic version of ; Miller, 2002). The slope of the reference relationship , 0.528, was initially thought to approximate the global relationship through meteoric water and (Luz & Barkan, 2010; Meijer & Li, 1998), but recent studies indicate this value is biased high by polar waters (Aron et al., 2021a; Miller, 2018; Sharp et al., 2018). Still, we continue to use 0.528 in the definition of to maintain consistency with previous work; this value also has a mechanistic significance as it is nearly identical to the slope during Rayleigh distillation (Luz & Barkan, 2010).
The last several years have produced a spate of studies that showcase the utility of high-precision analysis for reconstructing past environments. This work has shown how data from sediments and fossils can be used to account for the effects of evaporation to reconstruct the values of meteoric waters (e.g., Passey & Ji, 2019), identify shifts in paleohydrology (e.g., Evans et al., 2018; Gázquez et al., 2020), serve as a proxy for paleo-humidity (Alexandre et al., 2018; Gázquez et al., 2018; Lehmann et al., 2022; Sha et al., 2020), refine paleoaltimetry estimates (Chamberlain et al., 2021; Ibarra et al., 2021; Kelson et al., 2022), and detect diagenesis (Gehler et al., 2011; Levin et al., 2014; Sengupta & Pack, 2018; Wostbrock et al., 2020). In each of these examples, brings information beyond what can be determined with the analysis of alone and helps expand the utility of oxygen isotopes for reconstructing climate, hydrology, and elevation in ancient systems.
The sensitivity to evaporation is well documented in geologic materials and waters (Aron et al., 2021a; Beverly et al., 2021; Evans et al., 2018; Gázquez et al., 2020, 2018; Herwartz et al., 2017; Ibarra et al., 2021; Li et al., 2017; Passey et al., 2014; Passey & Ji, 2019; Surma et al., 2015, 2018; Voigt et al., 2021). Understanding the variation in meteoric waters that are relatively unevaporated—these are the waters responsible for the majority of recharge to terrestrial water reservoirs (e.g., lakes, rivers, groundwater, soil water) and are assumed to reflect primarily equilibrium fractionation processes—is critical to these studies, but it is not well defined. Until recently, average meteoric water was thought to have a value of ~33 per meg (Luz & Barkan, 2010) and this value was used as a benchmark in some paleoclimate applications (e.g., Ibarra et al., 2021; Passey & Ji, 2019). However, recent compilations of water and data show that values of meteoric water are regionally variable and that many non-polar waters yield values less than 33 per meg (Aron et al., 2021a; He et al., 2021; Miller, 2018; Sharp et al., 2018). Still, uncertainty around an average value of meteoric water exists because so many surface water data sets focus on waters that experienced extensive evaporation (e.g., Aron et al., 2021a; Bershaw et al., 2020) and all existing precipitation data sets are from single sites (Affolter et al., 2015; Beverly et al., 2021; Gázquez et al., 2017; Gimenez et al., 2021; He et al., 2021; Landais et al., 2010; Surma et al., 2018; Tian et al., 2021; Tian & Wang, 2019; Uechi & Uemura, 2019).
Here, we present precipitation , d-excess, and data from 26 sites in the western and central United States and stream , d-excess, and data from the Willamette River Basin in western Oregon. The distribution of sample sites and collection times make this data set ill-suited for spatial or temporal analysis, but we use the data set to evaluate variation in precipitation values in the North America, compare stream and precipitation values, and begin to determine the range of amount-weighted precipitation values in North America.
2. Isotope Systematics
The utility of triple oxygen isotope ratios in paleoclimate and hydrologic applications relies on characterizing differences in the linear relationships between and during equilibrium and kinetic fractionation. This approach is similar to the framework used to infer climatic and hydrologic information from and values in which most meteoric waters plot on a line with a slope of 8, reflecting equilibrium fractionation (Craig, 1961; Dansgaard, 1964; Horita & Wesolowski, 1994; Majoube, 1971), and processes involving kinetic fractionation with a lower slope (~2.5–8; Brady & Hodell, 2021; Gonfiantini et al., 2018). Analogous to , d-excess quantifies the deviation from a reference relationship (Dansgaard, 1964), where
| (2) |
The d-excess parameter provides information on non-equilibrium processes and has been used extensively to characterize evaporation during evapotranspiration, moisture transport, and precipitation (see Bowen et al., 2019; Galewsky et al., 2016; Gat, 1996). The magnitude of d-excess is controlled mainly by relative humidity during kinetic fractionation (Craig & Gordon, 1965) and by temperature during equilibrium fractionation (Majoube, 1971).
Following similar principles as d-excess, values of water track hydrological processes because there are distinct relationships for equilibrium and kinetic fractionation. The slope is higher (0.529) during equilibrium fractionation (Barkan & Luz, 2005; Young et al., 2002) and lower during kinetic fractionation (0.5185–0.5188; Barkan & Luz, 2007; Hellmann & Harvey, 2020). Distinctions between the reference slope (0.528) and slopes associated with fractionation mean that is more sensitive to processes involving kinetic fractionation (e.g., diffusive effects during evaporation) than equilibrium fractionation and most rainout processes because these fractionation slopes are very close to the reference slope. Given a minimal sensitivity of to temperature, the combined use of and d-excess holds promise for characterizing variations in moisture source relative humidity and temperature (e.g., Uechi & Uemera, 2019) and for constraining rain re-evaporation (e.g., Landais et al., 2010). When evaporation drives isotopic fractionation, d-excess and co-vary linearly (e.g., Landais et al., 2010; Li et al., 2017; Surma et al., 2018). In other circumstances, the lack of a relationship between d-excess and has been used to identify processes such as mixing and recycling (e.g., Landais et al., 2010; Voigt et al., 2021). Studies of precipitation, vapor, and lakes show that the combination of d-excess and make a powerful tool for understanding hydrological and meteorological processes (e.g., Galewsky et al., 2016; Landais, Steen-Larsen, et al., 2012; Pierchala et al., 2022). It can be difficult to generate d-excess records in the geologic record, as and are rarely preserved in the same material (e.g., Evans et al., 2018), but records represent an opportunity to track evaporation in ancient waters (lakes, body waters, rivers, soils etc.). Constraints on the values of the starting water that feeds these water bodies are critical for this approach.
3. Materials and Methods
3.1. Sample Collection
Precipitation and stream samples included in this study were selected for triple oxygen isotope analysis from two pre-existing sample sets. First, we selected 109 weekly precipitation samples from the USNIP data set (Welker, 2012) collected in 1997 (n = 19) and 2006 (n = 90) from 22 sites mostly in the western and central United States (Figures 1 and 2, Table S1). Samples were selected to explore the impacts of geography and season on variation in summer (June–August) and winter (December–February) months (Figure 2a). This data set provides an initial view of values of seasonal and annual amount-weighted precipitation in the western and central United States but is too spatially coarse to directly compare site-to-site or sample-to-sample data, characterize relationships between values with local conditions, or evaluate local variations during synoptic events.
Figure 1.
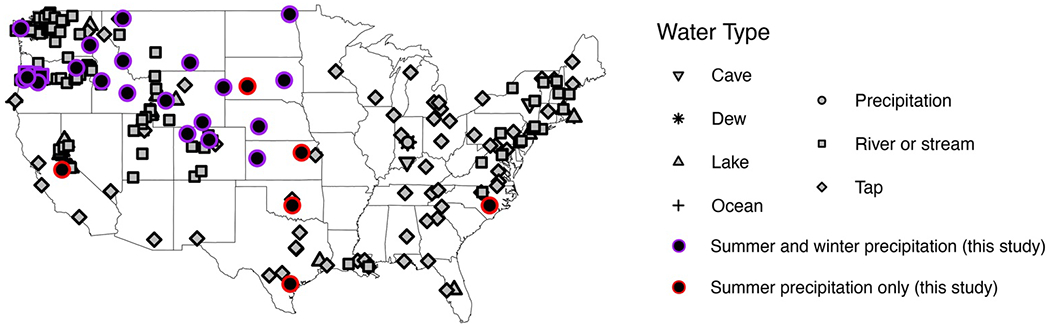
Spatial distribution of previously published (gray filled symbols) and new (black filled symbols) triple oxygen isotope water data from the United States.
Figure 2.

Histograms of seasonal (a) and annual (b) distributions of precipitation samples from this study. Sites are listed longitudinally with western-most sites (Washington and Oregon) on the left and the eastern-most site (North Carolina) on the right. The latitude and longitude of each site is reported in Table S1.
Second, we analyzed and values of 24 weekly precipitation samples from Corvallis, Oregon, and 18 stream samples from the surrounding Willamette River Basin (Table S1; Brooks et al., 2012a, 2012b) to explore seasonal variability and compare values between streams and precipitation. The precipitation samples from Corvallis include one sample per month from February 2009 to December 2010. Stream samples were collected three times per year in 2009 and 2010 to capture spring snowmelt, low summer flow, and winter storms. Stream samples were collected from three small streams in an east-west transect across the Willamette River Basin that vary in distance from the Pacific Ocean and thus vary in precipitation rainout effects. The western most stream was a small stream within the Luckiamute River watershed, an eastward-facing basin that drains the Coast Range (n = 6, 121 m above sea level (masl)) and flows into the western side of the Willamette Valley. The other two small streams were located within North Santiam River watershed, a westward-facing basin that drains the Cascade Mountains (n = 12) and flows into the eastern side of the Willamette Valley. The two North Santiam stream sites varied in elevation (838 masl and 197 masl, n = 6 each).
3.2. Isotopic Analysis
3.2.1. and Measurements
Triple oxygen isotope ratios of waters were analyzed using the cobalt(III) fluoride method developed by Baker et al. (2002) and Barkan and Luz (2005). Measurements were made on a Thermo Scientific MAT 253 isotope ratio mass spectrometer (IRMS) at Johns Hopkins University in 2012–2014, using methods described in Li et al. (2015, 2017) and Passey et al. (2014). All and values were normalized to the VSMOW-SLAP scale using the approach described by Schoenemann et al. (2013), using measurements of VSMOW2 and SLAP2 analyzed concurrently with unknowns. As such, values of were defined as 0% for VSMOW2 and −55.5% for SLAP2, was assumed to be 0% for both VSMOW2 and SLAP2, was defined as 0.528, and was 0% for VSMOW2 and −29.6986% for SLAP2. We monitored analytical performance by regularly analyzing and values of USGS 45, 46, 47, and 48 reference waters and determined that analytical precision (root-mean-square-error) of USGS waters was better than 0.2% for , 0.3% for , and 7 per meg for . See Table S2 for reports of raw and normalized data for standards and unknowns.
3.2.2. and Data
The and data reported in this study are considered part of the primary data set, but were previously published in Brooks et al. (2012a, 2012b) and Welker (2012). USNIP precipitation samples were analyzed at the University of Alaska Anchorage Stable Isotope Lab with a TCEA unit attached to a Thermo Finnigan IRMS (Welker, 2012). Analytical precision of the measurements at the University of Alaska Anchorage (UAA) are 0.2% for and 0.5% for . Stream samples from the Willamette River Basin and precipitation samples from Corvallis, OR were analyzed on a Laser Absorption Water-Vapor Isotope Spectrometer (Los Gatos Research (LGR) Model 908-0004) at the Integrated Stable Isotope Research Facility at the Western Ecology Division of the Environmental Protection Agency (EPA), Corvallis, OR (Brooks et al., 2012a, 2012b). Analytical precision of and values from the EPA measurements are 0.2 and 0.5%, respectively (Brooks et al., 2012a, 2012b). All and data from UAA and the EPA research facility are reported relative to VSMOW.
3.2.3. Data Quality Checks and Caveats
Precipitation and stream samples were stored for up to 15 yr before triple oxygen isotope analysis, so it is important to evaluate sample quality. At EPA, precipitation and stream samples were stored upside-down in 20 ml glass scintillation vials with polycone caps. USNIP samples were stored at UAA in 40 ml screw cap Nalgene bottles at 4°C. These common storage techniques typically preserve the isotopic composition of water samples, but it is important to confirm that isotopic ratios did not drift during storage.
First, to confirm that isotopic ratios did not drift and to evaluate analytical accuracy, we compared the values measured at Johns Hopkins University with those measured at the EPA research facility or UAA. More than 98% of the values measured at Johns Hopkins University are identical (within analytical precision) of those analyzed at EPA or UAA (Figure S1 in Supporting Information S1). Two precipitation samples have values that differ by more than 4%. We can find no clear analytical explanation for such different values. Isotope data from these outliers are reported in Table S1 but are excluded from subsequent analysis.
Second, because the goal of this study is to explore the variability of across the western and central United States, we ensured that our data set is representative of isotopic compositions in this region. To confirm this, we compared the and d-excess values from our data set with previously published data from the western and central United States (Figure S2 in Supporting Information S1) accessed from the University of Utah water isotope database (waterisotopesdb.org; Putman & Bowen, 2019). Both the range and patterns of and d-excess values from our data set are statistically indistinguishable from previously published observations (Welch two sample t test p values > 0.05), so we conclude that our data set is representative of isotopic variability across the western and central United States.
Third, we confirmed the accuracy and precision of our measurements by comparing values of USGS reference waters measured at Johns Hopkins University with other reported values of the same waters (Table S3 in Supporting Information S1). Values of of USGS reference waters reported in this study are statistically indistinguishable from those reported by Aron et al. (2021a) and Berman et al. (2013), so we are confident that the data reported in this study are accurate and precise.
In total, we analyzed and from 151 water samples. Excluding the two precipitation samples with very different (more than 4%) values between Johns Hopkins University and EPA or UAA, the final data set contains 149 samples (18 stream and 131 precipitation samples).
3.3. Meteorological Data
Weekly precipitation amount data were collected at each USNIP site as part of the North American Deposition Program (NADP; http://nadp.slh.wisc.edu/) and at the EPA Western Ecology Division climate station in Corvallis, OR (Brooks et al., 2012a, 2012b). The EPA climate station also recorded temperature and relative humidity. Temperature and relative humidity were not recorded as part of the NADP network, so these data were filled in from nearby National Weather Service meteorological stations from the MesoWest database (https://mesowest.utah.edu/).
3.4. Theoretical Modeling
Simple Rayleigh distillation and evaporation modeling was conducted to compare theoretical , and d-excess values during Rayleigh distillation and pan evaporation with observed precipitation , and d-excess data. Theoretical values were calculated using supplementary script 4 from Aron et al. (2021a) and average meteorological conditions from coastal and near-coastal sites in this study (Olympic National Park, Alsea Guard Ranger Station, H.J. Andrews Experimental Forest, and Corvallis, OR) as the initial conditions for calculations.
4. Results
4.1. General Results
Site information, meteorological data, and isotope data are reported in Table S1. Raw isotope data are reported in Table S2. Values of ranged from −25.2 to 45%, ranged from −13.6 to 2.2%, ranged from −192.9 to 12.3%, d-excess ranged from −59.1 to 17.8%, and ranged from −54 to 71 per meg. As expected, and were strongly correlated (R2 > 0.9999), following a line with a slope 0.5255 ± 0.0002 and intercept −0.002 ± 0.002 (uncertainty on the reported slopes and intercepts is the standard error) that is slightly shallower than the triple oxygen isotope reference line ; Luz & Barkan, 2010; Figure 3a). Values of and were also well correlated (R2 = 0.96) with most points on or slightly below the Global Meteoric Water Line (Craig, 1961). The regression line through observed and values had a slope of 7.2 ± 0.1 and intercept of −1.0 ± 1.3 (Figure 3b).
Figure 3.

Scatterplots of precipitation (filled circles) and stream (open squares) versus (a) and versus (b) from this study. The solid black lines show meteoric water reference lines with slopes of 0.528 and 8 and intercepts of 0 and 10, respectively.
4.2. Precipitation
Annual amount-weighted average precipitation was 31 per meg. Among the precipitation samples, the best-fit linear regression lines were and . Precipitation values were strongly negatively correlated with (Pearson’s r = −0.72, p < 0.05, Figure 4a) and strongly positively correlated with d-excess (r = 0.63, p < 0.05, Figure 4c). The negative correlation between precipitation d-excess and (r = −0.48, p < 0.05, Figure 4b) was weaker than that between and ; much of this negative correlation for d-excess and was related to a handful of samples with low (<0%) d-excess values (Figure S3 in Supporting Information S1). Excluding low d-excess samples, precipitation d-excess and were only weakly correlated (r = −0.29, p < 0.05, Figure 4e) while and remained strongly negatively correlated (r = −0.64, p < 0.05, Figure 4d. Similarly, correlations between , and d-excess and local meteorological conditions such as precipitation amount (r = − 0.20, 0.34, and 0.28, respectively), temperature 0.83, −0.69, −0.31, respectively), and relative humidity (r = −0.45, 0.49, 0.17, respectively) were generally stronger for and than for d-excess (Figure 5, Figure S4 in Supporting Information S1). We used meteorological quarters to consider seasonal patterns, where winter was defined as the months of December-January-February and summer is June-July-August (Table S1). Most precipitation samples in the data set were collected during winter or summer so we focused our comparison on these seasons.
Figure 4.

Scatterplots of versus (a and d), versus d-excess (b and e), and d-excess versus (c and f). Error bars on data show the standard deviation of measurements. Shape differentiates water types and color differentiates seasons. In our study, summer data are in red and winter data are in blue. Among the published data, summer precipitation data are in pink and winter precipitation data are in teal. Precipitation data from spring or fall, or from tropical regions with no clear seasonal climate patterns, are in gray. New surface water data (red from summer, blue from winter) reported in this study are outlined in black. The dotted lines show regression lines through summer (red and pink) and winter (blue and teal) datasets. Panels (a–c) show all the available data points (published studies and this study); panels (d–f) only show data points with positive d-excess and positive values. In each panel, new data reported in this study are shown with solid symbols and previously published data are shown with open symbols. Published precipitation data are from Affolter et al. (2015), Beverly et al. (2021), Gázquez et al. (2017), Gimenez et al. (2021), He et al. (2021), Landais et al. (2010), Luz and Barkan (2010), Surma et al. (2018), Tian et al. (2021, 2019), and Uechi and Uemura (2019). Published river or stream data are from Affolter et al. (2015), Aron et al. (2021a), Bergel et al. (2020), Bershaw et al. (2020), Beverly et al. (2021), Luz and Barkan (2010), Nava-Fernandez et al. (2020), Passey and Ji (2019), Surma et al. (2015), and Voigt et al. (2021). Published tap water are from Aron et al. (2021a), Li et al. (2015, 2017), Luz and Barkan (2010), and Tian et al. (2019). Published lake data are from Aron et al. (2021a), Bershaw et al. (2020), Beverly et al. (2021), Li et al. (2017), Luz and Barkan (2010), Passey and Ji (2019), Surma et al. (2015), Surma et al. (2018), and Voigt et al. (2021).
Figure 5.
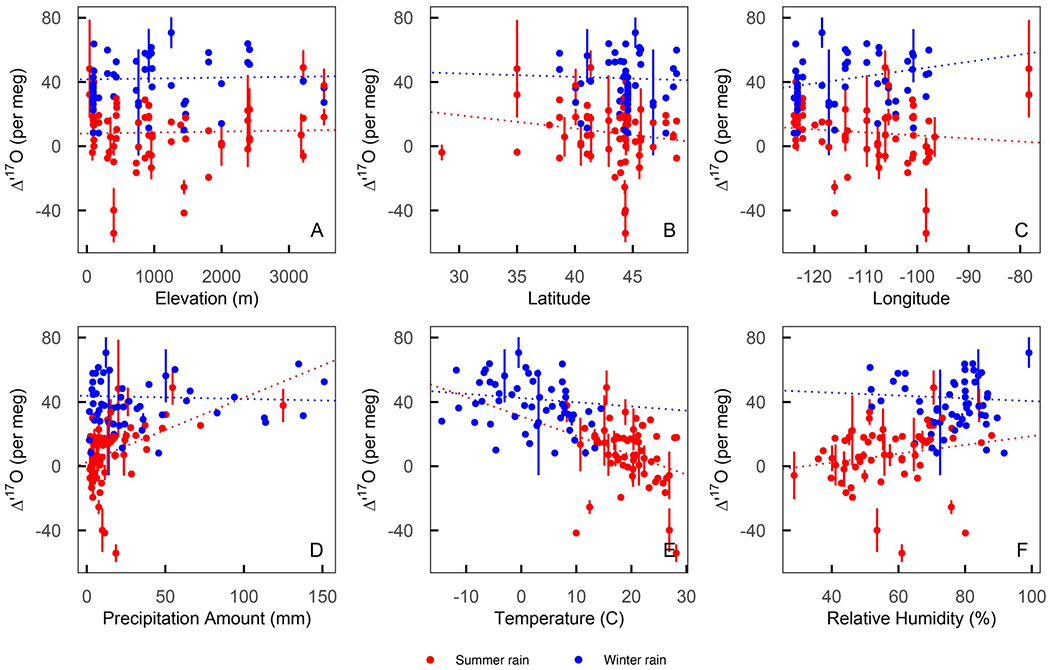
Scatterplots of summer (red) and winter (blue) precipitation versus elevation (a), latitude (b), longitude (c), precipitation amount (d), local average weekly temperature (e), and local average weekly relative humidity (f). The dotted lines show linear regression lines between and each x-axis variable for summer (red) and winter (blue) data.
The most pronounced pattern among the precipitation data was seasonal and variability (Figures 4–6). Across all the years of sample collection and most sites, seasonal amount-weighted precipitation averages were higher in the winter (40 ± 15 per meg), lower in the summer (18 ± 18 per meg), and statistically distinct (p < 0.05, Figure 4). The seasonal pattern of precipitation was opposite, with lower amount-weighted in the winter (−13.0 ± 5.9%) than the summer (−7.0 ± 2.9%). Average seasonal amount-weighted summer and winter d-excess values were nearly indistinguishable (7.0 ± 12.4% and 10.7 ± 4.6%, respectively). These seasonal and patterns were consistent across almost every site but were slightly less pronounced along the Pacific coast and in the Willamette River Basin where the isotopic composition of rain was presumably more closely tied to oceanic moisture source conditions than sites located in the continental interior (Figure 6). Regression lines for and also varied seasonally, with steeper slopes and higher intercepts in the winter than in the summer (Figure S5 in Supporting Information S1).
Figure 6.

Box plots of summer (red) and winter (blue) precipitation , and d-excess (c). Sites are listed longitudinally with western-most sites (Washington and Oregon) on the left and the eastern-most site (North Carolina) on the right. The evaporated precipitation samples are excluded from this figure to highlight seasonal variation and reduce the isotopic ranges. A version of this figure that includes all the precipitation data is included in the Supporting Information (Figure S6 in Supporting Information S1).
This data set does not show clear spatial patterns in precipitation values. Correlations were weak between precipitation , and d-excess with elevation (r = −0.21, 0.02, 0.13, respectively), latitude (r = −0.24, 0.05, −0.16, respectively), and longitude (r = 0.01, −0.11, 0.07, respectively; Figure 5). However, a seasonal difference was found across the Cascade Range, with less seasonal and variability at sites west of the Cascades (OR02, Corvallis, OR10) and pronounced seasonal distinctions at sites east of the Cascades (OR18, Figure 6, Figure S6 in Supporting Information S1). This longitudinal pattern was absent or even slightly reversed for d-excess, which had slightly larger differences (generally > 6.5%) between summer and winter values at sites west of the Cascades and smaller seasonal differences (generally < 5%) at sites east of the Cascades (Figure 6c). Overall, was generally more variable at inland sites than those closer to the Pacific Coast, but proximity to the coast is not a reliable predictor of variability (Figures 5 and 6). Theoretical modeling further confirms that isotopic signals of west-to-east rainout across the western and central United States are not clearly captured in observed precipitation , and d-excess data (Figure 7). Still, the small size of this data set limited exploration of trends in isotopic variation between sampling years or events, within sites, or at a greater spatial resolution.
Figure 7.

Scatterplots of theoretical -excess (b), and (c) undergoing rainout Rayleigh Distillation (filled circles) and pan evaporation (filled squares) in winter (blue) and summer (red) seasons. Initial temperature and relative humidity were 7°C and 83% in the winter and 17°C and 65% in the summer. The pale symbols show observed summer (red) and winter (blue) precipitation data reported in this study. The observed data are plotted versus longitude, with the western-most sites on the left corresponding to coastal air masses that have not lost much moisture and the eastern-most sites on the right corresponding to air masses that have lost much of their moisture. Observations are included in these plots to help contextualize the outputs from these simple modeling exercises in general terms; they are not intended for direct comparison.
4.3. Streams
The isotopic compositions of streams (n = 18) in the Willamette River Basin ranged from −13.0 to −8.4% for , −6.9 to −4.7% for , −89.5 to −59.9% for , 7.6–15.5% or d-excess, and 21 to 37 per meg for . Average and values for the Luckiamute and North Santiam Rivers (30 ± 6 per meg and −10.4 ± 1.7%, respectively) were statistically indistinguishable from the annual amount-weighted average value of precipitation in Corvallis (29 ± 9 per meg and −7.8 ± 2.6%). The best-fit linear regressions through the stream samples were and (Figure 3).
Average d-excess and values were slightly higher (12.6% and 32 per meg, respectively) in the North Santiam streams than for the stream within the Luckiamute River Basin (11.1% and 27 per meg, respectively). However, site-specific isotopic compositions were statistically indistinguishable from each other (p values > 0.05) and there were no clear trends between stream or d-excess along a longitudinal transect (r = 0.31 and 0.44, respectively). Stream , and d-excess values exhibited no seasonal pattern (Figure 4). Stream variation was strongly negatively correlated with elevation (r = −0.990), with lower values (−13.0 to −12.4%) from the high elevation stream on the North Santiam River and higher values (−10.0 to −8.4%) from the stream in the Luckiamute watershed and the low elevation stream in the North Santiam basin.
5. Discussion
5.1. Observations in Context of Prior Studies
In many ways, the observations presented here confirm trends observed of , and d-excess data from precipitation and streams in other mid- and low-latitude regions (e.g., Bershaw et al., 2020; Marchetti & Marchetti, 2019). This growing body of work shows similarities among seasonal distinctions, isotopic relationships between precipitation and stream water, and the precipitation regression slope (Figure 4). We also do not observe relationships between either precipitation or stream values and elevation, precipitation amount, latitude, longitude, or local meteorological conditions (Figure 5), which is consistent with previous work (e.g., Aron et al., 2021a). It is possible that spatial relationships exist, they just are not evident in this data set largely due to the distribution of samples (i.e., samples were collected from different sites at different times and recorded different precipitation events). Additional work to investigate spatial trends is still needed. Despite this limitation, the new data presented here and the existing body of work makes clear two important points: seasonal distinctions in values of precipitation are evident and they are consistent across a variety of geographic and climate regions (see discussion in Section 5.3).
Our observation that the values of stream water in the northwestern U.S. are seasonally invariant and generally less variable than those of precipitation is also consistent with previous studies (Figures 3 and 4). The relatively narrow range of stream values occurs because streams, especially in regions where water supplies are dominated by snowmelt and groundwater-fed recharge, typically integrate annual conditions and reflect the annual amount-weighted average isotopic composition of precipitation (Dutton et al., 2005; Kendall & Coplen, 2001). Streams can have very low values (<~−20 per meg and a larger range than that of precipitation, but these values typically occur in arid regions where slow-flowing streams experience a high degree of evaporation (e.g., Surma et al., 2015; Voigt et al., 2021).
The precipitation regression slope (0.5255) in this data set is lower than the reference value (0.5255); Luz & Barkan, 2010) but is also consistent with previous precipitation observations (Table S4 in Supporting Information S1). This highlights two important points. First, nearly every precipitation slope is less than 0.528. Second, on seasonal timescales, nearly every previous study of precipitation and water vapor has reported higher regression slopes in the winter and lower regression slopes in the summer (Affolter et al., 2015; Gimenez et al., 2021; He et al., 2021; Surma et al., 2021; Tian et al., 2018; Tian & Wang, 2019; Uechi & Uemura, 2019). This seasonal pattern leads to higher values in the winter and lower values in the summer (Figure 4a). This suggests that (a) the relationship of most precipitation samples differs from the reference relationship and (b) that precipitation and values record more than just Rayleigh distillation. Considering that 0.529 is the theoretical slope for equilibrium fractionation, 0.518 is the theoretical slope for kinetic fractionation, and Rayleigh distillation produces slopes of 0.528, the consistent observation that precipitation slopes are less than 0.528 suggests that relationships hold information about both Rayleigh and non-Rayleigh related processes (Aron et al., 2021a; Luz & Barkan, 2010).
5.2. Controls on Precipitation in the Western and Central United States
The consistency among this data set and other triple oxygen isotope studies of precipitation (i.e., precipitation slopes <0.528, seasonal distinctions in precipitation ) suggests systematic controls on , but the fractionating processes responsible for this variation have yet to be conclusively identified. In the next sections, we explore the processes and conditions that may be responsible for the relationships we observe among , d-excess, and values in the western and central United States.
5.2.1. Evaporation
Surface and sub-cloud evaporation are the most well studied processes in the triple oxygen isotope literature. This is likely because the magnitude of variability due to evaporation is often much greater than the analytical precision of measurements, evaporation can be hard to identify with alone, isotopic models of evaporation are well established, and the co-variation of , and d-excess during evaporation is relatively easy to identify. This co-variation includes a negative correlation between and or d-excess, a positive correlation between d-excess and , and d-excess- slopes from ~0.7 to 2 per meg %−1 (e.g., Barkan & Luz, 2007; Landais et al., 2010; Li et al., 2017; Luz & Barkan, 2010).
We observe two signals of sub-cloud evaporation in our precipitation data set. First, a clear signal of evaporation was found among a small (n = 13) subset of summer precipitation samples that have positive values, negative values, negative d-excess values, a strong positive correlation between and d-excess (r = 0.82), and a d-excess slope of 0.7 ± 0.2 per meg %−1 (Figure 4a–4c and Figure S3 in Supporting Information S1). Such low (>~ −10%) d-excess values are unusual for precipitation, but are occasionally observed in western and central United States precipitation (Figure S2 in Supporting Information S1) due to sub-cloud evaporation (e.g., Marchetti & Marchetti, 2019). Evaporation might also have occurred after samples accumulated in the rain collection bucket as these summer precipitation events were small in amount, but this is unlikely because NADP has verified that collection devices essentially eliminate evaporative water loss (Lynch et al., 1996). Second, a weaker signal of evaporation occurred among all the summer rain samples. This evaporation was inferred from seasonal and regression lines (Figure S5 in Supporting Information S1). A strong positive correlation (r = 0.75) and positive slope (1.1 per meg %−1) between summer and d-excess and a slight positive correlation between summer values and local relative humidity (r = 0.19) support this interpretation (Gimenez et al., 2021; Landais et al., 2010). These signals are most likely related to sub-cloud evaporation during small summer storms (e.g., Benjamin et al., 2004; Eastoe & Dettman, 2016; Friedman et al., 2002; Marchetti & Marchetti, 2019). Theoretical evaporation modeling (Figure 7) confirms this and shows that evaporation may explain the isotope ratios of a handful of precipitation samples in this data set, but was not the single controlling mechanism that drives the variation in values in this study.
5.2.2. Relative Humidity
Previous work has shown that precipitation can reflect variations of relative humidity above oceanic moisture sources, along moisture trajectories, and/or at local sample collection sites (e.g., Landais, Steen-Larsen, et al., 2012; Surma et al., 2021; Uechi & Uemura, 2019), but a clear relative humidity- relationship is not observed in this data set. Similarly, precipitation d-excess value and local relative humidity are weakly correlated (r = 0.17) in this data set. The absence of a relationship between and relative humidity may be related to terrestrial water cycling and the interior continental position of many of the sample sites (Fiorella et al., 2018) and/or composite weekly precipitation samples that are not clearly linked to site-specific average weekly relative humidity values.
5.2.3. Rainout
Much like d-excess, is generally insensitive to rainout and Rayleigh distillation because these fractionating processes result in slopes that are nearly identical to the slope of the reference line (0.528, Equation 1). As a result, and variation during rainout occurs along a line that is offset from but essentially parallel to the reference line and values remain nearly constant (Aron et al., 2021a; Luz & Barkan, 2010). In our data set, regardless of season, weak annual correlations between and local precipitation amount (r = 0.34, Figure 5d), elevation (r = 0.02, Figure 5a), latitude (r = 0.05, Figure 5b), and longitude (r = −0.11, Figure 5c) indicate that rainout played a small role in the observed variability. Simple modeling of , and d-excess during Rayleigh distillation (Figure 7) further demonstrates this point.
5.2.4. Sublimation, Stratospheric Intrusions, and Supersaturation
These controls are combined because although they all influence precipitation values (e.g., Schoenemann et al., 2014; Surma et al., 2021; Winkler et al., 2012), they likely play a small role in the observed variation. First, sublimation increases and d-excess values if precipitation condenses from sublimated vapor (Surma et al., 2021), but the lack of seasonal trends in d-excess values (Figure 4) means that sublimation is unlikely to be responsible for the high winter values that we observe. Second, stratospheric intrusions could increase precipitation values without affecting d-excess values by bringing water vapor with exceptionally high (> 1,000 per meg) values into the troposphere (Franz & Röckmann, 2005; Y. Lin et al., 2013; Winkler et al., 2012). However, this is unlikely because (a) stratospheric air is extremely dry and likely contributes very little to near-surface water cycles, (b) the high winter tropopause above North America generally limits stratospheric downdrafts, and (c) near-surface ozone levels, which increase during stratospheric intrusions, were low during the time periods when precipitation samples were collected (Cooper et al., 2012; M. Lin et al., 2015; Miller, 2013). Lastly, precipitation variability has been linked to supersaturation (e.g., Landais, Steen-Larsen, et al., 2012; Schoenemann et al., 2014). We consider this an unlikely explanation for our observations because the magnitude of supersaturation needed for observable fractionation is most common in polar regions where temperatures are very low (>~ −20°C). Further, supersaturation decreases values, which is opposite of the wintertime trends that we observe.
5.3. Seasonal Variability of Precipitation
Seasonal distinctions in precipitation values are the most pronounced pattern in our data set; we observe higher values in the winter and lower values in the summer (Figures 4–6). Similar seasonal distinctions have also been observed in tropical precipitation in north central Africa (Landais et al., 2010) and eastern Singapore (He et al., 2021), mid-latitude precipitation in northwestern Switzerland (Affolter et al., 2015), southern Japan (Uechi & Uemura, 2019), central United States (Tian et al., 2018), and northern Spain (Gimenez et al., 2021), and polar precipitation in Greenland (Landais, Steen-Larsen, et al., 2012) and East Antarctica (Landais, Ekaykin, et al., 2012; Pang et al., 2019; Schoenemann & Steig, 2016; Touzeau et al., 2016). Seasonal variation has also been observed in tap water from the United States (Li et al., 2015) and atmospheric water vapor from central Europe (Surma et al., 2021).
Although seasonal variation has been observed across a wide range of climates and water types around the globe, explanations of this pattern vary widely. Seasonal precipitation variation is often explained by a switch from processes with a greater influence of kinetic fractionation in the summer and to those dominated by equilibrium fractionation in the winter (e.g., Affolter et al., 2015; Landais, Ekaykin, et al., 2012; Tian et al., 2018), but these explanations are not linked to climate conditions or hydrologic processes. In some instances, the seasonal pattern is directly related to the relative humidity at remote moisture sources (e.g., Landais, Steen-Larsen, et al., 2012; Uechi & Uemura, 2019), while in other cases seasonal variation is independent of relative humidity at either moisture source regions or sample collection sites (e.g., He et al., 2021; Li et al., 2015). In the tropics and mid-latitudes, seasonal variation has been linked to upstream moisture recycling (Tian et al., 2018), local raindrop re-evaporation (Gimenez et al., 2021; Landais et al., 2010), and convection tied to ENSO and regional monsoons (He et al., 2021). In snow-covered regions, sublimation can increase the of water vapor that is transported away from a snowpack, increasing the value of downstream precipitation (Pang et al., 2019; Surma et al., 2021). In polar regions, seasonal variations have been linked to the local precipitation rate at collection sites; relative humidity, sea surface temperatures, and the extent of sea ice at oceanic moisture sources; and kinetic fractionation during condensation under very cold, supersaturated conditions (Landais et al., 2008; Landais, Ekaykin, et al., 2012; Landais et al., 2012; Pang et al., 2019; Schoenemann & Steig, 2016; Schoenemann et al., 2014; Winkler et al., 2012).
The seasonal variation in that we observed in our data set likely reflects a combination of the processes listed above. Some of the low values from summer-time precipitation may result from post-condensation evaporation (e.g., Eastoe & Dettman, 2016; Landais et al., 2010), whereas some of the higher winter values may reflect moisture recycling during continental-scale airmass transport (Li et al., 2015; Surma et al., 2021; Tian et al., 2018, 2019). Relative humidity above oceanic moisture sources and atmospheric mixing may be additional drivers of the seasonal signal (Li et al., 2015; Tian et al., 2018). While we cannot attribute seasonal variation in in U.S. precipitation to a single process, we use these data to highlight the seasonal pattern of higher winter values and lower summer values observed in this study and previous work.
5.4. Triple Oxygen Isotope Meteoric Water Line
The triple oxygen isotope meteoric water line was first defined in 2010 from Antarctic snow, Vostok ice (Landais et al., 2008), and a set of surface water, cave water, precipitation, and snow samples collected primarily from Asia and Europe (Luz & Barkan, 2010). This work laid the foundation for more than a decade of research by setting the regression slope through this sample set (0.528 ± 0.001) as the reference slope and establishing the intercept (0.033 ± 0.003) as the average value of meteoric water on Earth. Since 2010, these values have provided a point of reference to evaluate isotopic variability and infer information about hydrology, paleoclimate, paleoaltimetry, and the rock cycle (e.g., Bindeman, 2021; Ibarra et al., 2021; Passey & Levin, 2021).
Since 2010 several studies have used water data to re-evaluate the triple oxygen isotope meteoric water line (Table 1). These re-evaluations are motivated by an understanding that an accurate and representative meteoric water line is critical for applications of in both modern and ancient systems and a growing number of meteoric water data sets. Previously reported regression lines in Table 1 include surface waters that might be evaporated (Aron et al., 2021a; Sharp et al., 2018) or are biased toward polar precipitation (He et al., 2021). By including only precipitation data in this study, we minimize any effects of evaporation and focus on the relationship from non-polar regions.
Table 1.
Slopes and Intercepts of Meteoric Water Regression Lines
| Reference | Slope | Intercept (%) | Observed or defined | Notes |
|---|---|---|---|---|
| Meijer and Li (1998) and Barkan and Luz (2005) | 0.528 | 0 | Defined | Reference relationship |
| Luz and Barkan (2010) | 0.528 | 0.033 | Observed | All available water data |
| Sharp et al. (2018) | 0.5265 | 0.014 | Observed | All water with values > −20% |
| Aron et al. (2021a) | 0.5268 | 0.015 | Observed | All integrated monthly precipitation and flowing rivers |
| He et al. (2021) | 0.5279 | 0.021 | Observed | Tropical, mid-latitude, and polar precipitation and tap water |
| This study | 0.5264 | 0.014 | Observed | Precipitation data only a |
Precipitation data compiled from: Affolter et al. (2015), Aron et al. (2021b), Beverly et al. (2021), Gázquez et al. (2017), Gimenez et al. (2021), He et al. (2021), Landais et al. (2010), Luz and Barkan (2010), Surma et al. (2018), Tian et al. (2019, 2021), and Uechi and Uemura (2019); this study.
Similarities among the slopes and intercepts in Table 1 highlight two important points. First, all of the re-evaluated slopes are less than 0.528, which (a) means that the and values of non-polar precipitation record more than just Rayleigh distillation and (b) sets an expectation that and values from precipitation and flowing surface water should be slightly anticorrelated (Beverly et al., 2021; Li et al., 2017; Passey & Ji, 2019; Surma et al., 2015, 2018; Voigt et al., 2021). Second, the re-evaluated relationships of most non-polar waters have intercepts less than 0.033%. Although 33 per meg has been used as a “typical” value of meteoric water, our results show that this value does not represent either seasonal amount-weighted summer or winter precipitation in the United States. Future studies should reconsider this assumed value for meteoric waters in interpretations and continue to probe the relationship as it may continue to vary with additional spatial and temporal coverage of samples (Putman et al., 2019).
5.5. Utility of in Paleoclimate Applications and Directions of Future Work
Isotopic techniques to quantify evaporation in modern waters are well established with d-excess (e.g., Bowen et al., 2018; Fiorella et al., 2015; Gat, 1996; Tappa et al., 2016; Xia & Winnick, 2021), but the ability to isolate isotopic effects of evaporation has long been a challenge in oxygen isotope paleoclimatology. Reconstructing d-excess is challenging for paleoclimate applications because few geologic materials contain both hydrogen and oxygen, with the notable exceptions of fluid inclusions and gypsum where water itself is preserved (e.g., Evans et al., 2018; Wortham et al., 2022). However, given the consistent response to evaporation, refined estimates of the values of precipitation make it possible to identify evaporation in oxygen-bearing geologic minerals and improve our understanding of paleoclimate and paleoaltimetry (e.g., Evans et al., 2018; Gázquez et al., 2018; Ibarra et al., 2021; Passey & Levin, 2021).
With additional work, seasonal variations of precipitation may also add new information to interpret isotopic records. This could be particularly useful for paleoclimate archives that retain isotopic information about climate conditions but are susceptible to isotopic variations related to both seasonality and evaporative enrichment (e.g., Breecker et al., 2009; Kelson et al., 2020). In future hydrologic applications, precipitation data may shed light on seasonal water use or [CO2 uptake by plants (Allen et al., 2019; Hofmann et al., 2017), distinguish water sources in seasonally snow-dominated watersheds (e.g., Jespersen et al., 2018; Tappa et al., 2016), track seasonal variations in evapotranspiration and boundary layer mixing (e.g., Fiorella et al., 2018; Welp et al., 2012), or monitor groundwater or surface water recharge (e.g., Jasechko et al., 2014; Voigt et al., 2021).
Before launching into new directions of paleoclimate triple oxygen isotope research, it is important to study the range and drivers of modern variability. This is true of all paleoclimate proxies but is especially important for triple oxygen isotopes because is defined as the deviation from a reference relationship and Table 1 shows that most waters follow a shallower slope and have a lower intercept than the canonical empirical relationship. This means that for most applications it will be critical to establish local amount-weighted precipitation values.
Moving forward, additional data from surface water, water vapor, and precipitation are still needed. Future event-scale and/or integrated monthly precipitation samples collected along elevation, latitudinal, and longitudinal transects will be useful to assess spatiotemporal triple oxygen isotope variability and improve interpretations of in paleoclimate applications. Surface water samples, which are logistically easier to collect than rain and are often isotopically similar to annual amount-weighted precipitation, will also be useful to explore spatial patterns and can provide information that is more relevant to the geologic community than individual precipitation samples (e.g., Bershaw et al., 2020).
6. Conclusion
This study presents new precipitation , d-excess, and data from the western and central United States and stream , d-excess, and data from the Willamette River Basin in western Oregon. The key findings are: (a) precipitation slopes often differ from the 0.528 reference value, (b) seasonal amount-weighted precipitation values likely differ for summer and winter, (c) there are different controls on and such that has the potential to bring additional information, and (d) it is critical to establish the local variation before using to characterize evaporation or derive other paleoclimate information.
Putting the data into context with previous work, the most striking feature of precipitation variability is the seasonal distinction in values (higher in the winter, lower in the summer) that is consistent across the globe. These seasonal patterns likely reflect a combination of sub-cloud evaporation, atmospheric mixing, moisture recycling, sublimation, and/or variation in relative humidity at remote moisture sources, along moisture trajectories, and at local collection sites. Additional work is still needed to parse out the fractionating effects of each of these processes on precipitation . Still, it is clear that seasonal variation in values differs from that of and d-excess, indicating that values provide new, complementary information.
Ultimately, controls on precipitation are complex and comprehensive studies to understand the mechanisms driving its variation should be the focus of future work. Results presented here provide an overview of precipitation variability, but do not have the spatial or temporal resolution to systematically understand the fractionating process responsible for the observed variation. Future studies with higher temporal and spatial resolution will help investigate synoptic processes responsible for seasonal variation in precipitation values and to understand spatial variation in . In addition, future studies of water vapor and surface water will be useful to assess the role of atmospheric mixing, evaluate whether can be used to identify moisture source regions in North America, and help refine the slope and intercept of the triple oxygen isotope meteoric water line. Although there is still quite a bit left to understand about , initial results are clear that 33 per meg, which is inferred from the intercept of the original triple oxygen isotope line and assumed to represent the average meteoric water value, can approximate average conditions in some circumstances but might not be appropriate in areas dominated by winter recharge or that have other seasonal dynamics. Future work that refines our understanding of systematics will improve interpretations of triple oxygen isotope data for paleoclimate, paleoaltimetry, paleoecology, and paleo-atmospheric applications.
Supplementary Material
Key Points:
Precipitation slopes often differ from the 0.528 reference value
Precipitation values are typically higher in the winter and lower in the summer
Different controls on and mean that provides new information for paleoclimate reconstructions
Acknowledgments
The authors thank the many individuals who supported this work over the years. The authors thank Rob Coulombe and Warren Evans for sample collection at the Environmental Protection Agency, National Atmospheric Deposition Network site operators for collecting samples that are part of the USNIP sample set, Huanting Hu and Haoyuan Ji for analytical assistance at Johns Hopkins University (JHU), Matt Rogers for analytical assistance at the UAA Stable Isotope Lab, and Ben Passey for useful discussions about the data. The authors also thank Jesse Nusbaumer and Patti Meeks for providing useful reviews of this manuscript. The authors are grateful for the constructive comments of three reviewers and the Associate Editor that improved this manuscript. Acknowledgment is made to the donors of the American Chemical Society Petroleum Research Fund for partial support of this research (ACS PRF# 52642-DNI2), in addition to funding support from Johns Hopkins University. Phoebe Aron received support from Chris Poulsen at the University of Michigan and funding from the Heising-Simons Foundation. Funding from NSF MRI to JMW (# 0953271) supported the USNIP sample analysis at the University of Alaska Anchorage. This manuscript has been subjected to Agency review and has been approved for publication. The views expressed in this paper are those of the author(s) and do not necessarily reflect the views or policies of the U.S. Environmental Protection Agency. Mention of trade names or commercial products does not constitute endorsement or recommendation for use.
Footnotes
Supporting Information:
Supporting Information may be found in the online version of this article.
Data Availability Statement
All isotope data from this study are available on the University of Utah Water Isotope Database under Project ID 00388 (Aron et al., 2023), 00011 (Brooks et al., 2012b), and 00016 (Brooks, 2017).
References
- Affolter S, Häuselmann AD, Fleitmann D, Häuselmann P, & Leuenberger M (2015). Triple isotope study on precipitation, drip water, and speleothem fluid inclusions for a Western Central European cave (NW Switzerland). Quaternary Science Reviews, 127, 73–89. 10.1016/j.quascirev.2015.08.030 [DOI] [Google Scholar]
- Alexandre A, Landais A, Vallet-Coulomb C, Piel C, Devidal S, Pauchet S, et al. (2018). The triple oxygen isotope composition of phytoliths as a proxy of continental atmospheric humidity: Insights from climate chamber and climate transect calibrations. Biogeosciences, 15(10), 3223–3241. 10.5194/bg-15-3223-2018 [DOI] [Google Scholar]
- Allen ST, Kirchner JW, Braun S, Siegwolf RTW, & Goldsmith GR (2019). Seasonal origins of soil water used by trees. Hydrology and Earth System Sciences, 23(2), 1199–1210. 10.5194/hess-23-1199-2019 [DOI] [Google Scholar]
- Aron PG, Li S, Brooks JR, Welker JM, & Levin NE (2023). Seasonal variations in triple oxygen isotope ratios of precipitation in the western and central United States—Final Data. [Dataset] University of Utah Water Isotope Database. Retrieved from https://wateriso.utah.edu/waterisotopes/pages/spatial_db/SPATIAL_DB.html [DOI] [PMC free article] [PubMed] [Google Scholar]
- Aron PG, Levin NE, Beverly EJ, Huth TE, Passey BH, Pelletier EM, et al. (2021a). Triple oxygen isotopes in the water cycle. Chemical Geology, 565, 120026. 10.1016/j.chemgeo.2020.120026 [DOI] [Google Scholar]
- Aron PG, Poulsen CJ, Fiorella RP, Levin NE, Acosta RP, Yanites JB, & Cassel EJ (2021b). Variability and controls on , d-excess, and in southern Peruvian precipitation. Journal of Geophysical Research: Atmospheres, 126(23), 1–18. 10.1029/2020jd034009 [DOI] [Google Scholar]
- Baker L, Franchi IA, Maynard J, Wright IP, & Pillinger CT (2002). A technique for the determination of 18O/16O and 17O/16O isotopic ratios in water from small liquid and solid samples. Analytical Chemistry, 74(7), 1665–1673. 10.1021/ac010509s [DOI] [PubMed] [Google Scholar]
- Barkan E, & Luz B (2005). High-precision measurements of 17O/16O and 18O/16O ratios in H2O. Rapid Communications in Mass Spectrometry, 19(24), 3737–3742. 10.1002/rcm.2250 [DOI] [PubMed] [Google Scholar]
- Barkan E, & Luz B (2007). Diffusivity fractionations of H2 16O/H2 17O and H2 16O/H2 18O in air and their implications for isotope hydrology. Rapid Communications in Mass Spectrometry, 2l(18), 2999–3005. 10.1002/rcm.3180 [DOI] [PubMed] [Google Scholar]
- Benjamin L, Knobel LL, Hall LF, Cecil LD, & Green JR (2004). Development of a local meteoric water line for Southeastern Idaho, Western Wyoming, and South-Central Montana (pp. 1–23). USGS. [Google Scholar]
- Bergel SJ, Barkan E, Stein M, & Affek HP (2020). Carbonate 17O-excess as a paleo-hydrology proxy: Triple oxygen isotope fractionation between H2O and biogenic aragonite, derived from freshwater mollusks. Geochimica et Cosmochimica Acta, 275, 36–47. 10.1016/j.gca.2020.02.005 [DOI] [Google Scholar]
- Berman ESF, Levin NE, Landais A, Li S, & Owano T (2013). Measurement of , and -excess in water by off-axis integrated cavity output spectroscopy and isotope ratio mass spectrometry. Analytical Chemistry, 85(21), 10392–10398. 10.1021/ac402366t [DOI] [PMC free article] [PubMed] [Google Scholar]
- Bershaw J, Hansen DD, & Schauer AJ (2020). Deuterium excess and 17O-excess variability in meteoric water across the Pacific Northwest, USA. Tellus Series B Chemical and Physical Meteorology, 72, 1–17. 10.1080/16000889.2020.1773722 [DOI] [Google Scholar]
- Beverly EJ, Levin NE, Passey BH, Aron PG, Yarian DA, Page M, & Pelletier EM (2021). Triple oxygen and clumped isotopes in modern soil carbonate along an aridity gradient in the Serengeti, Tanzania. Earth and Planetary Science Letters, 567, 116952. 10.1016/j.eps1.2021.116952 [DOI] [Google Scholar]
- Bindeman IN (2021). Triple oxygen isotopes in evolving continental crust, granites, and clastic sediments. Reviews in Mineralogy and Geochemistry, 86(1), 241–290. 10.2138/rmg.2021.86.08 [DOI] [Google Scholar]
- Bowen GJ, Cai Z, Fiorella RP, & Putman AL (2019). Isotopes in the water cycle: Regional-to global-scale patterns and applications. Annual Review of Earth and Planetary Sciences, 47(1), 453–479. 10.1146/annurev-earth-053018-060220 [DOI] [Google Scholar]
- Bowen GJ, Putman A, Brooks JR, Bowling DR, Oerter EJ, & Good SP (2018). Inferring the source of evaporated waters using stable H and O isotopes. Oecologia, 187(4), 1025–1039. 10.1007/s00442-018-4192-5 [DOI] [PMC free article] [PubMed] [Google Scholar]
- Brady MP, & Hodell DA (2021). Continuous and simultaneous measurement of triple-oxygen and hydrogen isotopes of liquid and vapor during evaporation experiments. Rapid Communications in Mass Spectrometry, 35(10). 10.1002/rcm.9078 [DOI] [PubMed] [Google Scholar]
- Breecker DO, Sharp ZD, & McFadden LD (2009). Seasonal bias in the formation and stable isotopic composition of pedogenic carbonate in modern soils from central New Mexico, USA. Bulletin of the Geological Society of America, 121(3–4), 630–640. 10.1130/B26413.1 [DOI] [Google Scholar]
- Brooks JR (2017). OR Precipitation (EPA). [Dataset] University of Utah Water Isotope Database. Retrieved from https://wateriso.utah.edu/waterisotopes/pages/spatial_db/SPATIAL_DB.html [Google Scholar]
- Brooks JR, Wigington PJ, Phillips DL, Comeleo R, & Coulombe R (2012a). Willamette River Basin surface water isoscape and : Temporal changes of source water within the river. Ecosphere, 3(5), art39. 10.1890/es11-00338.1 [DOI] [Google Scholar]
- Brooks JR, Wigington PJ, Phillips DL, Comeleo R, & Coulombe R (2012b). Willamette River Basin surface water isoscape and ): Temporal changes of source water within the river. [Dataset]. University of Utah Water Isotope Database. Retrieved from https://wateriso.utah.edu/waterisotopes/pages/spatial_db/SPATIAL_DB.html [Google Scholar]
- Bryant JD, & Froelich PN (1995). A model of oxygen isotope fractionation in body water of large mammals. Geochimica et Cosmochimica Acta, 59(21), 4523–4537. 10.1016/0016-7037(95)00250-4 [DOI] [Google Scholar]
- Chamberlain CP, Ibarra DE, Kukla T, Methner KA, & Gao Y (2021). Triple oxygen isotope paleoaltimetry of crystalline rocks. Frontiers of Earth Science, 9, 1–6. 10.3389/feart.2021.633687 [DOI] [Google Scholar]
- Cooper OR, Gao RS, Tarasick D, Leblanc T, & Sweeney C (2012). Long-term ozone trends at rural ozone monitoring sites across the United States, 1990–2010. Journal of Geophysical Research, 117(D22), 1990–2010. 10.1029/2012JD018261 [DOI] [Google Scholar]
- Craig H. (1961). Isotopic variations in meteoric waters. Science, 133(3465), 1702–1703. 10.1126/science.133.3465.1702 [DOI] [PubMed] [Google Scholar]
- Craig H, & Gordon LI (1965). Deuterium and oxygen 18 variations in the ocean and the marine atmosphere. In Tongiorgi E (Ed.), Proceedings of a Conference on stable isotopes in oceanographic studies and paleotemperatures (pp. 9–130). Spoleto. [Google Scholar]
- Dansgaard W. (1964). Stable isotopes in precipitation. Tellus, 16(4), 436–468. 10.3402/tellusa.v16i4.8993 [DOI] [Google Scholar]
- Dutton A, Wilkinson BH, Welker JM, Bowen GJ, & Lohmann KC (2005). Spatial distribution and seasonal variation in 18O/ 16O of modern precipitation and river water across the conterminous USA. Hydrological Processes, 19(20), 4121–4146. 10.1002/hyp.5876 [DOI] [Google Scholar]
- Eastoe CJ, & Dettman DL (2016). Isotope amount effects in hydrologic and climate reconstructions of monsoon climates: Implications of some long-term data sets for precipitation. Chemical Geology, 430, 78–89. 10.1016/j.chemgeo.2016.03.022 [DOI] [Google Scholar]
- Evans NP, Bauska TK, Gázquez-Sánchez F, Brenner M, Curtis JH, & Hodell DA (2018). Quantification of drought during the collapse of the classic Maya civilization. Science, 361(6401), 498–501. 10.1126/science.aas9871 [DOI] [PubMed] [Google Scholar]
- Fiorella RP, Poulsen CJ, & Matheny AM (2018). Seasonal patterns of water cycling in a deep, continental mountain valley inferred from stable water vapor isotopes. Journal of Geophysical Research: Atmospheres, 123(14), 7271–7291. 10.1029/2017JD028093 [DOI] [Google Scholar]
- Fiorella RP, Poulsen CJ, Pillco RS, Jeffery ML, & Ehlers TA (2015). Modern and long-term evaporation of central Andes surface waters suggests paleo archives underestimate Neogene elevations. Earth and Planetary Science Letters, 432, 59–72. 10.1016/j.epsl.2015.09.045 [DOI] [Google Scholar]
- Franz P, & Röckmann T (2005). High-precision isotope measurements of H2 16O, H2 17O, H2 18O, and the -anomaly of water vapor in the southern lowermost stratosphere. Atmospheric Chemistry and Physics, 5, 5373–5403. [Google Scholar]
- Friedman I, Smith GI, Johnson CA, & Moscati RJ (2002). Stable isotope compositions of waters in the Great Basin, United States 2. Modern precipitation. Journal of Geophysical Research, 107(D19), ACL15-1–ACL15-22. 10.1029/2001JD000566 [DOI] [Google Scholar]
- Galewsky J, Steen-Larsen HC, Field RD, Worden J, Risi C, & Schneider M (2016). Stable isotopes in atmospheric water vapor and applications to the hydrologic cycle: Isotopes in the Atmospheric Water Cycle. Reviews of Geophysics, 54(4), 809–865. 10.1002/2015RG000512 [DOI] [PMC free article] [PubMed] [Google Scholar]
- Gat JR (1996). Oxygen and hydrogen isotopes in the hydrologic cycle. Annual Review of Earth and Planetary Sciences, 24(1), 225–262. 10.1146/annurev.earth.24.1.225 [DOI] [Google Scholar]
- Gázquez F, Bauska TK, Comas-Bru L, Ghaleb B, Calaforra JM, & Hodell DA (2020). The potential of gypsum speleothems for paleoclimatology: Application to the Iberian Roman Human Period. Scientific Reports, 10, 1–13. 10.1038/s41598-020-71679-3 [DOI] [PMC free article] [PubMed] [Google Scholar]
- Gázquez F, Calaforra JM, Evans NP, & Hodell DA (2017). Using stable isotopes , and D) of gypsum hydration water to ascertain the role of water condensation in the formation of subaerial gypsum speleothems. Chemical Geology, 452, 34–46. 10.1016/j.chemgeo.2017.01.021 [DOI] [Google Scholar]
- Gázquez F, Morellón M, Bauska T, Herwartz D, Surma J, Moreno A, et al. (2018). Triple oxygen and hydrogen isotopes of gypsum hydration water for quantitative paleo-humidity reconstruction. Earth and Planetary Science Letters, 481, 177–188. 10.1016/j.eps1.2017.10.020 [DOI] [Google Scholar]
- Gehler A, Tütken T, & Pack A (2011). Triple oxygen isotope analysis of bioapatite as tracer for diagenetic alteration of bones and teeth. Palaeogeography, Palaeoclimatology, Palaeoecology, 310(1–2), 84–91. 10.1016/j.palaeo.2011.04.014 [DOI] [Google Scholar]
- Gimenez R, Bartolome M, Gazquez F, Iglesias M, & Moreno A (2021). Underlying climate controls in triple oxygen (16O, 17O, 18O) and hydrogen (1H, 2H) isotopes composition of rainfall (Central Pyrenees). Frontiers of Earth Science, 9, 1–16. 10.3389/feart.2021.633698 [DOI] [Google Scholar]
- Gonfiantini R, Wassenaar LI, Araguas-Araguas L, & Aggarwal PK (2018). A unified Craig-Gordon isotope model of stable hydrogen and oxygen isotope fractionation during fresh or saltwater evaporation. Geochimica et Cosmochimica Acta, 235, 224–236. 10.1016/j.gca.2018.05.020 [DOI] [Google Scholar]
- He S, Jackisch D, Samanta D, Yi PKY, Liu G, Wang X, & Goodkin NF (2021). Understanding tropical convection through triple oxygen isotopes of precipitation from the maritime continent. Journal of Geophysical Research: Atmospheres, 126(4), 1–14. 10.1029/2020jd033418 [DOI] [Google Scholar]
- Hellmann R, & Harvey AH (2020). First-principles diffusivity ratios for kinetic isotope fractionation of water in air. Geophysical Research Letters, 47(18), e2020GL089999. 10.1029/2020GL089999 [DOI] [PMC free article] [PubMed] [Google Scholar]
- Herwartz D, Surma J, Voigt C, Assonov S, & Staubwasser M (2017). Triple oxygen isotope systematics of structurally bonded water in gypsum. Geochimica et Cosmochimica Acta, 209, 254–266. 10.1016/j.gca.2017.04.026 [DOI] [Google Scholar]
- Hofmann MEG, Horváth B, Schneider L, Peters W, Schützenmeister K, & Pack A (2017). Atmospheric measurements of in in Göttingen, Germany reveal a seasonal cycle driven by biospheric uptake. Geochimica et Cosmochimica Acta, 199, 143–163. 10.1016/j.gca.2016.11.019 [DOI] [Google Scholar]
- Horita J, & Wesolowski DJ (1994). Liquid-vapor fractionation of oxygen and hydrogen isotopes of water from the freezing to the critical temperature. Geochimica et Cosmochimica Acta, 58(16), 3425–3437. 10.1016/0016-7037(94)90096-5 [DOI] [Google Scholar]
- Ibarra DE, Kukla T, Methner KA, Mulch A, & Chamberlain CP (2021). Reconstructing past elevations from triple oxygen isotopes of lacustrine chert: Application to the Eocene Nevadaplano, Elko Basin, Nevada, United States. Frontiers of Earth Science, 9, 1–19. 10.3389/feart.2021.628868 [DOI] [Google Scholar]
- Jasechko S, Birks SJ, Gleeson T, Wada Y, Fawcett PJ, Sharp ZD, et al. (2014). The pronounced seasonality of global groundwater recharge. Water Resources Research, 50(11), 8845–8867. 10.1002/2014WR015809 [DOI] [Google Scholar]
- Jespersen RG, Leffler AJ, Oberbauer SF, & Welker JM (2018). Arctic plant ecophysiology and water source utilization in response to altered snow: Isotopic and evidence for meltwater subsidies to deciduous shrubs. Oecologia, 187(4), 1009–1023. 10.1007/s00442-018-4196-1 [DOI] [PubMed] [Google Scholar]
- Kelson JR, Huntington KW, Breecker DO, Burgener LK, Gallagher TM, Hoke GD, & Petersen SV (2020). A proxy for all seasons? A synthesis of clumped isotope data from Holocene soil carbonates. Quaternary Science Reviews, 234, 106259. 10.1016/j.quascirev.2020.106259 [DOI] [Google Scholar]
- Kelson JR, Petersen SV, Niemi NA, Passey BH, & Curley AN (2022). Looking upstream with clumped and triple oxygen isotopes of estuarine oyster shells in the early Eocene of California, USA. Geology, 50(7), 755–759. 10.1130/G49634.1 [DOI] [Google Scholar]
- Kendall C, & Coplen TB (2001). Distribution of oxygen-18 and deuterium in river waters across the United States. Hydrological Processes, 15(7), 1363–1393. 10.1002/hyp.217 [DOI] [Google Scholar]
- Koch PL (1998). Isotopic reconstruction of past continental environments. Annual Review of Earth and Planetary Sciences, 26(1), 573–613. 10.1146/annurev.earth.26.1.573 [DOI] [Google Scholar]
- Kohn MJ (1996). Predicting animal : Accounting for diet and physiological adaptation. Geochimica et Cosmochimica Acta, 60(23), 4811–4829. 10.1016/S0016-7037(96)00240-2 [DOI] [Google Scholar]
- Landais A, Barkan E, & Luz B (2008). Record of and 17O-excess in ice from Vostok Antarctica during the last 150,000 yr. Geophysical Research Letters, 35(2), 1–5. 10.1029/2007GL032096 [DOI] [Google Scholar]
- Landais A, Ekaykin A, Barkan E, Winkler R, & Luz B (2012). Seasonal variations of 17O-excess and d-excess in snow precipitation at Vostok station, East Antarctica. Journal of Glaciology, 58(210), 725–733. 10.3189/2012JoG11J237 [DOI] [Google Scholar]
- Landais A, Risi C, Bony S, Vimeux F, Descroix L, Falourd S, & Bouygues A (2010). Combined measurements of 17O-excess and d-excess in African monsoon precipitation: Implications for evaluating convective parameterizations. Earth and Planetary Science Letters, 298(1–2), 104–112. 10.1016/j.eps1.2010.07.033 [DOI] [Google Scholar]
- Landais A, Steen-Larsen HC, Guillevic M, Masson-Delmotte V, Vinther B, & Winkler R (2012). Triple isotopic composition of oxygen in surface snow and water vapor at NEEM (Greenland). Geochimica et Cosmochimica Acta, 77,304–316. 10.1016/j.gca.2011.11.022 [DOI] [Google Scholar]
- Lehmann SB, Levin NE, Passey BH, Hu H, Cerling TE, Miller JH, et al. (2022). Triple oxygen isotope distribution in modern mammal teeth and potential geologic applications. Geochim Cosmochim Acta, 331, 105–122. 10.1016/j.gca.2022.04.033 [DOI] [Google Scholar]
- Levin NE, Raub TD, Dauphas N, & Eiler JM (2014). Triple oxygen isotope variations in sedimentary rocks. Geochimica et Cosmochimica Acta, 139, 173–189. 10.1016/j.gca.2014.04.034 [DOI] [Google Scholar]
- Li S, Levin NE, & Chesson LA (2015). Continental scale variation in 17O-excess of meteoric waters in the United States. Geochimica et Cosmochimica Acta, 164, 110–126. 10.1016/j.gca.2015.04.047 [DOI] [Google Scholar]
- Li S, Levin NE, Soderberg K, Dennis KJ, & Caylor KK (2017). Triple oxygen isotope composition of leaf waters in Mpala, central Kenya. Earth and Planetary Science Letters, 468, 38–50. 10.1016/j.eps1.2017.02.015 [DOI] [Google Scholar]
- Lin M, Fiore AM, Horowitz LW, Langford AO, Oltmans SJ, Tarasick D, & Rieder HE (2015). Climate variability modulates western U.S. ozone air quality in spring via deep stratospheric intrusions. Nature Communications, 6, 1–11. 10.1038/ncomms8105 [DOI] [PMC free article] [PubMed] [Google Scholar]
- Lin Y, Clayton RN, Huang L, Nakamura N, & Lyons JR (2013). Oxygen isotope anomaly observed in water vapor from Alert, Canada and the implication for the stratosphere. Proceedings of the National Academy of Sciences of the United States of America, 110(39), 15608–15613. 10.1073/pnas.1313014110 [DOI] [PMC free article] [PubMed] [Google Scholar]
- Liu Z, Tang Y, Jian Z, Poulsen CJ, Welker JM, & Bowen GJ (2017). Pacific North American circulation pattern links external forcing and North American hydroclimatic change over the past millennium. Proceedings of the National Academy of Sciences of the United States of America, 114(13), 3340–3345. 10.1073/pnas.1618201114 [DOI] [PMC free article] [PubMed] [Google Scholar]
- Luz B, & Barkan E (2010). Variations of 17O/ 16O and 18O/ 16O in meteoric waters. Geochimica et Cosmochimica Acta, 74(22), 6276–6286. 10.1016/j.gca.2010.08.016 [DOI] [Google Scholar]
- Lynch JA, Bowersox VC, & Grimm JW (1996). Trends in precipitation chemistry in the United States, 1983–1994—An analysis of the effects of precipitation chemistry of phase I of the Clean Air Act Amendments of 1990, title IV (pp. 99–111). U.S. Geological Survey. [Google Scholar]
- Majoube M. (1971). Fractionnement en oxygène 18 et en deutérium entre l’eau et sa vapeur. Journal de Chimie Physique, 68, 1432–1436. 10.1051/jcp/1971681423 [DOI] [Google Scholar]
- Marchetti DW, & Marchetti SB (2019). Stable isotope compositions of precipitation from Gunnison, Colorado 2007–2016: Implications for the climatology of a high-elevation valley. Heliyon, 5(7), e02120. 10.1016/j.heliyon.2019.e02120 [DOI] [PMC free article] [PubMed] [Google Scholar]
- Meijer HAJ, & Li WJ (1998). The use of electrolysis for accurate and isotope measurements in water. Isotopes in Environmental and Health Studies, 34(4), 349–369. 10.1080/10256019808234072 [DOI] [Google Scholar]
- Miller MF (2002). Isotopic fractionation and the quantification of anomalies in the oxygen three-isotope system: An appraisal and geochemical significance. Geochimica et Cosmochimica Acta, 66(11), 1881–1889. 10.1016/s0016-7037(02)00832-3 [DOI] [Google Scholar]
- Miller MF (2013). Oxygen isotope anomaly not present in water vapor from Alert, Canada. Proceedings of the National Academy of Sciences of the United States of America, 110(48), 4567. 10.1073/pnas.1318925110 [DOI] [PMC free article] [PubMed] [Google Scholar]
- Miller MF (2018). Precipitation regime influence on oxygen triple-isotope distributions in Antarctic precipitation and ice cores. Earth and Planetary Science Letters, 481, 316–327. 10.1016/j.eps1.2017.10.035 [DOI] [Google Scholar]
- Nava-Fernandez C, Hartland A, Gázquez F, Kwiecien O, Marwan N, Fox B, et al. (2020). Pacific climate reflected in Waipuna Cave drip water hydrochemistry. Hydrology and Earth System Sciences, 24(6), 3361–3380. 10.5194/hess-24-3361-2020 [DOI] [Google Scholar]
- Pang H, Hou S, Landais A, Delmotte VM, Jouzel J, Steen-Larsen HC, et al. (2019). Influence of summer sublimation on D, , and in precipitation, East Antarctica, and implications for climate reconstruction from ice cores. Journal of Geophysical Research: Atmospheres, 124, 7339–7358. 10.1029/2018JD030218 [DOI] [Google Scholar]
- Passey BH, Hu H, Ji H, Montanari S, Li S, Henkes GA, & Levin NE (2014). Triple oxygen isotopes in biogenic and sedimentary carbonates. Geochimica et Cosmochimica Acta, 141, 1–25. 10.1016/j.gca.2014.06.006 [DOI] [Google Scholar]
- Passey BH, & Ji H (2019). Triple oxygen isotope signatures of evaporation in lake waters and carbonates: A case study from the western United States. Earth and Planetary Science Letters, 518, 1–12. 10.1016/j.eps1.2019.04.026 [DOI] [Google Scholar]
- Passey BH, & Levin NE (2021). Triple oxygen isotopes in carbonates, biological apatites, and continental paleoclimate reconstruction. Reviews in Mineralogy and Geochemistry, 86(1), 429–462. 10.2138/rmg.2021.86.13 [DOI] [Google Scholar]
- Pierchala A, Rozanski K, Dulinski M, & Gorczyca Z (2022). Triple-isotope mass balance of mid-latitude, groundwater controlled lake. Science of the Total Environment, 814, 151935. 10.1016/j.scitotenv.2021.151935 [DOI] [PubMed] [Google Scholar]
- Putman AL, & Bowen GJ (2019). Technical note: A global database of the stable isotopic ratios of meteoric and terrestrial waters. Hydrology and Earth System Sciences, 23(10), 4389–4396. 10.5194/hess-23-4389-2019 [DOI] [Google Scholar]
- Putman AL, Fiorella R, Bowen GJ, & Cai Z (2019). A global perspective on local meteoric water lines: Metaanalytic insight into fundamental controls and practical constraints. Water Resources Research, 55(8), 6896–6910. 10.1029/2019WR025181 [DOI] [Google Scholar]
- Quade J, Rech JA, Latorre C, Betancourt JL, Gleeson E, & Kalin MTK (2007). Soils at the hyperarid margin: The isotopic composition of soil carbonate from the Atacama Desert, Northern Chile. Geochimica et Cosmochimica Acta, 71(15), 3772–3795. 10.1016/j.gca.2007.02.016 [DOI] [Google Scholar]
- Rech JA, Currie BS, Jordan TE, Riquelme R, Lehmann SB, Kirk-Lawlor NE, et al. (2019). Massive middle Miocene gypsic paleosols in the Atacama Desert and the formation of the Central Andean rain-shadow. Earth and Planetary Science Letters, 506, 184–194. 10.1016/j.eps1.2018.10.040 [DOI] [Google Scholar]
- Rowley DB (2007). Stable isotope-based paleoaltimetry: Theory and validation. Reviews in Mineralogy and Geochemistry, 66(1), 23–52. 10.2138/rmg.2007.66.2 [DOI] [Google Scholar]
- Schoenemann SW, Schauer AJ, & Steig EJ (2013). Measurement of SLAP2 and GISP O and proposed VSMOW-SLAP normalization for and 17O-excess. Rapid Communications in Mass Spectrometry, 27(5), 582–590. 10.1002/rcm.6486 [DOI] [PubMed] [Google Scholar]
- Schoenemann SW, & Steig EJ (2016). Seasonal and spatial variations of 17O-excess and d-excess in Antarctic precipitation: Insights from an intermediate complexity isotope model. Journal of Geophysical Research: Atmospheres, 121(19), 11215–11247. 10.1002/2016JD025117.Received [DOI] [Google Scholar]
- Schoenemann SW, Steig EJ, Ding Q, Markle BR, & Schauer AJ (2014). Triple water-isotopologue record from WAIS Divide, Antarctica: Controls on glacial-interglacial changes in 17O-excess of precipitation. Journal of Geophysical Research: Atmospheres, 119(14), 8741–8763. 10.1002/2014JD021770.Received [DOI] [Google Scholar]
- Sengupta S, & Pack A (2018). Triple oxygen isotope mass balance for the Earth’s oceans with application to Archean cherts. Chemical Geology, 495, 18–26. 10.1016/j.chemgeo.2018.07.012 [DOI] [Google Scholar]
- Sha L, Mahata S, Duan P, Luz B, Zhang P, Baker J, et al. (2020). A novel application of triple oxygen isotope ratios of speleothems. Geochimica et Cosmochimica Acta, 270, 360–378. 10.1016/j.gca.2019.12.003 [DOI] [Google Scholar]
- Sharp ZD, Wostbrock JAG, & Pack A (2018). Mass-dependent triple oxygen isotope variations in terrestrial materials. Geochemical Perspectives Letters, 7, 27–31. 10.7185/geochemlet.1815 [DOI] [Google Scholar]
- Surma J, Assonov S, Bolourchi MJ, & Staubwasser M (2015). Triple oxygen isotope signatures in evaporated water bodies from the Sistan Oasis, Iran. Geophysical Research Letters, 42(20), 8456–8462. 10.1002/2015GL066475 [DOI] [Google Scholar]
- Surma J, Assonov S, Herwartz D, Voigt C, & Staubwasser M (2018). The evolution of 17O-excess in surface water of the arid environment during recharge and evaporation. Scientific Reports, 8, 1–10. 10.1038/s41598-018-23151-6 [DOI] [PMC free article] [PubMed] [Google Scholar]
- Surma J, Assonov S, & Staubwasser M (2021). Triple oxygen isotope systematics in the hydrologic cycle. Reviews in Mineralogy and Geochemistry, 86(1), 401–428. 10.2138/rmg.2021.86.12 [DOI] [Google Scholar]
- Tappa DJ, Kohn MJ, Mcnamara JP, Benner SG, & Flores AN (2016). Isotopic composition of precipitation in a topographically steep, seasonally snow-dominated watershed and implications of variations from the global meteoric water. 4592, 4582–4592. Hydrological%20 Processes, 10.1002/hyp.10940 [DOI] [Google Scholar]
- Thompson LG, Mosley-Thompson E, & Henderson KA (2000). Ice-core palaeoclimate records in tropical South America since the last glacial maximum. Journal of Quaternary Science, 15(4), 377–394. [DOI] [Google Scholar]
- Tian C, Jiao W, Beysens D, Farai Kaseke K, Medici MG, Li F, & Wang L (2021). Investigating the role of evaporation in dew formation under different climates using 17O-excess. Journal of Hydrology, 592, 125847. 10.1016/j.jhydrol.2020.125847 [DOI] [Google Scholar]
- Tian C, & Wang L (2019). Data Descriptor: Stable isotope variations of daily precipitation from 2014 to 2018 in the central United States. Scientific Data, 6, 1–8. 10.1038/sdata.2019.18 [DOI] [PMC free article] [PubMed] [Google Scholar]
- Tian C, Wang L, Kaseke KF, & Bird BW (2018). Stable isotope compositions , and of rainfall and snowfall in the central United States. Scientific Reports, 8, 1–15. 10.1038/s41598-018-25102-7 [DOI] [PMC free article] [PubMed] [Google Scholar]
- Tian C, Wang L, Tian F, Zhao S, & Jiao W (2019). Spatial and temporal variations of tap water 17O-excess in China. Geochimica et Cosmochimica Acta, 260, 1–14. 10.1016/j.gca.2019.06.015 [DOI] [Google Scholar]
- Touzeau A, Landais A, Stenni B, Uemura R, Fukui K, Fujita S, et al. (2016). Acquisition of isotopic composition for surface snow in East Antarctica and the links to climatic parameters. The Cryosphere, 10(2), 837–852. 10.5194/tc-10-837-2016 [DOI] [Google Scholar]
- Uechi Y, & Uemura R (2019). Dominant influence of the humidity in the moisture source region on the 17O-excess in precipitation on a subtropical island. Earth and Planetary Science Letters, 513, 20–28. 10.1016/j.eps1.2019.02.012 [DOI] [Google Scholar]
- Voigt C, Herwartz D, Dorador C, & Staubwasser M (2021). Triple oxygen isotope systematics of evaporation and mixing processes in a dynamic desert lake system. Hydrology and Earth System Sciences, 25(3), 1211–1228. 10.5194/hess-25-1211-2021 [DOI] [Google Scholar]
- Welker JM (2012). ENSO effects on , and d-excess values in precipitation across the U.S. using a high-density, long-term network (USNIP). Rapid Communications in Mass Spectrometry, 26(17), 1893–1898. 10.1002/rcm.6298 [DOI] [PubMed] [Google Scholar]
- Welp LR, Lee X, Griffis TJ, Wen XF, Xiao W, Li S, et al. (2012). A meta-analysis of water vapor deuterium-excess in the midlatitude atmospheric surface layer. Global Biogeochemical Cycles, 26(3), 1–12. 10.1029/2011GB004246 [DOI] [Google Scholar]
- Winkler R, Landais A, Sodemann H, Dümbgen L, Prié F, Masson-Delmotte V, et al. (2012). Deglaciation records of 17O-excess in East Antarctica: Reliable reconstruction of oceanic normalized relative humidity from coastal sites. Climate of the Past, 8, 1–16. 10.5194/cp-8-1-2012 [DOI] [Google Scholar]
- Wortham BE, Montañez IP, Swart PK, Vonhof H, & Tabor C (2022). Variability in effective moisture inferred from inclusion fluid and values in a central Sierra Nevada stalagmite (CA). Quaternary Science Reviews, 279, 107399. 10.1016/j.quascirev.2022.107399 [DOI] [Google Scholar]
- Wostbrock JAG, Brand U, Coplen TB, Swart PK, Carlson SJ, Brearley AJ, & Sharp ZD (2020). Calibration of carbonate-water triple oxygen isotope fractionation: Seeing through diagenesis in ancient carbonates. Geochimica et Cosmochimica Acta, 288, 369–388. 10.1016/j.gca.2020.07.045 [DOI] [Google Scholar]
- Wostbrock JAG, & Sharp ZD (2021). Triple oxygen isotopes in silica—Water and carbonate—Water systems. Reviews in Mineralogy and Geochemistry, 86(1), 367–400. 10.2138/rmg.2021.86.11 [DOI] [Google Scholar]
- Xia Z, & Winnick MJ (2021). The competing effects of terrestrial evapotranspiration and raindrop re-evaporation on the deuterium excess of continental precipitation. Earth and Planetary Science Letters, 572, 117120. 10.1016/j.eps1.2021.117120 [DOI] [Google Scholar]
- Young ED, Galy A, & Nagahara H (2002). Kinetic and equilibrium mass-dependent isotope fractionation laws in nature and their geochemical and cosmochemical significance. Geochimica et Cosmochimica Acta, 66(6), 1095–1104. 10.1016/S0016-7037(01)00832-8 [DOI] [Google Scholar]
- Zachos J, Pagani M, Sloan L, Thomas E, & Billups K (2001). Trends, rhythms, and aberrations in global climate 65 Ma to present (Vol. 292, pp. 686–693). 10.1126/science.1059412 [DOI] [PubMed] [Google Scholar]
Associated Data
This section collects any data citations, data availability statements, or supplementary materials included in this article.
Supplementary Materials
Data Availability Statement
All isotope data from this study are available on the University of Utah Water Isotope Database under Project ID 00388 (Aron et al., 2023), 00011 (Brooks et al., 2012b), and 00016 (Brooks, 2017).