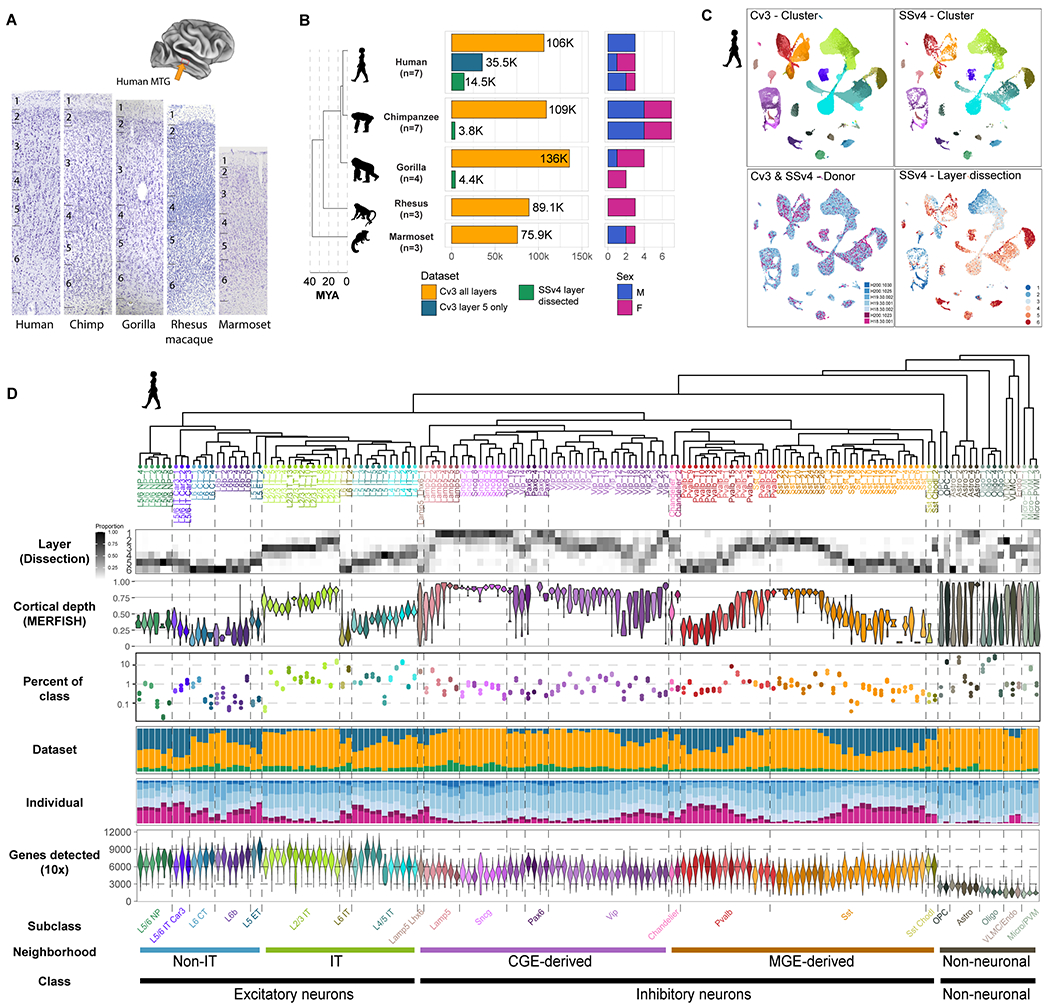
Fig. 1. Transcriptomic cell type taxonomies of human and NHP MTG.

(A) Approximate MTG region dissected from human brain (inset). Representative Nissl-stained cross-sections of MTG in the five species profiled. (B) Phylogeny of species (left; MYA, millions of years ago) and barplots of QC-passing nuclei (center) and sampled individuals (right) for each dataset. (C) UMAP plots of single nuclei from human MTG integrated across individuals and RNA-seq technologies and colored by cluster, individual id, and dissected layer. (D) Human taxonomy dendrogram based on Cv3 cluster median expression. Heatmap of laminar distributions estimated from SSv4 layer dissections. Violin plots of the relative cortical depth (pia to white matter) of cells grouped by type based on in situ measurement of marker expression in human MTG. Dot plot of cell type abundance represented as a proportion of class (excitatory, inhibitory, glia). Error bars denote standard deviation across Cv3 individuals (L5 only dissection excluded). Barplots indicate the proportion of each cluster that is composed of Cv3 all layers, Cv3 layer 5 only, and SSv4 layer dissected datasets. Barplots indicating the proportion of each cluster that is composed of each individual. Violin plots showing the number of unique genes detected from Cv3 datasets.
