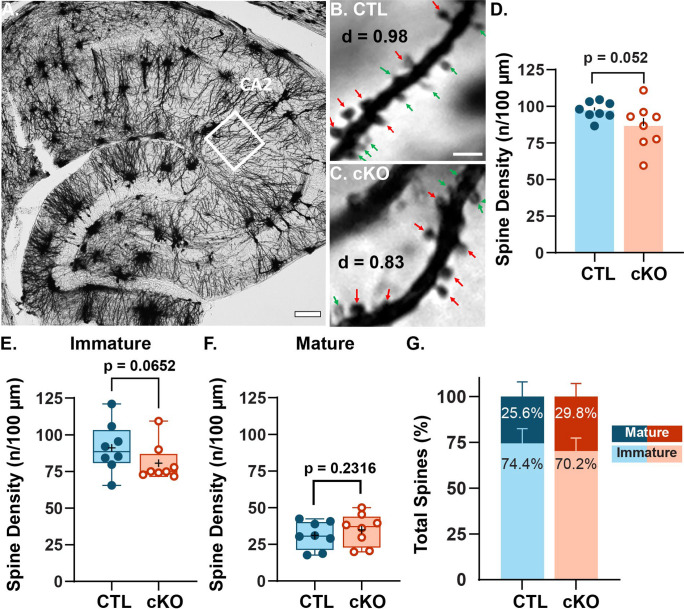
Fig. 3: MCU deletion in CA2 decreases the frequency of immature spines and increases the variability of total spine density.
A. Representative Golgi-Cox stained mouse hippocampus. The white region of interest (ROI) captures CA2 SLM dendrites. Scale = 100 μm.
B-C. Representative images of dendritic spines in CA2 SLM from CTL and MCU cKO mice, respectively. Scale = 2 μm. Immature spine = green, mature spine = red, density (d) = number of spine / length of dendrite
D. Quantification of average spine density in the CA2 SLM of CTL (blue, closed) and MCU cKO (orange, open) mice. The reduction in SLM spine density in MCU cKO is not significant but is trending compared to CTL (p=0.052, Welch’s t-test; N = 8 mice per genotype). However, we note that the significance testing was impacted by the increase in variability per animal in MCU cKO mice compared to CTL (p = 0.022, F = 6.77; F test for variance).
E. Box plot showing immature spine density per animal in CTL and MCU cKO mice. (p= 0.0652, Mann Whitney, one-tailed t-test, N=8 mice per genotype) Immature spines consisted of combined counts for filopodia and thin shaped spines. These data did not have a normal distribution. = average spine density
F. Box plot showing mature spine density per animal in CTL and MCU cKO mice. (p= 0.2316, unpaired one-tailed t-test, N=8 mice per genotype). Note that mature spines consisted of combined counts for stubby, mushroom, and branched shaped spines. = average spine density
G. Bar plot of the distribution of mature and immature spine morphologies in CTL and MCU cKO mice represented as percent of the total spine count.

