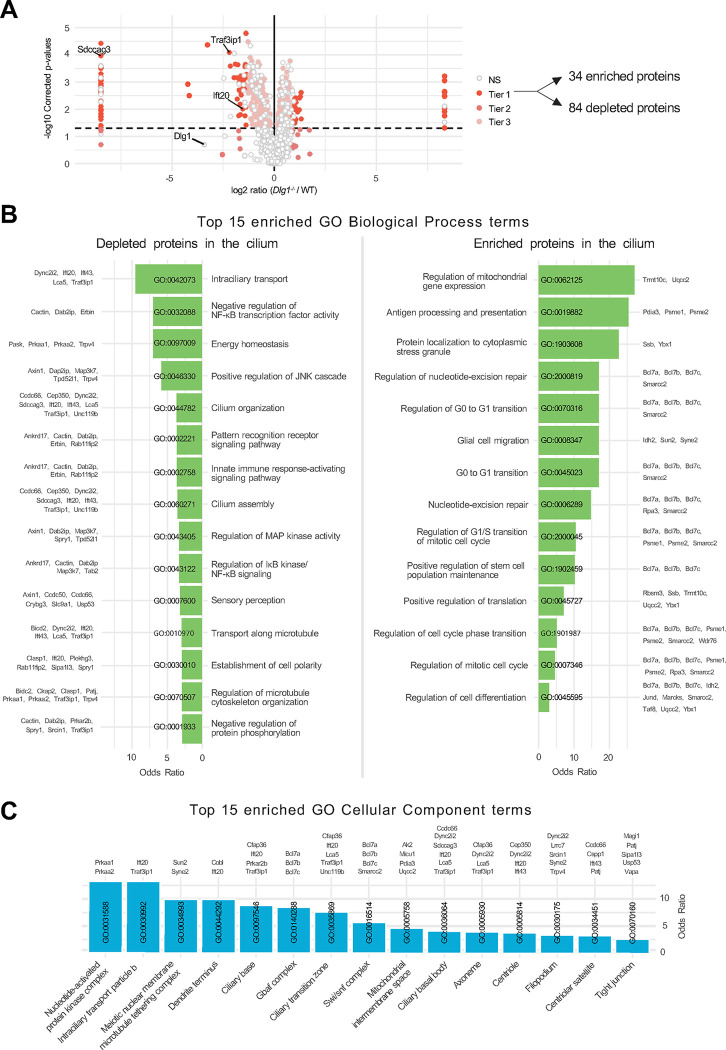
Figure 2. Analysis of cilia mass spectrometry results.
(A) Volcano plot visualizing differential protein expression in the ciliary proteome upon disruption of DLG1. The proteins are colored according to their significance tier (Tier 1, 2, 3, and non-significant (NS)). The total amount of affected candidate ciliary proteins found in Tier 1 upon Dlg1 depletion are highlighted on the right side of the volcano plot, while the proteins related to this research are marked on the volcano plot. The complete list of identified proteins can be found in Supplementary Table S1. (B, C) Gene Ontology enrichment analysis for biological process (B) and cellular component (C) using the proteins found in Tier1. The tables show the top 15 terms that are significantly enriched (Fisher’s exact test value ≤0.05) and are listed in order of their enrichment ratio along with the corresponding GO terms.

