Abstract
Cerebrovascular reactivity (CVR), defined as the ability of cerebral vasculature to dilate in response to a vasodilatory stimulus, is an integral mechanism in brain homeostasis that is thought to be impaired in sickle cell disease (SCD). This study used diffuse correlation spectroscopy and a simple breath-hold stimulus to quantify CVR non-invasively in a cohort of 12 children with SCD and 14 controls. Median [interquartile range] CVR was significantly decreased in SCD compared to controls (2.03 [1.31, 2.44] versus 3.49 [3.00, 4.11] %/mmHg, p = 0.028). These results suggest DCS may provide a feasible means to routinely monitor CVR impairments in pediatric SCD.
1. Introduction
Children with sickle cell disease (SCD) face an increased, life-long risk of neurocognitive comorbidities that are exacerbated by cerebrovascular dysfunction, including stroke and silent cerebral infarction [1]. Cerebrovascular reactivity (CVR), defined as the ability of cerebral vasculature to dilate in response to a vasodilatory stimulus, is an integral mechanism in brain homeostasis. It is thought that CVR is impaired in SCD due to both endothelial dysfunction and persistent vasodilation caused by chronic anemia [2]. Indeed, a handful of publications have demonstrated impairments in both the magnitude and response time of CVR in children [3–6] and adults [7–9] with SCD compared to healthy controls. These impairments are observed globally [4,8,10,11], and the extent of CVR impairment has been shown to be correlated with the degree of anemia [7,12]. Quantification of CVR coupled with medical interventions aimed at restoring abnormal CVR has potential to reduce morbidity and mortality in patients with SCD.
Routine assessment of CVR in the clinical environment requires tolerable vasodilatory stimulus paradigms that can detect deficits in CVR as well as bedside tools capable of quantifying the dynamic cerebral blood flow (CBF) response to the stimulus. Several well-established experimental paradigms exist to study CVR non-invasively [13,14]. The majority of work to date has quantified the CBF response to changes in arterial carbon dioxide content via acetazolamide infusion or inhalation of carbon dioxide (CO2), neither of which are feasible solutions for routine CVR assessment in a clinical environment, particularly in children [14]. More tolerable experimental paradigms, such as a breath-hold challenge [6,15] or natural arterial CO2 fluctuations that occur at rest when freely breathing [13], are largely unexplored in SCD. CBF can be quantified using several neuroimaging techniques, e.g., magnetic resonance imaging (MRI), transcranial Doppler ultrasound (TCD). However, most of these modalities are limited to the research setting and are not feasible for routine CVR assessment in patient care environments due to cost, availability, etc.
Diffuse correlation spectroscopy (DCS) is a non-invasive optical technique to assess CBF that offers many strategic advantages over more traditional perfusion modalities, including portability, low cost, high temporal resolution, direct measure of cortical-level microvascular blood flow, and ease of use in both adults and children in a wide array of clinical indications and environments [16–19]. In this pilot feasibility study, we use DCS to quantify CVR in a cohort of children with SCD along with a population of healthy pediatric controls. We make these assessments both at rest and during a breath-hold challenge. We hypothesize that CVR is reduced in SCD children compared to controls. Further, we hypothesize that CVR obtained during breath-hold agrees with CVR obtained at rest. Finally, we explore whether CVR is associated with age, sex, and hematological biomarkers of anemia.
2. Methods
2.1. Participants
Children ages 6-18 years (inclusive) with and without sickle cell disease were recruited at Emory University and Children’s Healthcare of Atlanta as part of a prospective, cross-sectional pilot study. All protocols were approved by the Emory University Institutional Review Board. Written informed consent was obtained from all parental guardians, and written (11-17 y) or verbal assent (6-10 y) was acquired from each child. For the SCD group, all participants had a diagnosis of sickle cell anemia (SS or Sβ0 genotypes), as confirmed by electrophoresis. Exclusion criteria included history of prior curative therapy (e.g., bone marrow transplant), hypertension, prior overt stroke, transient ischemic attack, vasculopathy, Moyamoya disease, major head injury, or neurological indications not related to SCD (e.g., seizure disorder). Temporary exclusion criteria included recent hospitalization or acute vaso-occlusive crisis within the past 2 weeks or blood transfusion within the past 2 months. For the control group, participants were eligible if they did not have sickle cell disease (any genotype), as reported by family. Exclusion criteria included prior history of anemia-related disorders, cardiovascular disease (e.g., hypertension), chronic respiratory dysfunction (e.g., cystic fibrosis), seizure disorders, cerebrovascular disease, stroke, transient ischemic attack, or renal disease.
2.2. Experimental protocol
All participants were instructed to abstain from stimulants (e.g., caffeine, Adderall) for at least 12 hours prior to study participation. Cerebrovascular reactivity was quantified via two consecutive experimental paradigms: resting state and breath-hold. For resting-state, the participant was directed to breathe naturally, i.e., unpaced, for 10 minutes. For breath-hold, the participant completed 5 end-inspiration breath-hold challenges facilitated by a custom graphical user interface (MATLAB, Mathworks Inc., Natick, MA; Fig. S1-S2). Each challenge consisted of 60 seconds paced breathing tuned to the participant’s native resting respiration rate followed by a 20-30 s end-inspiration breath-hold. A brief training session was performed prior to the start of the protocol to familiarize the participant with the user interface and the breath-hold exercise. This session was also used to tailor the breath-hold duration to the individual’s comfort (typically 20-30 s) and to promote compliance with the exercise. Participants sat upright for the duration of the study protocol.
Continuous (20 Hz) DCS measurements of cerebral blood flow were made by securing an optical sensor on the forehead over the hemisphere that yielded the highest detected light intensities to maximize signal-to-noise ratio. A mask or nasal cannula was placed over the mouth and/or nose to facilitate continuous monitoring of expelled CO2 (4 Hz, LifeSense II, Nonin Medical Inc., Plymouth, MN). In post-processing, a peak detection algorithm in MATLAB (findpeaks) was used to estimate end tidal CO2 (EtCO2) from the expelled CO2 waveform. The EtCO2 time series was visually inspected to remove obvious outliers attributed to irregular breathing or incomplete exhalation. Peripheral oxygen saturation (SpO2, LifeSense II, Nonin Medical, Inc.) and arterial blood pressure (ABP, CNAP Monitor 500, NIPD1000D-1, Biopac Systems) were also continuously monitored at 1 and 125 Hz, respectively (Fig. S3). For the SCD group, a small venous blood sample was acquired within 1 month of CVR assessment (typically on the same day), either as part of routine clinical care or for research. Hemoglobin (Hb, g/dL), hematocrit (Hct, %), and reticulocyte count (1e10/L) were estimated with a complete blood count. Fetal hemoglobin (HbF, %) and sickle hemoglobin (HbS, %) content were estimated from capillary electrophoresis.
2.3. DCS instrumentation
DCS data were acquired with a custom, in-house-built system consisting of a 852 nm long-coherence length laser (iBeam Smart, TOPTICA Photonics, Farmington, New York), two four-channel single photon counting modules (SPCM AQ4C-IO, Perkin-Elmer, Quebec, Canada), and an 8 channel counter/timer data acquisition board (PCIe6612, National Instruments, Austin, TX) that allowed for fast (20 Hz) quantification of the intensity autocorrection function, , at time, t, and delay time, [20]. The patient interface consisted of a flexible optical sensor with two source-detector spacings at 1.0 and 2.5 cm, denoted and , respectively. Seven single mode fibers (780 HP, Thorlabs) were bundled at the detector optode to enhance SNR, while one single mode fiber was used at . Care was taken to ensure compliance with ANSI standards for skin exposure.
2.4. Data processing
To estimate cerebral blood flow, was first averaged across all seven detectors with photon count rates > 10 kHz. Next, to enhance signal-to-noise ratio, both and the averaged were down sampled from 20 to 1 Hz by frame averaging. Then, data from each source-detector spacing were independently fit to the semi-infinite solution to the correlation diffusion equation [16] to extract an index of blood flow ( , cm2/s). Fits were restricted to > 1.2 at to enhance sensitivity to cortical blood flow [21]. In 2 participants, this threshold resulted in < 5 data points. For these individuals, the threshold was loosened to 1.05. For all fits, we assumed a fixed index of refraction of 1.4, and absorption and reduced scattering coefficients at 852 nm of 0.19 and 8.4 cm-1, respectively [22].
For each experimental paradigm, relative change in blood flow index as a function of time ( ) was calculated as where the subscript 0 denotes the mean flow index at during the baseline of the given paradigm. For resting state, baseline was chosen as the 2 minutes at the start of the resting state period. For breath-hold, baseline was chosen as the 30 seconds prior to the first breath-hold epoch. Change in EtCO2 as a function of time was estimated as using the same baseline periods as rBFi. To account for the gas transit time from the mask to the capnogram and the physiological delay between alveolar diffusion of CO2 in the lungs and arterial CO2 reaching the cerebrovasculature to elicit a cerebral blood flow response, we time-aligned and via cross correlation. For this analysis, the EtCO2 time series was incrementally shifted between -5 to 20 s in steps of 0.01 s. For each shift, was interpolated to the time axis, and Pearson’s correlation coefficient between and was estimated. Finally, was shifted by the time lag, that yielded the highest correlation coefficient between and .
2.5. Estimation of CVR
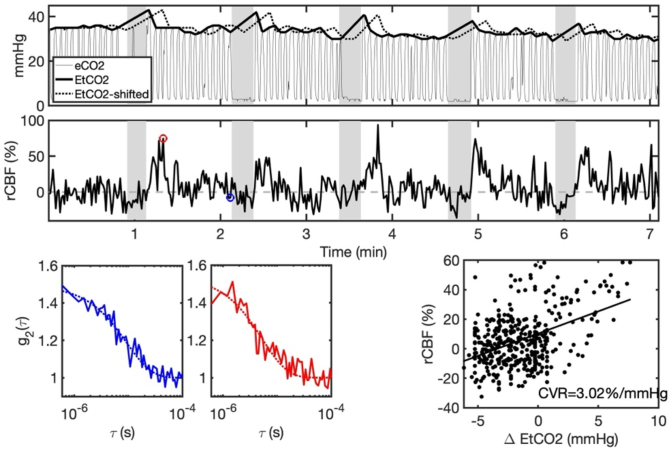
Figure. 1 shows a representative breath hold time series. To estimate CVR for both experimental paradigms, we employed a standard linear regression that assumes a linear relationship between and :
| (1) |
Fig. 1.
Representative breath-hold time series. A) Expelled carbon dioxide content (eCO2) along with estimated end tidal CO2 (EtCO2) during the roughly 7 min breath-hold paradigm. Grey shaded rectangles denote the 5 breath hold epochs. For estimation of cerebrovascular reactivity (CVR), EtCO2 was temporally shifted by time lag, (EtCO2-shifted) to maximize the cross-correlation with the relative change in cerebral blood flow (rCBF, B). C) Measured intensity autocorrelation functions ( , solid lines) and the corresponding best fits to the semi-infinite solution of the correlation diffusion equation (dotted lines) at baseline (blue) and in response to breath hold (red). D) Linear regression between rCBF and EtCO2 was used to estimate CVR as the slope of the line of best fit.
Here reflects CVR (%/mmHg), is the intercept, and ε is the fit residual. For each experimental paradigm (i.e., resting state and breath-hold), linear regression (regress, MATLAB) was applied between the cross-correlated, time-aligned and signals to obtain an estimate of CVR. To ensure that the model explains a significant amount of variability in the data, we discarded CVR estimates for which the model p-value for was > 0.05. We further discarded CVR values < 0. For breath-hold CVR, we required a minimum of 3 consecutive compliant epochs as an additional data quality metric. A compliant epoch was defined as: 1) no evidence of breathing during the breath-hold period, as determined by ethnographic observation and monitoring of the CO2 waveform morphology, and 2) EtCO2 peak after breath-hold greater than 1 mmHg of the EtCO2 immediately before breath-hold. Three participants displayed a substantial (> 5 mmHg) decreasing trend in EtCO2 across the entire breath-hold paradigm duration. For these individuals, only the final 3 epochs where EtCO2 had stabilized were included for analysis.
2.6. Statistical analysis
Summary statistics are presented as median (interquartile range) or count (percentage). First, the non-parametric Wilcoxon rank sum test was used to test differences in all measured parameters (age, sex, weight, height, systolic/diastolic/mean blood pressure, transcutaneous oxygen saturation, CVR, ) between SCD and control groups due to the small sample size. Next, to investigate agreement of CVR between breath-hold and resting state paradigms, data were visually assessed using Bland Altman analysis to quantify the mean bias between the two paradigms [23]. Agreement was quantified with Lin’s Concordance Correlation Coefficient (CCC) [24]. CCC > 0.7 is considered strong agreement. Third, to explore the association between CVR and demographic/hematologic biomarkers, we used univariable linear regression of CVR and age, sex (both SCD and control), as well as between CVR and Hb, Hct, reticulocyte count, HbF, and HbS (SCD only). These associations are presented in terms of the slope estimate for the best fit line between two variables with 95% confidence intervals, Pearson Correlation Coefficient (r) to assess the linear correlation along with its corresponding p-value. Finally, a subgroup analysis was conducted by repeating all previous analyses on a subset of participants with average breath-hold baseline indicative of enhanced brain sensitivity [25]. All statistical analysis was performed in MATLAB. Statistical significance was assessed at the 0.05 confidence level.
3. Results
3.1. Enrollment, data quality, and demographics
A flowchart of the data used for final analysis is shown in Fig. 2. A total of 16 SCD and 18 control children were enrolled but only 13 SCD and 16 control children datasets satisfied our DCS signal quality control criteria. Of these, 10/13 (77%) SCD and 13/16 (81%) controls had breath-hold data that passed quality criteria; 9/10 (90%) SCD and 7/9 (78%) controls had resting state data that passed quality criteria (Fig. 2). Notably, the resting state paradigm was implemented after the initial 12 subjects were recruited, thus fewer resting state datasets were available for analysis; 13 participants (7 SCD and 6 controls) had both resting state and breath hold datasets that passed quality criteria. In total, 12/14 unique SCD/control participants had at least one dataset that was included in the final analysis (Table 1). Fourteen (52%) were female with a median (IQR) age of 11 (10, 13) years. No differences in age, sex, weight, height, blood pressure, or transcutaneous oxygen saturation were observed between groups. Within the SCD group, all patients were taking hydroxyurea per standard of care at a median (IQR) dose of 850 (750, 900) mg/day.
Fig. 2.
Flowchart of data included for analysis. Red indicates n for the sickle cell disease group; black indicates n for the control group. Of the consented participants, the majority completed the full CVR exam that included both breath-hold and resting state assessments, while a subset just completed the breath-hold exam.
Table 1. Participant characteristics a .
| SCD |
Control |
p-value |
|
| N of participants | 12 | 14 | - |
| Age (years) | 11.2 (10.6, 13.1) | 11.5 (8.9, 12.2) | 0.661 |
| Sex (N; % Female) | 6; 50% | 8; 57.1% | - |
| Weight (kg) | 40 (34, 47) | 44 (30, 52) | 0.931 |
| Height (cm) | 144 (142, 155) | 153 (141, 160) | 0.624 |
| Systolic blood pressure (mmHg) | 111 (103, 117) | 91 (65, 118) | 0.290 |
| Diastolic blood pressure (mmHg) | 64 (60, 68) | 58 (65, 66) | 0.218 |
| Mean blood pressure (mmHg) | 80 (78, 83) | 74 (73, 81) | 0.217 |
| Oxygen saturation (%) | 99 (97, 100) | 97 (96, 98) | 0.220 |
| AA (N; %) | 0; 0% | 16; 100% | - |
| SS (N; %) | 11; 100% | 0; 0% | - |
| Hemoglobin (g/dL) | 8.9 (7.9, 9.8) | - | - |
| Hematocrit (%) | 25 (22, 28) | - | - |
| Reticulocytes (1E10/L) | 18 (15, 27) | - | - |
| Fetal hemoglobin (%) | 10 (7, 15) | - | - |
| Sickle hemoglobin (%) | 86 (81, 90) | - | - |
| Hydroxyurea only (N; %) | 8; 66.7% | - | - |
| Voxelotor only (N; %) | 1; 8.3% | - | - |
| Hydroxyurea and Voxelotor (N; %) | 2; 16.7% | - | - |
Data are reported as median (interquartile range) or count (percentage) for the SCD and control participants with data that was included in the final analysis for either breath-hold or resting state paradigms. p-values estimated by Wilcoxon rank sum test.
3.2. CVR comparison among groups
Median [IQR] CVR assessed during the breath-hold paradigm was significantly lower in SCD compared to controls (2.03 [1.31, 2.44] vs. 3.49 [3.00, 4.11] %/mmHg), p = 0.028, Fig. 3). Moreover, median [IQR] , i.e., the time lag between rBFI and EtCO2, was longer in the SCD group compared to controls (11.5 [6.5, 12.3] vs. 6.5 [1.5, 10.5] s), although this trend did not reach statistical significance (p = 0.23, Fig. 4). No differences in average breath hold duration across epochs was observed between groups (24 [21,30] vs. 26 [19,31] s, p = 0.68).
Fig. 3.
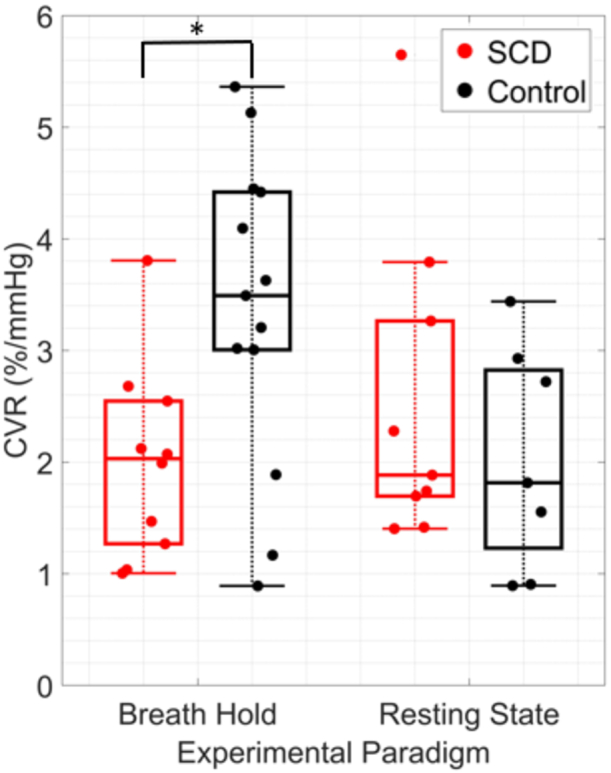
Cerebrovascular reactivity (CVR) by group and experimental paradigm. Boxplots of CVR (%/mmHg) in sickle cell disease (SCD, red) and control (black) groups during breath-hold (left) and resting state (right) experimental paradigms. For each boxplot, the central line denotes the median, the bottom and top edges of the box indicate the 25th and 75th percentiles, respectively, and whiskers extend to the most extreme data not considered outliers. Individual dots represent each participant. *p < 0.05; significance between groups was assessed using a Wilcoxon rank-sum test.
Fig. 4.
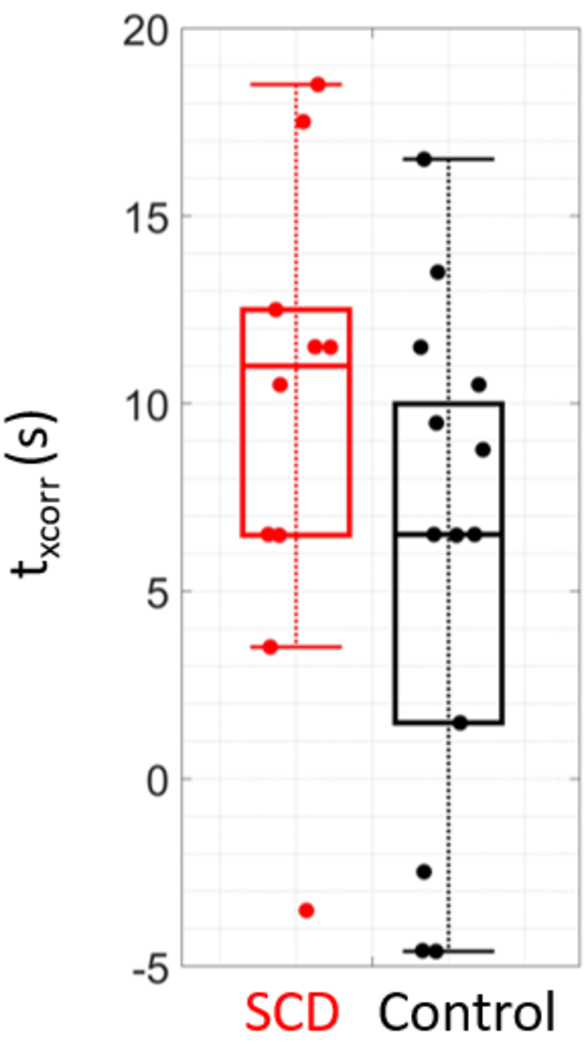
Cross correlation time lag by group. Boxplots of , the time lag that yielded the highest correlation coefficient between blood flow and end tidal CO2 timeseries, for sickle cell (SCD, red, N = 10) and control (black, N = 13) groups in the breath-hold experimental paradigm.
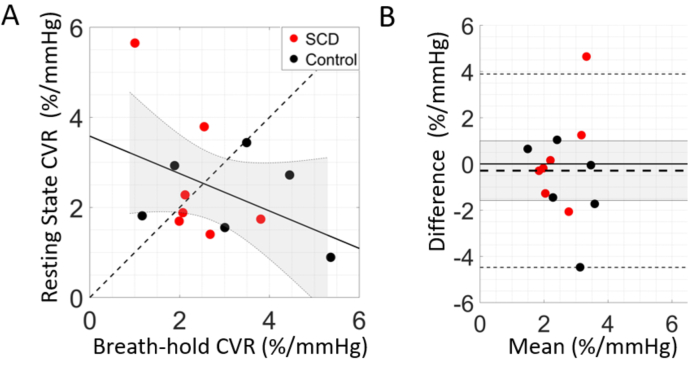
In the resting state paradigm, no CVR differences were observed between groups (median [IQR] of 1.88 [1.69, 3.26] in SCD vs. 1.81 [1.22, 2.82] %/mmHg in controls). Moreover, poor agreement was observed between CVR assessed in breath-hold vs. resting state paradigms in the subset of participants that completed both paradigms (N = 13, CCC = -0.40, Fig. 5). Given the lack of group differentiation in resting state CVR and the poor agreement with breath-hold CVR, we focus the remainder of the analysis on CVR assessed during the breath-hold paradigm.
Fig. 5.
Agreement between cerebrovascular reactivity (CVR) paradigms. (A) CVR assessed during breath-hold versus resting state paradigms (N = 13). The dotted line represents the line of unity, the solid line represents the best linear fit, and the shaded grey region denotes the 95% confidence interval. (B) Bland-Altman plot of the mean CVR between resting state and breath-hold versus the difference. Mean bias is denoted by the horizontal thick dotted black line along with its 95% confidence interval (shaded gray region), line of equality (solid thick black line), and limits of agreement (thin dotted black lines).
3.3. Association of CVR and demographic/hematologic factors
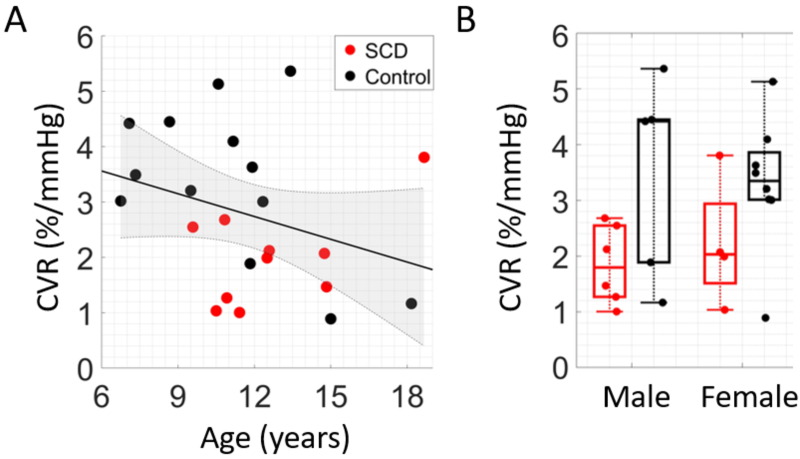
Grouping SCD and control data together, an inverse association between CVR and age was observed (r = -0.31), although this trend did not reach statistical significance (p = 0.14, Fig. 6(A); Table S1). No sex differences in CVR were observed (p = 0.52, Fig. 6(B); Table S1). Within the SCD group, no significant correlations between CVR and hematologic factors were found (Table S2).
Fig. 6.
Association between breath-hold cerebrovascular reactivity (CVR) and demographic factors. (A) Relationship between breath-hold CVR and age. Data points are color coded by group (red = SCD, black = control, N = 23). The solid line (black) represents the best linear fit and shaded region (gray) represents the 95% confidence interval. (B) Boxplot of CVR differences between sexes for SCD (red) and healthy controls (black).
3.4. Subgroup analysis of participants with enhanced brain sensitivity
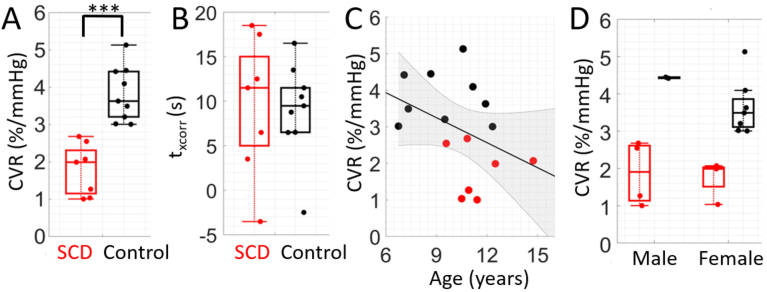
The analyses presented in Sections 3.2–3-3 was repeated in a subgroup of participants with enhanced brain sensitivity, i.e., individuals for whom average breath-hold baseline (7 SCD and 9 controls, Fig. 7). Generally, similar trends were observed in this subgroup analysis, although median [IQR] CVR differences between SCD and controls during the breath-hold paradigm became highly statistically significant (1.99 [1.15, 2.3] vs. 3.62 [3.2, 4.41] %/mmHg, p < 0.001, Fig. 7(A)). The lag time between rBFI and EtCO2 was not statistically significant between groups (p = 0.98, Fig. 7(B)). An inverse trend between CVR and age was still observed (p = 0.14, Fig. 7(C)), and CVR was not different between sexes (Fig. 7(D)). Finally, within the SCD group, a significant inverse correlation between CVR and reticulocyte count emerged (r = -0.90, p = 0.015; Table S3); the remaining correlations with other hematological factors were not statistically significant.
Fig. 7.
Subgroup analysis in participants with enhanced brain-sensitivity. Breath-hold paradigm results from individuals with average resting state . A) Boxplot of cerebrovascular reactivity (CVR, %/mmHg) in sickle cell (SCD, N = 7) and control (N = 9) groups. *** denotes p < 0.001; significance was assessed with a Wilcoxon rank-sum test. B) Boxplots of , the time lag that yielded the highest correlation coefficient between blood flow and end tidal CO2 timeseries. (C) Relationship between CVR and age. The solid line (black) represents the best linear fit and shaded region (gray) represents the 95% confidence interval. (D) Boxplot of CVR in males vs. females. In all plots, red denotes SCD and black denotes controls.
4. Discussion
4.1. Breath-hold demonstrates CVR deficits in SCD children
Here we use DCS for the first time to assess CVR in children with sickle cell disease compared to healthy controls. Using the breath-hold paradigm, we confirmed our primary hypothesis that CVR is significantly lower in SCD vs. controls (Fig. 3). This trend agrees qualitatively with prior literature that observed CVR deficits with other modalities [3,4,12]. Quantitative comparison of our values to those previously published is challenging because of limitations in other datasets, including use of surrogate markers of CBF (e.g., BOLD signal change with MRI), or lack of EtCO2 monitoring to normalize the CBF response. Nevertheless, the ∼40% decrease in CVR in SCD vs. controls is similar to the ∼40-50% decrease previously reported with MRI using hypercapnia [3,4,12]. Thus, our results match expected trends, with the added advantage that they were obtained using a more tolerable and clinically-translatable breath-hold paradigm and lower cost optical neuromonitoring modality.
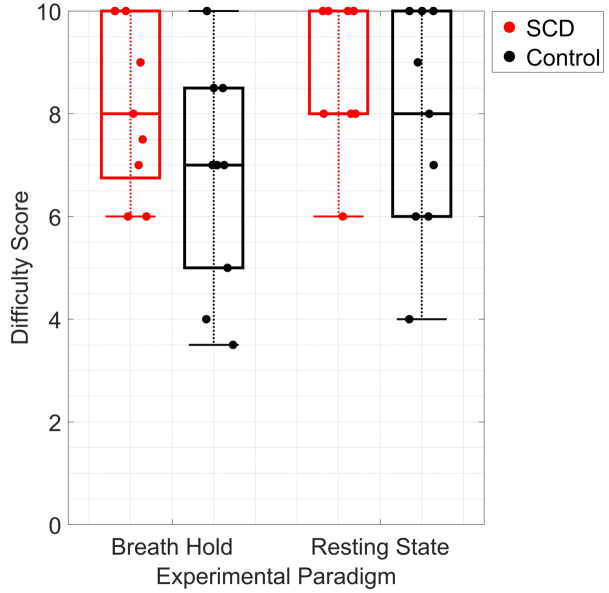
Breath-hold was well tolerated in this pediatric cohort. When asked to evaluate the difficulty of each experimental paradigm on a scale from 0-10, where 10 represents “easiest” and 0 indicates “hardest” difficulty, the median (IQR) breath-hold score was 8 (7, 10) for SCD and 7 (8, 5) for controls (Fig. 8). Comparatively, for the resting state paradigm, the qualitative median (IQR) score was 10 (10, 8) for SCD and 8 (6, 10) for controls. All participants completed the breath-hold exam, and compliance to the protocol was high (∼80% of available epochs were included in the final analysis after applying our quality metrics). The main deviation we observed was the occasional need to adjust the breath-hold time per each participant’s ability. To minimize the amount of equipment interfacing with the participant, we attempted to use a nasal cannula to monitor EtCO2. However, a subset of participants struggled to breathe exclusively through their nose and required frequent coaching during the exam. A properly fitting mask that covers the nose and mouth is recommended for future studies to ensure high fidelity of the EtCO2 trace. Given the high compliance and ease of implementation, this work suggests that CVR assessment with breath-hold coupled with DCS may be feasible for routine screening of cerebrovascular dysfunction in children with SCD as young as 6 y that may one day aid in assessing stroke [26] or guiding therapeutic management (e.g., blood transfusion) [27].
Fig. 8.
Qualitative evaluation of CVR paradigms. Boxplot of difficulty score for each experimental paradigm for SCD (red, N = 8) and healthy control (black, N = 9) participants. Participants were asked “On a scale of 0 to 10, how difficult was the breath-hold/resting state exam?” where 10 represents “easiest” and 0 indicates “hardest” difficulty.
However, limitations in the breath-hold approach remain. First, a nontrivial fraction of data (N = 6/29; ∼21%) did not pass our quality control criteria (Fig. 2). The reason for this poor pass rate is unclear. We noted a trend that baseline was greater than in 30% of data that passed (N = 7/23) versus 67% of data that failed (N = 4/6), suggesting that brain sensitivity may be one factor that influences pass rate. Future work that enhances depth penetration using recent advances in DCS technology would be beneficial [28–33] Second, repeatability, along with the influence of the number of epochs, the length of each epoch, the differences between end-inspiration and end-expiration breath-holds [15], and time of day [34] were not quantified. Future work that explores variation in CVR across days/weeks would be valuable, particularly in children with SCD who often experience periods of relative hemodynamic instability, e.g., due to vaso-occlusive crisis. Third, while useful in an outpatient context given its ease of implementation, the breath-hold task requires active participation, which limits utility in younger children who may struggle to comply with long (20-30 s) breath-holds, in patients with severe conditions, or in sedated individuals [13,35]. Fourth, inherent to the study protocol, EtCO2 data is lacking during the breath-hold, requiring interpolation during the period with null data. Finally, our estimation of CVR is predicated on the assumption of linearity between EtCO2 and CBF. Others have suggested more robust numerical approaches by convolving the EtCO2 signal with a hemodynamic response function that may help to account for any potential nonlinear behavior during the breath-hold [36].
4.2. Resting state CVR
Contrary to the breath-hold paradigm, differences in CVR between groups with the resting state paradigm were not observed. In the subset of participants who had both breath-hold and resting state exams available, we observed poor CVR agreement between the paradigms (Fig. 5(A)). This result, contrary to our hypothesis, suggests that the resting state and breath-hold exams do not yield equivalent CVR values among groups, perhaps indicating that an external stimulus is needed to invoke reliable changes in cerebral blood flow for CVR estimation when assessed by DCS. While assessment of CVR at rest would be ideal for integrating into a clinical workflow, more work is needed to elucidate the clinical value of this resting-state assessment with DCS.
4.3. Factors associated with CVR
In a secondary bivariable analysis, we explored the association of breath-hold CVR with age, sex, and hematologic factors (Fig. 6; Table S1-S2). First, the weak, negative, trending but not significant association between CVR and age (Fig. 6(A)) differed from the result observed by Leung and colleagues in which CVR assessed with BOLD-MRI changes in two phases; increasing until ∼15 years of age then declining through 30 years of age [37]. Caution is warranted in interpreting this discrepancy. This difference may be due to the chosen modality, as the blood-oxygen-level-dependent MRI signal and the cerebral blood flow index DCS signal inherently measure different hemodynamic phenomena. Second, the lack of differences in CVR among sex we observed (Fig. 6(B), Table S1) is consistent with other literature which demonstrated no sex differences [38]. Third, the lack of correlation between CVR and hematocrit concentration (Table S2) differs from the positive association previously observed [12]. This difference may be attributable to the small SCD cohort size and the more limited range of hematocrit observed in our SCD population. Fourth, we observed an inverse correlation between CVR and reticulocyte count that became statistically significant in the sub-analysis of participants with enhanced brain-sensitivity (Table S2). This association, while preliminary, is a novel finding that may reflect a relationship between cerebrovascular health and disease severity. More work is needed to further explore and validate this finding.
4.4. Advantages of DCS as a CVR quantifying platform for children with SCD
The use of DCS as a CVR-quantifying device for routine assessments in clinical environments offers many strategic advantages over existing clinical neuromonitoring platforms. First, DCS is an economically viable alternative to existing neuromonitoring modalities. The capital investment required for a DCS system ( 25-60 K USD) is orders of magnitude less expensive than the capital investment required for an MRI ( 500K-3M + USD) and is comparable to TCD devices. Second, the small and portable form factor of DCS is comparable to existing TCD devices and far more advantageous than existing neuroimaging tools (e.g., MRI). Further, NIRS-based neuromonitoring devices have precedent as FDA-approved commercial medical devices (e.g., INVOS 7100 Regional Oximeter by Medtronic) further demonstrating the feasibility of diffuse optical tools into the clinical environment. Finally, the DCS-measured cerebral blood flow index is thought to be a more direct measure of microvascular CBF than existing bedside modalities like TCD or commercial NIRS. Taken together, DCS offers many unique advantages as a bedside portable CVR-quantifying platform in the clinical environment.
4.5. Study limitations
This study is not without limitations. First, we did not randomize the order of the breath-hold and resting state paradigms among participants. While our experimental design was intended to provide a sufficient resting period prior to the breath-hold exam, the best practice to avoid unintended systematic error would have been to randomize the order. Second, we did not acquire complete blood count panels in healthy children, limiting our ability to compare univariate associations with CVR between the SCD and control populations.
5. Conclusions
In this work, we demonstrate that diffuse correlation spectroscopy is sensitive to CVR impairments in children with sickle cell disease. This work suggests that bedside cerebrovascular function assessment using a breath-hold stimulus with DCS may be a feasible and potentially clinically useful technique to integrate into a routine outpatient clinical workflow for these patients.
Acknowledgments
We thank all the families and children who generously volunteered their time and effort to support this research.
Funding
National Institutes of Health10.13039/100000002 (R01-HL152322).
Disclosures
The authors of this manuscript report no relevant financial interests or other potential conflicts of interest.
Data Availability
Data underlying the results presented in this paper will be available upon publication [39].
Supplemental document
See Supplement 1 (1.3MB, pdf) for supporting content.
References
- 1.Juttukonda M. R., Vaclavu L., Kirkham F. J., Fields M. E., Bush A. M., “Editorial: Cerebral oxygen supply and demand in sickle cell disease: Evidence of local ischemia despite global hyperemia,” Front. Physiol. 13, 1 (2022). 10.3389/fphys.2022.1079889 [DOI] [PMC free article] [PubMed] [Google Scholar]
- 2.Juttukonda M. R., Lee C. A., Patel N. J., Davis L. T., Waddle S. L., Gindville M. C., Pruthi S., Kassim A. A., DeBaun M. R., Donahue M. J., Jordan L. C., “Differential cerebral hemometabolic responses to blood transfusions in adults and children with sickle cell anemia,” Journal of Magnetic Resonance Imaging 49(2), 466–477 (2019). 10.1002/jmri.26213 [DOI] [PMC free article] [PubMed] [Google Scholar]
- 3.Leung J., Duffin J., Fisher J. A., Kassner A., “MRI-based cerebrovascular reactivity using transfer function analysis reveals temporal group differences between patients with sickle cell disease and healthy controls,” NeuroImage: Clinical 12, 624–630 (2016). 10.1016/j.nicl.2016.09.009 [DOI] [PMC free article] [PubMed] [Google Scholar]
- 4.Kim J. A., Leung J., Lerch J. P., Kassner A., “Reduced cerebrovascular reserve is regionally associated with cortical thickness reductions in children with sickle cell disease,” Brain Res. 1642, 263–269 (2016). 10.1016/j.brainres.2016.03.041 [DOI] [PubMed] [Google Scholar]
- 5.Croal P. L., Leung J., Kosinski P., Shroff M., Odame I., Kassner A., “Assessment of cerebral blood flow with magnetic resonance imaging in children with sickle cell disease: A quantitative comparison with transcranial Doppler ultrasonography,” Brain Behav 7(11), e00811 (2017). 10.1002/brb3.811 [DOI] [PMC free article] [PubMed] [Google Scholar]
- 6.Macedo-Campos R. d. S., Adegoke S. A., Figueiredo M. S., Braga J. A. P., Silva G. S., “Cerebral Vasoreactivity in Children with Sickle Cell Disease: A Transcranial Doppler Study,” Journal of Stroke and Cerebrovascular Diseases 27(10), 2703–2706 (2018). 10.1016/j.jstrokecerebrovasdis.2018.05.042 [DOI] [PubMed] [Google Scholar]
- 7.Forté S., Sobczyk O., Poublanc J., Duffin J., Hare G. M. T., Fisher J. A., Mikulis D., Kuo K. H. M., “Sickle cell cerebrovascular reactivity to a CO2 stimulus: Too little, too slow,” Front. Physiol. 13, 55 (2022). 10.3389/fphys.2022.886807 [DOI] [PMC free article] [PubMed] [Google Scholar]
- 8.Sayin E. S., Sobczyk O., Poublanc J., Mikulis D. J., Fisher J. A., Kuo K. H. M., Duffin J., “Assessment of cerebrovascular function in patients with sickle cell disease using transfer function analysis,” Physiol. Rep. 10(19), e15472 (2022). 10.14814/phy2.15472 [DOI] [PMC free article] [PubMed] [Google Scholar]
- 9.Afzali-Hashemi L., Baas K. P. A., Schrantee A., Coolen B. F., van Osch M. J. P., Spann S. M., Nur E., Wood J. C., Biemond B. J., Nederveen A. J., “Impairment of Cerebrovascular Hemodynamics in Patients With Severe and Milder Forms of Sickle Cell Disease,” Front. Physiol. 12, 645205 (2021). 10.3389/fphys.2021.645205 [DOI] [PMC free article] [PubMed] [Google Scholar]
- 10.Poublanc J., Crawley A. P., Sobczyk O., Montandon G., Sam K., Mandell D. M., Dufort P., Venkatraghavan L., Duffin J., Mikulis D. J., Fisher J. A., “Measuring Cerebrovascular Reactivity: The Dynamic Response to a Step Hypercapnic Stimulus,” J. Cereb. Blood Flow Metab. 35(11), 1746–1756 (2015). 10.1038/jcbfm.2015.114 [DOI] [PMC free article] [PubMed] [Google Scholar]
- 11.Sayin E. S., Sobczyk O., Poublanc J., Mikulis D. J., Fisher J. A., Kuo K. H. M., Duffin J., “Assessing Cerebrovascular Resistance in Patients With Sickle Cell Disease,” Front. Physiol. 13, 1 (2022). 10.3389/fphys.2022.847969 [DOI] [PMC free article] [PubMed] [Google Scholar]
- 12.Kosinski P. D., Croal P. L., Leung J., Williams S., Odame I., Hare G. M. T., Shroff M., Kassner A., “The severity of anaemia depletes cerebrovascular dilatory reserve in children with sickle cell disease: a quantitative magnetic resonance imaging study,” Br. J. Haematol. 176(2), 280–287 (2017). 10.1111/bjh.14424 [DOI] [PubMed] [Google Scholar]
- 13.Pinto J., Bright M. G., Bulte D. P., Figueiredo P., “Cerebrovascular Reactivity Mapping Without Gas Challenges: A Methodological Guide,” Front. Physiol. 11, 1 (2021). 10.3389/fphys.2020.608475 [DOI] [PMC free article] [PubMed] [Google Scholar]
- 14.Liu P., De Vis J. B., Lu H., “Cerebrovascular reactivity (CVR) MRI with CO2 challenge: A technical review,” NeuroImage 187, 104–115 (2019). 10.1016/j.neuroimage.2018.03.047 [DOI] [PMC free article] [PubMed] [Google Scholar]
- 15.Urback A. L., MacIntosh B. J., Goldstein B. I., “Cerebrovascular reactivity measured by functional magnetic resonance imaging during breath-hold challenge: A systematic review,” Neurosci. Biobehav. Rev. 79, 27–47 (2017). 10.1016/j.neubiorev.2017.05.003 [DOI] [PubMed] [Google Scholar]
- 16.Durduran T., Choe R., Baker W. B., Yodh A. G., “Diffuse Optics for Tissue Monitoring and Tomography,” Rep. Prog. Phys. 73(7), 076701 (2010). 10.1088/0034-4885/73/7/076701 [DOI] [PMC free article] [PubMed] [Google Scholar]
- 17.Jain V., Buckley E. M., Licht D. J., Lynch J. M., Schwab P. J., Naim M. Y., Lavin N. A., Nicolson S. C., Montenegro L. M., Yodh A. G., Wehrli F. W., “Cerebral oxygen metabolism in neonates with congenital heart disease quantified by MRI and optics,” J Cereb Blood Flow Metab 34(3), 380–388 (2014). 10.1038/jcbfm.2013.214 [DOI] [PMC free article] [PubMed] [Google Scholar]
- 18.Busch D. R., Lynch J. M., Winters M. E., McCarthy A. L., Newland J. J., Ko T., Cornaglia M. A., Radcliffe J., McDonough J. M., Samuel J., Matthews E., Xiao R., Yodh A. G., Marcus C. L., Licht D. J., Tapia I. E., “Cerebral Blood Flow Response to Hypercapnia in Children with Obstructive Sleep Apnea Syndrome,” Sleep 39(1), 209–216 (2016). 10.5665/sleep.5350 [DOI] [PMC free article] [PubMed] [Google Scholar]
- 19.Durduran T., Zhou C., Buckley E. M., Kim M. N., Yu G., Choe R., Gaynor J. W., Spray T. L., Durning S. M., Mason S. E., Montenegro L. M., Nicolson S. C., Zimmerman R. A., Putt M. E., Wang J., Greenberg J. H., Detre J. A., Yodh A. G., Licht D. J., “Optical measurement of cerebral hemodynamics and oxygen metabolism in neonates with congenital heart defects,” J. Biomed. Opt. 15(3), 037004 (2010). 10.1117/1.3425884 [DOI] [PMC free article] [PubMed] [Google Scholar]
- 20.Wang D., Parthasarathy A. B., Baker W. B., Gannon K., Kavuri V., Ko T., Schenkel S., Li Z., Li Z., Mullen M. T., Detre J. A., Yodh A. G., “Fast blood flow monitoring in deep tissues with real-time software correlators,” Biomed. Opt. Express 7(3), 776–797 (2016). 10.1364/BOE.7.000776 [DOI] [PMC free article] [PubMed] [Google Scholar]
- 21.Selb J., Boas D. A., Chan S.-T., Evans K. C., Buckley E. M., Carp S. A., “Sensitivity of near-infrared spectroscopy and diffuse correlation spectroscopy to brain hemodynamics: simulations and experimental findings during hypercapnia,” Neurophotonics 1(1), 015005 (2014). 10.1117/1.NPh.1.1.015005 [DOI] [PMC free article] [PubMed] [Google Scholar]
- 22.Lee S. Y., Cowdrick K. R., Sanders B., Sathialingam E., McCracken C. E., Lam W. A., Joiner C. H., Buckley E. M., “Noninvasive optical assessment of resting-state cerebral blood flow in children with sickle cell disease,” Neurophoton. 6(03), 1 (2019). 10.1117/1.NPh.6.3.035006 [DOI] [PMC free article] [PubMed] [Google Scholar]
- 23.Giavarina D., “Understanding Bland Altman analysis,” Biochem Med 25(2), 141–151 (2015). 10.11613/BM.2015.015 [DOI] [PMC free article] [PubMed] [Google Scholar]
- 24.Lin L. I.-K., “A Concordance Correlation Coefficient to Evaluate Reproducibility,” Biometrics 45(1), 255–268 (1989). 10.2307/2532051 [DOI] [PubMed] [Google Scholar]
- 25.Wu M. M., Perdue K., Chan S.-T., Stephens K. A., Deng B., Franceschini M. A., Carp S. A., “Complete head cerebral sensitivity mapping for diffuse correlation spectroscopy using subject-specific magnetic resonance imaging models,” Biomed. Opt. Express 13(3), 1131 (2022). 10.1364/BOE.449046 [DOI] [PMC free article] [PubMed] [Google Scholar]
- 26.DeBaun M. R., Jordan L. C., King A. A., Schatz J., Vichinsky E., Fox C. K., McKinstry R. C., Telfer P., Kraut M. A., Daraz L., Kirkham F. J., Murad M. H., “American Society of Hematology 2020 guidelines for sickle cell disease: prevention, diagnosis, and treatment of cerebrovascular disease in children and adults,” Blood Adv 4(8), 1554–1588 (2020). 10.1182/bloodadvances.2019001142 [DOI] [PMC free article] [PubMed] [Google Scholar]
- 27.Lee S. Y., Brothers R. O., Turrentine K. B., Quadri A., Sathialingam E., Cowdrick K. R., Gillespie S., Bai S., Goldman-Yassen A. E., Joiner C. H., Brown R. C., Buckley E. M., “Quantifying the Cerebral Hemometabolic Response to Blood Transfusion in Pediatric Sickle Cell Disease With Diffuse Optical Spectroscopies,” Front. Neurol. 13, 1 (2022). 10.3389/fneur.2022.869117 [DOI] [PMC free article] [PubMed] [Google Scholar]
- 28.Ayaz H., Baker W. B., Blaney G., et al. , “Optical imaging and spectroscopy for the study of the human brain: status report,” Neurophoton. 9(S2), S24001 (2022). 10.1117/1.NPh.9.S2.S24001 [DOI] [PMC free article] [PubMed] [Google Scholar]
- 29.Carp S. A., Robinson M. B., Franceschini M. A., “Diffuse correlation spectroscopy: current status and future outlook,” Neurophoton. 10(01), 013509 (2023). 10.1117/1.NPh.10.1.013509 [DOI] [PMC free article] [PubMed] [Google Scholar]
- 30.Robinson M. B., Renna M., Ozana N., Martin A. N., Otic N., Carp S. A., Franceschini M. A., “Portable, high speed blood flow measurements enabled by long wavelength, interferometric diffuse correlation spectroscopy (LW-iDCS),” Sci. Rep. 13(1), 8803 (2023). 10.1038/s41598-023-36074-8 [DOI] [PMC free article] [PubMed] [Google Scholar]
- 31.Zhao M., Zhou W., Aparanji S., Mazumder D., Srinivasan V. J., “Interferometric diffusing wave spectroscopy imaging with an electronically variable time-of-flight filter,” Optica 10(1), 42–52 (2023). 10.1364/OPTICA.472471 [DOI] [PMC free article] [PubMed] [Google Scholar]
- 32.Zhou W., Kholiqov O., Zhu J., Zhao M., Zimmermann L. L., Martin R. M., Lyeth B. G., Srinivasan V. J., “Functional interferometric diffusing wave spectroscopy of the human brain,” Sci. Adv. 7(20), eabe0150 (2021). 10.1126/sciadv.abe0150 [DOI] [PMC free article] [PubMed] [Google Scholar]
- 33.Zhou W., Zhao M., Srinivasan V. J., “Interferometric diffuse optics: recent advances and future outlook,” Neurophoton. 10(01), 013502 (2022). 10.1117/1.NPh.10.1.013502 [DOI] [PMC free article] [PubMed] [Google Scholar]
- 34.Ainslie P. N., Murrell C., Peebles K., Swart M., Skinner M. A., Williams M. J. A., Taylor R. D., “Early morning impairment in cerebral autoregulation and cerebrovascular CO2 reactivity in healthy humans: relation to endothelial function,” Experimental Physiology 92(4), 769–777 (2007). 10.1113/expphysiol.2006.036814 [DOI] [PubMed] [Google Scholar]
- 35.Liu P., Li Y., Pinho M., Park D. C., Welch B. G., Lu H., “Cerebrovascular reactivity mapping without gas challenges,” NeuroImage 146, 320–326 (2017). 10.1016/j.neuroimage.2016.11.054 [DOI] [PMC free article] [PubMed] [Google Scholar]
- 36.Murphy K., Harris A. D., Wise R. G., “Robustly measuring vascular reactivity differences with breath-hold: normalising stimulus-evoked and resting state BOLD fMRI data,” NeuroImage 54(1), 369–379 (2011). 10.1016/j.neuroimage.2010.07.059 [DOI] [PubMed] [Google Scholar]
- 37.Leung J., Kosinski P. D., Croal P. L., Kassner A., “Developmental trajectories of cerebrovascular reactivity in healthy children and young adults assessed with magnetic resonance imaging,” The Journal of Physiology 594(10), 2681–2689 (2016). 10.1113/JP271056 [DOI] [PMC free article] [PubMed] [Google Scholar]
- 38.Tallon C. M., Barker A. R., Nowak-Flück D., Ainslie P. N., McManus A. M., “The influence of age and sex on cerebrovascular reactivity and ventilatory response to hypercapnia in children and adults,” Experimental Physiology 105(7), 1090–1101 (2020). 10.1113/EP088293 [DOI] [PubMed] [Google Scholar]
- 39.Tallon C. M., Barker A. R., Nowak-Flück D., Ainslie P. N., McManus A. M., “The influence of age and sex on cerebrovascular reactivity and ventilatory response to hypercapnia in children and adults,” Github, 2023, https://github.com/BuckleyLabEmory/CVR_in_Pediatric_SCD.git [DOI] [PubMed]
Associated Data
This section collects any data citations, data availability statements, or supplementary materials included in this article.
Data Citations
- Tallon C. M., Barker A. R., Nowak-Flück D., Ainslie P. N., McManus A. M., “The influence of age and sex on cerebrovascular reactivity and ventilatory response to hypercapnia in children and adults,” Github, 2023, https://github.com/BuckleyLabEmory/CVR_in_Pediatric_SCD.git [DOI] [PubMed]
Data Availability Statement
Data underlying the results presented in this paper will be available upon publication [39].


