Abstract
This cross-sectional study compares pharmacy acquisition costs and point-of-sale prices for generic imatinib under Medicare Part D from 2017 to 2023.
Imatinib is among the most effective cancer drugs ever developed.1 At US Food and Drug Administration (FDA) approval in 2003, imatinib was the most expensive medication available. This high launch price and price increases have contributed to low patient adherence to therapy,2 making entry of generic versions eagerly anticipated. Whether availability of generic imatinib has lowered spending for Medicare beneficiaries and the extent of generic price reductions under Medicare Part D are unclear.3 This study compares pharmacy acquisition costs and point-of-sale prices for generic imatinib.
Methods
In accordance with the Common Rule, this cross-sectional study was exempt from review and informed consent because publicly available aggregated data were used. The study followed the STROBE reporting guideline.
Data for 2017 to 2023 from the Centers for Medicare & Medicaid Services National Average Drug Acquisition Cost file (NADAC) and quarterly Medicare formulary data were obtained to compare mean acquisition costs for 30 pills of generic imatinib, 400 mg, and median and 25th and 75th percentiles point-of-sale prices paid at preferred in-area pharmacies during the first quarter of each calendar year. Generic formulations were identified using the FDA’s Approved Drug Products with Therapeutic Equivalence Evaluations. Acquisition costs represent pharmacy invoice prices for retail drugs (ie, what pharmacies paid). Point-of-sale prices represent the amount paid by health plans, pharmacy benefits managers (PBMs), and patients when filling the prescription. For anticancer drugs, out-of-pocket costs are typically a percentage of the point-of-sale price.4 Data were analyzed from April 26 to May 8, 2023, using SAS Studio, release 3.8 (SAS Institute).
Results
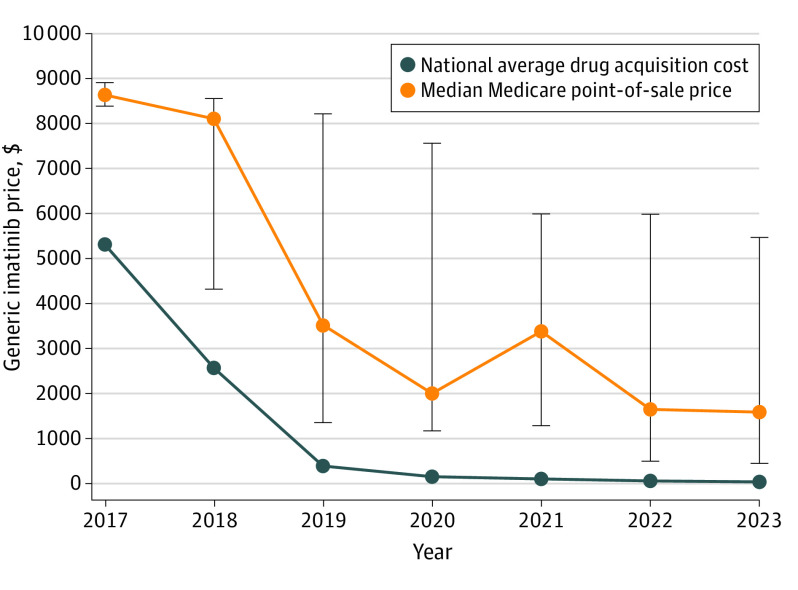
This study used 100% of Medicare Part D plan, contract, and formulary records in each calendar year. A total of 33 022 unique plan contract and formulary observations were included in the analysis. Generic imatinib entered the market in 2016, and by 2023, 13 generic equivalents were approved. Between 2017 and 2023, pharmacy acquisition costs for generic imatinib declined 98.8%, from $5310 to $59 per fill. Over the same period, the median Medicare point-of-sale price declined 81.4%, from $8618 to $1602 (Figure). The 25th percentile of prices declined 94.4%, from $8370 to $469, and the 75th percentile of prices declined 38.5%, from $8890 to $5466.
Figure. Comparison of the National Average (Mean) Drug Acquisition Cost and the Median Medicare Part D Point-of-Sale Price for Generic Imatinib From 2017 to 2023.
Bars represent the 25th and 75th percentiles of spending per claim for a supply of 30 400-mg pills.
Although point-of-sale prices for generic imatinib declined over time, the median markup percentage increased from 62% of acquisition costs (median point-of-sale price of $8618 vs $5310 in mean acquisition costs) in 2017 to 2615% (median point-of-sale price of $1602 vs $59 in mean acquisition costs) by 2023. Despite pharmacy mean acquisition costs of $59 per fill in 2023, Medicare beneficiaries would pay an estimated $80 to $400 out-of-pocket per fill at the median point-of-sale price depending on whether they are in the gap or catastrophic Medicare benefit phase.
Discussion
Medicare point-of-sale prices for generic imatinib have been substantially higher than pharmacy acquisition costs. These high point-of-sale prices resulted in high out-of-pocket spending for Medicare beneficiaries needing imatinib.
It is unclear who benefits from these overpayments—the pharmacy, the PBM, or the Part D plan sponsor. Given the substantial vertical integration of pharmacies, plans, and PBMs in Medicare Part D, such overpayments could produce profits for the parent company of these vertically integrated organizations, regardless of which entity is pocketing the higher payment. Even if generic imatinib is an outlier, extensive overpayments are harmful to patients and taxpayers.
Study limitations include NADAC’s lack of acquisition cost data for specialty pharmacies. Whether price discrepancies exist beyond generic imatinib under Medicare Part D has not, to my knowledge, been explored, although overpayments for generic drugs have been identified within a state Medicaid program.5 Information on postsale fees that pharmacies pay back to plans and PBMs, which overestimate point-of-sale prices, is also lacking. These fees have grown from $1.7 billion in 2015 to $9.5 billion in 2020, reducing potential pharmacy profits from observed overpayments.6
Government efforts are underway to investigate the prescription drug supply chain and PBM practices and financial flow. The gap between generic imatinib point-of-sale prices and average pharmacy acquisition costs supports these efforts to evaluate spending across PBMs, health plans, and pharmacies to avoid overpayment for medications covered under Medicare Part D.
Data Sharing Statement
References
- 1.O’Brien SG, Guilhot F, Larson RA, et al. ; IRIS Investigators . Imatinib compared with interferon and low-dose cytarabine for newly diagnosed chronic-phase chronic myeloid leukemia. N Engl J Med. 2003;348(11):994-1004. doi: 10.1056/NEJMoa022457 [DOI] [PubMed] [Google Scholar]
- 2.Winn AN, Keating NL, Dusetzina SB. Factors associated with tyrosine kinase inhibitor initiation and adherence among Medicare beneficiaries with chronic myeloid leukemia. J Clin Oncol. 2016;34(36):4323-4328. doi: 10.1200/JCO.2016.67.4184 [DOI] [PMC free article] [PubMed] [Google Scholar]
- 3.Dusetzina SB, Muluneh B, Keating NL, Huskamp HA. Broken promises—how Medicare Part D has failed to deliver savings to older adults. N Engl J Med. 2020;383(24):2299-2301. doi: 10.1056/NEJMp2027580 [DOI] [PubMed] [Google Scholar]
- 4.Dusetzina SB, Keating NL. Mind the gap: why closing the doughnut hole is insufficient for increasing Medicare beneficiary access to oral chemotherapy. J Clin Oncol. 2016;34(4):375-380. doi: 10.1200/JCO.2015.63.7736 [DOI] [PMC free article] [PubMed] [Google Scholar]
- 5.Side effects: an ongoing investigation on the rising costs of prescription drugs. USA Today; January 2020. Accessed May 10, 2023. https://stories.usatodaynetwork.com/sideeffects/
- 6.Centers for Medicare & Medicaid Services . Fact Sheet on CY 2023. Medicare Advantage and Part D Final Rule (CMS-4192-F). Published April 29, 2022. Accessed May 10, 2023. https://www.cms.gov/newsroom/fact-sheets/cy-2023-medicare-advantage-and-part-d-final-rule-cms-4192-f
Associated Data
This section collects any data citations, data availability statements, or supplementary materials included in this article.
Supplementary Materials
Data Sharing Statement


