

We studied how anthropogenic and environmental disturbances affect fecal glucocorticoid metabolite (FGM) levels of impala and kudu. Both species had higher FGM levels when subjected to hunting, while FGM levels decreased with increasing forage availability. Our results indicate that management regimes can affect the physiological state of wild ungulate populations.
Keywords: trophy hunting, stress, population decline, fecal glucocorticoid metabolites, Anthropogenic activities
Abstract
Understanding the drivers of animal population decline is a key focus of conservation biologists. Anthropogenic activities such as hunting have long been established as potentially detrimental to a population’s persistence. However, environmental perturbations such as increased temperature variability, exacerbated by climate change, can also have important effects on animal populations. Animals can respond to these challenges by adjusting both their behavior and physiology. We measured fecal glucocorticoid metabolites (FGMs) of common impala (Aepyceros melampus) and greater kudu (Tragelaphus strepsiceros), both currently in stable populations, to examine effects of hunting, forage availability, daily variability in temperature and group size on their physiological stress response. The study was conducted across two adjacent protected areas, (i) one non-hunted area (Ruaha National Park; RNP) and (ii) one area used for trophy hunting (Rungwa Game Reserve; RGR). Both impala and kudu had significantly higher FGM levels in the area that allows hunting, while FGM levels decreased with increasing forage availability and increasing daily temperature. Moreover, impala (but not kudu) had lower FGM levels with larger group sizes. Our results indicate that the management regime can significantly alter the physiological state of wild ungulate populations. We also highlight the importance of considering the combined effects of anthropogenic, environmental and social contexts when studying the stress response of wild populations. Our results emphasize the value of protected areas and continued monitoring of hunting quota in order to maintain ungulate populations that are less vulnerable to population declines.
Introduction
Anthropogenic activities such as tourism and hunting have long been established as important sources of disturbance to animal populations (Bateman and Fleming, 2017). However, environmental perturbations, including increased daily and seasonal temperature variation, can also have important negative effects on animal populations, and may be exacerbated by climate change (Niang et al., 2014). Animals respond to such challenges through various behavioral and physiological mechanisms (Sih et al., 2011). These physiological changes have become an important tool to monitor wild populations (Madliger et al., 2018). However, few studies have studied the interactive effects of both anthropogenic activities and environmental perturbations on animal physiology (Santicchia et al., 2020), and fewer studies still have investigated between-species differences in this response to similar disturbances (Pirotta et al., 2018; Gairin et al., 2022; Seebacher, 2022). Here, we investigate how the physiological state of two common antelope species are affected by both human activities, seasonal changes in food availability and temperature, and social context.
Protected areas, including national parks and game reserves, are increasingly impacted by encroachment from human activities such as crop farming (Hariohay et al., 2020), logging for timber, hunting for bushmeat and livestock incursions (Knappa et al., 2017; Kyando et al., 2017; Hariohay et al., 2019). Legal trophy hunting too has increased in game reserves (Hariohay et al., 2018). These human activities can have direct and indirect effects on populations (Frid and Dill, 2002). For example, fewer calves were observed in Rungwa Game Reserve (RGR), an area that allows trophy hunting, compared to Ruaha National Park (RNP), a strictly protected area (Hariohay et al., 2018). Similarly, impala and greater kudu populations were more vigilant and were more female skewed in partially protected areas compared to strictly protected areas (Hariohay et al., 2018; Setsaas et al., 2018). Greater kudu population had, on average, more vigilant individuals per group and higher flight initiation distance in RGR (trophy hunting area) as compared to populations in RNP (non-hunted area; Hariohay et al., 2018). However, even relatively recent changes in management regimes can have significant effect on populations; impala population densities and flight behavior were shown to considerably improve after 15 years of stricter conservation management in the Serengeti ecosystem (Flølo et al., 2021).
Regulated hunting is a common population management tool, which can promote plant regeneration and ecosystem health (Lindsey et al., 2006; Di Minin et al., 2016). The ‘2007 Wildlife Policy of Tanzania’ provides for a variety of wildlife utilization forms within the country (URT, 2007). The list is broad, comprising of game viewing, tourist hunting, farming, breeding, ranching, eco-tourism, zoos and game sanctuaries. Regardless of the utilization form or actor, the main purpose is to ensure that wildlife contributes adequately to socio-economic development without adversely impairing their conservation. The wider options for wildlife utilization apart, the tourism industry in the country continues to be dominated by game viewing and trophy hunting. Game viewing is non-consumptive and generally considered best practice in wildlife-rich ecosystems with good accessibility and visibility, but demands substantial investment in visitor amenities. In contrast, trophy hunting, while regulated, is a consumptive undertaking and is often carried out in extremely remote and rugged wildlife refuges with dense vegetation and poor wildlife numbers (Mahoney and Geist, 2019). Due to their remoteness, trophy hunting areas also tend to have facilities and infrastructure that are not to the satisfaction of a typical game viewer. Both management types therefore apply to different areas and can both help protect natural areas and wildlife populations (Lindsey et al., 2006).
Antelope populations are largely regulated by forage availability (Hopcraft et al., 2010). The seasonal changes in forage availability in East-African savannas can be substantial and, with climate change, are poised to become larger and more severe (Codron et al., 2007; Midgley and Bond, 2015). In this study, we used the normalized difference vegetation index (NDVI; NASA MODIS; Didan, 2015) as a proxy for forage availability. NDVI measures primary productivity of a surface, based on the amount of near-infrared (NIR) and red light that is reflected; chlorophyll in green vegetation strongly reflects NIR while it mostly absorbs red light frequencies (Didan, 2015). This proxy is therefore useful to quantify the forage availability (e.g. nutritional sprouting grasses) over a large spatial and temporal extent (Pettorelli et al., 2005). However, several caveats need to be considered when using NDVI data, including cloud cover, plant community and topography, as these factors can affect NDVI estimates (Pettorelli et al., 2011; Pettorelli et al., 2012). NDVI presents a powerful method for ecologists to relate large-scale vegetation changes to changes in animal physiology and behavior, and several studies have previously applied this remote sensed proxy in African savanna ecosystems (Stabach et al., 2015; Hunninck et al., 2020b).
Animal stress is defined as an environmental stimulus that causes an imbalance in homeostasis of an organism (Boonstra, 2013). External disturbances can trigger the release of hormones into the blood, resulting in an increased energy mobilization and facilitating an animal’s fight-or-flight response (Tingvold, 2011). The resultant change in behavior or physiology of the animal is known as the stress response (Tingvold et al., 2013; Giudice et al., 2018; Madliger et al., 2018). These stress responses can be energetically costly, and any physiological or behavioral mechanism to mitigate stressors is at the cost of diverting energy from other physiological functions (Sapolsky et al., 2000; Deng et al., 2018; van de Ven et al., 2019; Pérez-Barbería et al., 2020). Although the stress response is an adaptive mechanism, being beneficial for how animals cope with challenges and thereby increase their overall fitness (Boonstra, 2013), chronic stressors—when stressors are often recurring or long in duration—resulting in sustained increases in glucocorticoid (GC) levels, may increase pathology of the animal (Sapolsky et al., 2000; Sheriff et al., 2011; Vilela et al., 2020). Therefore, when exposed to a chronic stressor, the resultant elevated GC levels can indicate that the animal experiences an imbalance to its homeostasis (Harris, 2015). Stress in animals can be measured in a multitude of ways, including behavioral observations (Nyahongo, 2008; Hariohay et al., 2018), bio-telemetric methods (Heylen and Nachtsheim, 2018) and measuring fecal glucocorticoid metabolites (FGMs; (Palme, 2019). Measuring FGMs is a non-invasive, quick, cheap and now routinely used method to assess adrenocortical activity. FGMs provide an integrated measure of adrenocortical activity over a certain time, depending upon the species (up to several hours in ruminants). Unlike plasma GC, FGM levels are less sensitive to minor fluctuations and a better proxy for chronic stress (Palme et al., 2005; Hamilton et al., 2011; Sheriff et al., 2011; Tingvold et al., 2013; Dantzer et al., 2016).
Anthropogenic activities such as hunting and tourism are increasingly pervasive stressors as human–wildlife interactions continue to increase (Lunde et al., 2016; Madliger et al., 2018). Several studies have shown that FGM concentrations are higher in populations that experience human interactions, are hunted or reside in partially or non-protected areas, for example, African elephants (Ahlering et al., 2013; Hunninck et al., 2017) and mountain hares (Lepus timidus; (Rehnus et al., 2014). Similarly, studies show that when animals faced environmental challenges, such as prolonged decreases in forage availability, FGM concentrations increased sharply (Stabach et al., 2015; Hunninck et al., 2017). Conversely, when high quality forage was widely available, FGM levels were found to be relatively low (Hunninck et al., 2020a). FGM concentrations have also been shown to respond to fluctuations in temperature, where higher FGM—resulting in a higher mobilization of energy required for physiological thermoregulation—let animals cope with colder conditions (Huber et al., 2003; Dalmau et al., 2007; Santos et al., 2018). Beside anthropogenic and environmental sources of disturbance, the social context of an animal can have considerable effects on an animal’s stress response (Creel et al., 2013). For territorial animals such as the impala (Jarman and Jarman, 1973), territorial males were shown to have higher FGM levels compared to their non-territorial counterparts (Hunninck et al., 2020c). However, for females, larger group sizes could have a buffering effect, decreasing the stress response (Hennessy et al., 2009). Larger group sizes would result in lower individual vigilance, that is, many-eyes hypothesis (Pulliam, 1973). Furthermore, larger group sizes may lead to a decreased individual predation risk through dilution or confusion effects, further decreasing the stress response (Hamilton, 1971; Roberts, 1996; Goodale et al., 2019). However, animals will choose to live in large groups only if the benefits (e.g. avoiding predation) outweigh the costs (e.g. foraging competition). Considering the various sources of disturbance is pivotal to fully understand how an animal responds to external stressors. However, although different species can vary greatly in how they cope with different perturbations, little is known about how different sympatric species respond physiologically to such stressors.
Our aim was to assess the effects of trophy hunting and environmental and social context on FGM levels in two large ungulate species in the Ruaha–Rungwa ecosystem, Tanzania. We hypothesized that the animals in the RGR, where trophy hunting is legally conducted, would have higher levels of FGMs compared to animals in the non-hunted RNP, where only non-consumptive tourism is conducted. Secondly, we hypothesized that FGM levels would decrease with increasing forage availability, as food is abundant. Thirdly, we hypothesized that with decreasing temperatures, FGM levels would increase to facilitate thermoregulation. Lastly, we hypothesized that with larger in group sizes, the stress response would be buffered, and thus, FGM levels would decrease.
Methods
Study area
The study was conducted across two management regimes, RGR and RNP, situated in south-central Tanzania (Fig. 1). RNP together with the surrounding game reserves (including RGR) constitutes the large Ruaha–Rungwa ecosystem covering a continuous area of ~45 000 km2. Elevation ranges from 800 to 1800 m, and the area receives an average amount of annual rainfall of 873 mm with a single wet season occurring from November to May and with the highest rainfall levels recorded in December and January. Temperatures range from an average of 21.5°C from June–July to 26.5°C from August–October (Marttila, 2011).
Figure 1.

Location of impala (blue) and kudu (red) fecal samples that were collected in RGR and RNP. The inset shows the location of the study area in central Tanzania. The base map shows the percent woody cover, with darker green cells indicating a high relative percent woody cover and white areas indicating no woody cover; across the study system, the median woody cover was 7% (range: 0–59%).
Study species
Impala (Aepyceros melampus) is a medium-sized, sexually dimorphic antelope, common in eastern Africa (Averbeck, 2002). Impala inhabit savanna grasslands and woodlands situated close to water sources and are considered water dependent; impala have a relatively small home range (Jarman and Jarman, 1973). They are mixed foragers of grasses, forbs, monocots, dicots and foliage, and travel between habitats between seasons due to variability in food availability (Wronski, 2002; Marshal et al., 2012). They live in three distinct social groups: (i) female herds with a territorial male, (ii) bachelor herds (males of different ages) and (iii) single territorial males. In this study, a group was defined by individuals behaving in a coordinated manner either moving together in same direction or engaged in the same activity at any one time, within a distance of less than a hundred meters.
Greater kudus (Tragelaphus strepsiceros) are found in woodlands, as they are browsers that eat leaves and shoots. In the dry season, they eat fruits for their liquid content and for the natural sugars that they provide (de Garine-Wichatitsky et al., 2004). While they are not in groups with females, male kudus can be found in bachelor groups or, more likely, solitary (Kie, 1999; Hoffmann, 2016). Males are seen with females only during the mating season when they form groups of generally 5–15 kudus, including offspring (Hoffmann, 2016).
Both species are common in the Ruaha–Rungwa ecosystem and have a similar ecology, and were therefore chosen as focal species for this study.
Fecal sample collection
A total of 312 fecal samples were collected in both areas across two years, in 2016 from 13 to 30 October, and in 2017 from 24 August to 8 September, for a total of 32 days. Following Millspaugh and Washburn (2004), we collected fecal samples rapidly (here, within 25 minutes) after defecation to avoid environmental degradation of FGMs. When an animal defecated, we identified the age and sex of the animal, measured the distance to the animal and took a photo. A person then walked to the place of defecation, and this distance was measured to make sure it was the exact same location as the studied animal had occupied. This procedure made it possible to accurately obtain the sex and age for each animal from which a fecal sample was obtained and importantly. After collection we placed the sample(s) on ice in a cooler box. Pellets from the whole defecation were collected to minimize individual variation, and an average of 1.5 (range, 1–11) animals was sampled from each group. Only adult females were sampled, and samples contaminated by urine were not collected as the hormone metabolites in urine can bias FGM results (Sheriff et al., 2011; Madliger et al., 2018). We collected fecal samples from 232 impala and 80 greater kudus.
Lab processing
Samples were kept in a container with absolute alcohol and placed on ice in a cooler box throughout the fieldwork and placed in a −20°C freezer daily. At the end of each field season, the samples were transported by car (2 days; kept cool in a −20°C freezer) placed in a freezer at Serengeti Research Center. All samples were processed within two months after collection. For lab processing, we thawed the samples and then mixed pellets from each sample by hand to account for within-sample variation that can bias assay results (Millspaugh and Washburn, 2003; Vilela et al., 2020). We then transferred 0.5 g of mixed, wet feces and 5-ml 80% ethanol to a centrifuge tube (Nunc®, 10 ml), then we homogenized the mix (Omni μH) and centrifuged the samples for 20 minutes at 1200 g (Unico Powerspin ™ LX). Then we transferred 1-ml supernatant from each sample to a 2-ml microtube, and let the samples dry at room temperature. FGMs were measured with an 11-oxoetiocholanolone EIA, first described by Möstl et al. (2002), which measures metabolites with a 5β-3α-ol-11-one structure. This EIA has been specifically validated for impala (Chizzola et al., 2018), but not for Greater kudu. However, this particular EIA has been successfully validated for every ruminant species tested so far (Palme, 2019) and is therefore very likely to accurately measure FGM concentrations in Greater kudu as well.
Land surface temperature
Because there is no weather station in the study area, and therefore no direct temperature data available, we used a previously validated technique to estimate daily ambient temperature by collecting data on land surface temperature (LST; Hunninck et al., 2020a). We extracted the average daily LST estimate experienced by the sampled animal on the day and location of sampling (MOD11A1 MODIS/Terra; Wan et al., 2015). However, because the samples in 2016 were collected in late October in 2016 compared to early September in 2017 (Fig. 4A), average temperature experienced across all individuals were significantly higher in 2016 (F1, 230 = 33.44, P < 0.001; Fig. 4B). LST values experienced by sampled individuals in 2016 averaged 42.3°C (SE = 0.39), while in 2017 39.0°C (SE = 0.41; Fig. 4B). While this proxy correlates strongly with ambient temperature, LST values tend to be higher than ambient temperatures.
Figure 4.
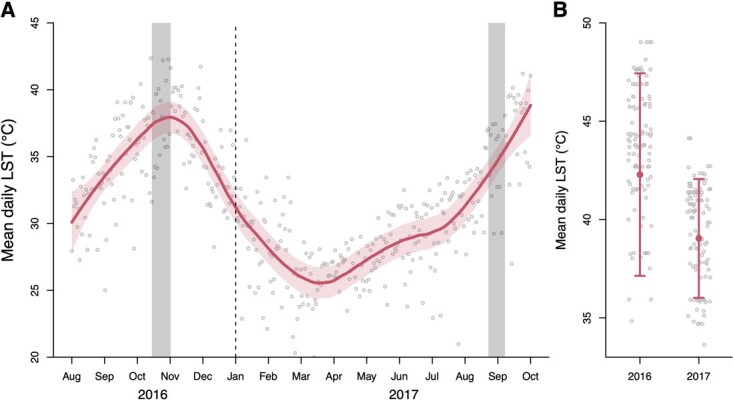
Mean daily LST change over time in Ruaha–Rungwa ecosystem during 2016–2017. LST varied greatly throughout the seasons (A) and between years (B). Sampled individuals experienced significantly higher LST in 2016 as compared to 2017 (B). In (A) daily LST values (gray circles) and the daily average LST (red line) for the entire study area, from August 2016 to October 2017 are shown, as well as the timing of the two study period (shaded gray area). Note that 95% confidence interval is the shaded red area or the arrows.
Statistical methods
Impala and kudu were analyzed separately but with identical methods. We assessed variation in FGM levels using linear mixed-effects models in ‘lme4’ (Bates et al. 2015) using R (R Core Team, 2020). This method allowed us to estimate the effect of one predictor, while controlling for the other predictors included in the model. Models were fitted using log-transformed FGM levels as the response to ensure normal distribution of model residuals. Main fixed predictors included management regime (i.e. non-hunting in RNP versus hunting in RGR), NDVI, LST (we included LST as a quadratic effect, as FGMs could be elevated at both very low and very high temperatures) and group size (impala: median = 6, range: 1–120; kudu: median = 5, range: 1–125). We compared five models for both impala and kudu, as we were interested in whether management regime interacted with the effect of the environmental variables on FGM levels. These models were a null model, a no-interaction model and three models with a single interaction between management regime and each environmental variables (NDVI, LST and group size). We used Akaike’s Information Criterion adjusted for small samples sizes (AICc; Burnham and Anderson, 2002) to assess which of the five models best fit our data. Models were considered significantly better fit to the data if ∆AICc > 2. We accounted for non-independence within groups of animals by adding the group identity as a random factor (impala: n = 150; kudu: n = 64). Because LST and year were strongly correlated, we decided not to include year in the model (Nakagawa and Cuthill, 2007).
Results
Impala
The model selection revealed that best-fitting model to explain the variation in impala FGM concentrations included an interaction between management area and temperature and was significantly better than the next best model (∆AICc > 2; Table 1).
Table 1.
Model comparisons among five proposed models explaining the variation in FGM concentrations in Ruaha–Rungwa ecosystem for both Impala and Kudu.
| Impala | Model | Structure | df | ∆AICc | Weight |
| LST | log(FGM) ~ Area * LST2 + NDVI + Group size + (1|groupID) | 10 | 0.00 | 0.99 | |
| NDVI | log(FGM) ~ Area * NDVI + LST2 + Group size + (1|groupID) | 9 | 13.96 | 0.01 | |
| No interaction | log(FGM) ~ Area + NDVI + LST2 + Group size + (1|groupID) | 8 | 17.82 | 0.00 | |
| Group size | log(FGM) ~ Area * Group size + LST2 + NDVI + (1|groupID) | 9 | 24.96 | 0.00 | |
| (null) | log(FGM) ~ 1 + (1|groupID) | 3 | 48.64 | 0.00 | |
| Kudu | LST | log(FGM) ~ Area * LST2 + NDVI + Group size + (1|groupID) | 10 | 0.00 | 0.87 |
| NDVI | log(FGM) ~ Area * NDVI + LST2 + Group size + (1|groupID) | 9 | 4.16 | 0.11 | |
| No interaction | log(FGM) ~ Area + NDVI + LST2 + Group size + (1|groupID) | 8 | 7.82 | 0.02 | |
| Group size | log(FGM) ~ Area * Group size + LST2 + NDVI + (1|groupID) | 9 | 14.43 | 0.00 | |
| (null) | log(FGM) ~ 1 + (1|groupID) | 3 | 17.77 | 0.00 |
Fixed effects include of Area (RGR vs. RNP), NDVI = Normalized Difference Vegetation Index, LST = mean daily land surface temperature and group size. Non-independence within animal group was accounted for adding group identity (groupID) as a random factor. Degrees of freedom (df) are given, as well as difference in Akaike’s Information Criterion adjusted for small samples sizes (∆AICc) and their respective weights
We found that FGM concentrations were significantly lower in the non-hunting area (RNP) when compared to the areas where trophy hunting is allowed (RGR); FGM levels in RNP (mean ± SE = 202 ± 28 ng/g) were 74% lower compared to RGR (mean ± SE = 771 ± 112 ng/g; Table 2; Fig. 2). NDVI had a significant negative effect on FGM levels, such that impala FGM levels decreased 73% from 406 ng/g (95% Confidence interval [CI] = 314–524 ng/g) at low NDVI levels (NDVI = 0.2) to 110 ng/g (95% CI = 38–317 ng/g) at high NDVI levels (NDVI = 0.6). LST had an overall significant negative effect on FGM levels, such that impala FGM levels decreased 80% from 677 ng/g (95% CI = 295–1553 ng/g) at low LST levels (LST = 29) to 133 ng/g (95% CI = 70–252 ng/g) at high LST levels (LST = 49). However, for impala in RNP, FGM levels were highest (mean [95% CI] = 1247 ng/g [445–3494 ng/g]) at lowest LST (LST = 29) and declined to their lowest value (mean [95% CI] = 177 ng/g [137–229 ng/g]) at an LST of 44, and increase marginally with further increases of LST. Impala in RGR showed a strong quadratic relationship, with lowest FGM levels at lowest (mean [95% CI] = 217 ng/g [61–766 ng/g]) and highest LST (mean [95% CI] = 61 ng/g [13–288 ng/g]), and highest FGM levels at mean LST of 39 (mean [95% CI] = 916 ng/g [648–1295 ng/g]; Fig. 2). Lastly, group size had a significant negative effect on FGM levels, such that impala FGM levels decreased 74% from 375 ng/g (95% CI = 305–462 ng/g) at small group sizes (group size = 1) to 97 ng/g (95% CI = 49–192 ng/g) at large group sizes (group size = 100).
Table 2.
Model estimates from the linear mixed-effects model for impala explaining the variation in FGM concentrations in Ruaha–Rungwa ecosystem.
| Fixed effects | Estimate | SE | df | t | P | |
|---|---|---|---|---|---|---|
| (Intercept) | 7.27 | 0.51 | 131.23 | 14.16 | < 0.001 | *** |
| Area: RGR | −0.75 | 0.21 | 137.27 | −3.63 | < 0.001 | *** |
| LST (lin.) | −5.88 | 2.76 | 149.84 | −2.13 | 0.035 | * |
| LST (qua.) | −8.28 | 2.76 | 139.17 | −3.00 | 0.003 | ** |
| NDVI | −3.27 | 1.55 | 129.36 | −2.11 | 0.037 | * |
| Group size | −0.01 | 0.00 | 156.55 | −3.60 | < 0.001 | *** |
| Area: LST (lin.) | 0.10 | 3.14 | 155.87 | 0.03 | 0.974 | |
| Area: LST (qua.) | 11.36 | 3.11 | 146.41 | 3.65 | < 0.001 | *** |
| Random effects | Variance | SD | ||||
| Group ID | 0.511 | 0.715 | ||||
| Residual | 0.419 | 0.647 |
Significance codes: P < 0.001 ***; 0.001–0.01 **; 0.01–0.05 *; 0.05–0.1.
Model estimates for the effects of Area (RGR vs. RNP), NDVI = Normalized Difference Vegetation Index, LST = mean daily land surface temperature and group size. Non-independence within animal group was accounted for adding group identity as a random factor
Figure 2.

Changes in average FGM concentrations due to management regime and environmental factors in Common Impala in Ruaha–Rungwa ecosystem. The effect of (A) management regime (RGR, hunted, red solid lines/open circles vs. RNP, non-hunted, green dashed lines/solid triangles), (B) NDVI, (C) mean daily LST in interaction with management regime and (D) group size, on impala FGM concentrations. Model estimates are represented as points or lines; 95% confidence intervals are the arrows or the shaded areas. The Y-axis is truncated at 1500 ng/g to aid in the interpretation of the results.
The model explained 67% of the variation in FGM levels in our dataset; the fixed effects alone explained 26% of the variation in FGM levels.
Greater kudu
Similarly, the best-fitting model to explain the variation in kudu FGM concentrations included an interaction between management area and temperature and was significantly better than the next best model (∆AICc > 2; Table 1).
Kudu FGM levels were significantly lower in RNP when compared RGR; FGM levels in RNP (mean ± SE = 373 ± 90 ng/g) were 40% lower compared to RGR (mean ± SE = 619 ± 109 ng/g; Supplementary Table S1; Fig. 3A). NDVI had a significant negative effect on FGM levels (Supplementary Table S1), such that kudu FGM levels decreased 79% from 785 ng/g (95% CI = 533–1155 ng/g) at low NDVI levels (NDVI = 0.2) to 165 ng/g (95% CI = 77–352 ng/g) at high NDVI levels (NDVI = 0.6; Fig. 3B). LST did not have an overall significant effect on FGM levels. There was insufficient data for kudu in RGR, indicated by the large error bars in Figure 3C. However, for kudu residing in RNP, there was a small but significant decrease in FGM levels from highest FGM levels at an LST of 35 (mean [95% CI] = 577 ng/g [437–960 ng/g]; Fig. 3C) to lowest FGM levels at highest LST (LST = 48; mean [95% CI] = 39 ng/g [18–86 ng/g]). Lastly, in contrast to impala, group size did not have a significant effect on FGM levels (Supplementary Table S1; Fig. 3D).
Figure 3.

Changes in average FGM concentrations due to management regime and environmental factors in Greater Kudu in Ruaha–Rungwa ecosystem. The effect of (A) management regime (RGR, hunted, red solid lines/open circles vs. RNP, non-hunted, green dashed lines/solid triangles), (B) NDVI, (C) mean daily LST in interaction with management regime and (D) group size (x-axis is truncated at 15, as model is not informative on larger group sizes due to a lack of data), on kudu FGM concentrations. Model estimates are represented as points or lines; 95% confidence intervals are the arrows or the shaded areas. The Y-axis is truncated at 1300 ng/g to aid in the interpretation of the results.
The model explained 50% of the variation in FGM levels in our dataset; the fixed effects alone explained 39% of the variation in FGM levels.
Discussion
We found that FGM levels—a measure of physiological stress—were higher in both impala and greater kudu in RGR, where trophy hunting is allowed, compared to animals residing RNP indicating the potential negative impacts of trophy hunting on the wildlife stress response. We also show that both the environmental and social context considerably affected an animal’s stress response. Both ungulates responded very similar to anthropogenic and environmental disturbances, though only impala had a lower stress response with increasing group size.
Effect of hunting on FGM levels
Our results show that both impala and kudu FGM levels were significantly higher in RGR populations compared to RNP populations. We hypothesized that FGM levels would be higher in RGR, where wildlife trophy hunting is normally conducted as the main tourism activity, and lower in RNP, where photographic tourism is the main tourism activity. The trophy hunting season spans from September to October, the same period of sample collection—there were 63 trophy hunters in 2016 and 39 trophy hunters in 2017 in RGR (pers. comm.: Tourism Officers in charge at RGR). The observed difference might be due to the nature of trophy hunting, which is likely to induce a higher disturbance to ungulate populations in RGR. Several studies have shown that animals in highly disturbed areas (e.g. human settlements and intensive livestock grazing) had higher levels of FGM than in protected areas where such activities are not allowed (Rehnus et al., 2014).We assumed that populations in both study areas were subject to similar levels of illegal hunting, habitat loss, predation pressure, and human–wildlife conflict (HWC) as both areas form a single continuous ecosystem (Fig. 1). Therefore, the main difference between the two areas in terms of potential disturbances should therefore be trophy hunting in the RGR.
Effect of forage availability on FGM levels
We found that both impala and kudu FGM levels decreased sharply with increasing forage availability (measured as NDVI). Multiple studies have used NDVI as a proxy for forage availability or dietary protein and used this proxy to relate forage availability to FGM concentrations in wildlife (Stabach et al., 2015; Oduor et al., 2020; Hunninck et al., 2020b). For instance, Stabach et al. (2015) observed a similar negative relationship between FGM concentrations and NDVI in wildebeest (Connochaetes taurinus) in Kenya. Pokharel et al. (2019) also demonstrated this effect between FGM concentrations and NDVI in free-ranging Asian elephants (Elephas maximus) in India, while Hunninck et al. (2020b) found strong evidence of this negative relationship between FGM concentrations and NDVI in impala in the Serengeti ecosystem. NDVI represents the greenness of a landscape of both woody and non-woody plants, and although the variation in NDVI is mainly due to variation in grassy vegetation, new growth on woody vegetation—which is more nutritious than mature leaves—also affects NDVI considerably (Pettorelli et al., 2011; Hunninck et al., 2020b). Therefore, while impala are grazers and kudu prefer to browse, high NDVI is likely to correlate to better forage quality for both species. GCs have an important role in an animal’s energy balance, and a decrease in energy uptake has been shown to results in an increase in energy mobilization from other sources, through an upregulation of GCs (Strack et al., 1995). Our findings therefore corroborate previous studies, indicating that a decrease in vegetation quality can have a potent positive effect on the adrenocortical response in wildlife (Hunninck et al., 2020b).
Effect of temperature on FGM levels
Impala experienced lowest FGM levels at mean temperatures (i.e. LST) in RNP (where hunting is prohibited) while FGM levels increased toward lowest and highest temperatures. We expected higher levels of FGM at lowest and highest temperatures because animals should increase energy mobilization to facilitate more increased physiological thermoregulation. Interestingly, impala FGM levels were more than twice as high at mean temperatures in RGR (where hunting is allowed) compared to the RNP populations; FGM levels at high temperatures were similar in both areas (Fig. 2C). Impala are sensitive to heat fluctuations and have been shown to experience heat stress above 35°C and extreme heat can negatively affect their diurnal activity (Maloiy and Hopcraft, 1971; Shrestha et al., 2014). Although the data for kudu in RGR were inconclusive, a similar but weak negative relationship between FGM levels and temperature was observed in kudu in RNP. Higher FGM concentrations at lower temperatures might be a result of higher diurnal activity, which has been shown to correlate with FGMs. Higher diurnal activity could also increase encounter rate between impala and anthropogenic stressors, further contributing to elevated FGM levels, especially in RGR, where hunting is allowed. Both negative (Corlatti et al., 2011; Santos et al., 2018) and positive relationships (Millspaugh et al., 2001) between FGM and ambient temperatures have been observed in ungulates before. More studies are necessary to disentangle the exact mechanisms GCs facilitate thermoregulation in both cold and hot environments in wild tropical ungulates.
Effect of group size on FGM levels
FGMs levels were higher in impala in smaller groups compared to impala in larger groups. This finding supports our hypothesis that FGMs levels would be higher in small groups (impala group sized ranged between 1 and 120 individuals). An animal’s social environment can have important effects their stress response (Creel et al., 2013). Larger groups benefit from increased group vigilance, while individual level vigilance can be reduced, thereby freeing up time and energy for foraging, that is, many-eyes hypothesis (Pulliam, 1973). Combined with a reduced predation risk (dilution effect; Hamilton, 1971) in large groups, larger group size may have a buffering effect of the stress response, decreasing FGM levels (Hennessy et al., 2009).
Kudu did not have a significant effect of group size on FGM levels (Supplementary Table S1). This might be largely due to the relatively small group sizes encountered in our study population: only 4 out of 64 groups consisted of more than 14 individuals, while the median group size for kudu was only 5 individuals. More data from larger groups would be needed to establish if larger group sizes affect individual FGM levels in kudu.
Conclusion
Our results show that two common ungulates in Ruaha–Rungwa ecosystem were subject to both anthropogenic and environmental disturbances, which significantly elevated their GC concentrations. FGM levels were substantially lower in a strictly protected area, where hunting is not allowed, indicating that the sublethal effects of hunting could strongly affect animal populations. Furthermore, lower forage availability and higher ambient temperatures also elevated physiological stress levels, suggesting that with increasingly severe climate variability, herbivore populations could also suffer secondary physiological effects. These results highlight the importance of protected areas and their role to minimize chronic physiological stress in animals. Our findings therefore emphasize the importance of national parks in maintaining healthy ungulate populations.
Funding
We acknowledge the EU-funded project AfricanBioServices (grant number 641819) that assisted us with field grants.
Author contributions
K.M.H., R.D.F. and E.R. designed the study. K.M.H. and the field assistants collected fecal samples. K.M.H. and TAWIRI colleagues extracted fecal samples, while they were being analyzed in RPs lab. L.H. conducted the statistical analyses. K.M.H., L.H. and P.S.R. lead the writing of the manuscript. E.R., K.M.H. and R.D.F. acquired funding. All authors contributed significantly to writing and editing the manuscript and with helpful discussions. Two anonymous reviewers greatly helped in improving this manuscript.
Data availability statement
The data that support the findings of this study are available from the corresponding author upon reasonable request.
Supplementary Material
Acknowledgements
We would like to express our great appreciation to the Tanzania National Park (TANAPA) and the Tanzania Wildlife Research Institute (TAWIRI) for granting us access to conduct this research study. Finally, we would also like to extend our thanks to the people in the field who assisted the data collection activities.
Contributor Information
Kwaslema Malle Hariohay, Department of Wildlife Management, College of African Wildlife Management, Mweka, P. O. Box 3031, Moshi, Tanzania; Department of Biology, Norwegian University of Science and Technology, Realfagbygget, NO-7491, Trondheim, Norway.
Louis Hunninck, Department of Biology, Norwegian University of Science and Technology, Realfagbygget, NO-7491, Trondheim, Norway; Department of Natural Resources and Environmental Sciences, University of Illinois Urbana-Champaign, Urbana, IL 61801, USA.
Peter S Ranke, Department of Biology, Norwegian University of Science and Technology, Realfagbygget, NO-7491, Trondheim, Norway; Center for Biodiversity Dynamics (CBD), Department of Biology, Norwegian University of Science and Technology, Realfagbygget, NO-7491, Trondheim, Norway.
Robert D Fyumagwa, Department of Wildlife Management, Tanzania Wildlife Research Institute (TAWIRI), P.O. Box 661, Arusha.
Rupert Palme, Department of Biomedical Sciences, University of Veterinary Medicine, Vienna.
Eivin Røskaft, Department of Biology, Norwegian University of Science and Technology, Realfagbygget, NO-7491, Trondheim, Norway.
Supplementary material
The following file is available at Conservation Physiology online: Supplementary Table S1: Model estimates from the linear mixed-effects model for Greater kudu explaining the variation in FGM concentrations in Ruaha–Rungwa ecosystem.
References
- Ahlering MA, Maldonado JE, Eggert LS, Fleischer RC, Western D, Brown JL (2013) Conservation outside protected areas and the effect of human-dominated landscapes on stress hormones in Savannah elephants. Conserv Biol 27: 569–575. 10.1111/cobi.12061. [DOI] [PubMed] [Google Scholar]
- Averbeck C (2002) Population ecology of impala (Aepyceros melampus) and community-based wildlife conservation in Uganda Doctoral dissertation. Technische Universität München, Munich, Germany. Retrieved from http://mediatum.ub.tum.de/?id=603260. [Google Scholar]
- Bateman PW, Fleming PA (2017) Are negative effects of tourist activities on wildlife over-reported? A review of assessment methods and empirical results. Biol Conserv 211: 10–19. 10.1016/j.biocon.2017.05.003. [DOI] [Google Scholar]
- Bates D, Mächler M, Bolker BM, Walker SC (2015) Fitting linear mixed-effects models using lme4. J Stat Softw 67. 10.18637/jss.v067.i01. [DOI] [Google Scholar]
- Boonstra R (2013) Reality as the leading cause of stress: rethinking the impact of chronic stress in nature. Funct Ecol 27: 11–23. 10.1111/1365-2435.12008. [DOI] [Google Scholar]
- Burnham KP, Anderson DR (2002) Model Selection an d Inference: A Practical Information-Theoretic Approach, 2nd Edition. Springer-Verlag, New York. 10.5751/ES-00404-060111. [DOI] [Google Scholar]
- Chizzola M, Belton L, Ganswindt A, Greco I, Hall G, Swanepoel L, Dalerum F (2018) Landscape Level Effects of Lion Presence (Panthera leo) on Two Contrasting Prey Species. Front Ecol Evol 6. 10.3389/fevo.2018.00191. [DOI] [Google Scholar]
- Codron D, Lee-Thorp JA, Sponheimer M, Codron J (2007) Stable carbon isotope reconstruction of ungulate diet changes through the seasonal cycle. S Afr J Wildl Res 37: 117–125. 10.3957/0379-4369-37.2.117. [DOI] [Google Scholar]
- Corlatti L, Palme R, Frey-Roos F, Hackländer K (2011) Climatic cues and glucocorticoids in a free-ranging riparian population of red deer (Cervus elaphus). Folia Zool 60: 176–180. 10.25225/fozo.v60.i2.a1.2011. [DOI] [Google Scholar]
- Creel S, Dantzer B, Goymann W, Rubenstein DR (2013) The ecology of stress: effects of the social environment. Funct Ecol 27: 66–80. 10.1111/j.1365-2435.2012.02029.x. [DOI] [Google Scholar]
- Dalmau A, Ferret A, Chacon G, Manteca X (2007) Seasonal changes in fecal cortisol metabolites in Pyrenean chamois. J Wildl Manag 71: 190–194. 10.2193/2005-492. [DOI] [Google Scholar]
- Dantzer B, Santicchia F, Kesteren F, Palme R, Martinoli A, Wauters LA (2016) Measurement of fecal glucocorticoid metabolite levels in Eurasian red squirrels (Sciurus vulgaris) effects of captivity, sex, reproductive condition, and season. J Mammal 97: 1385–1398. 10.1093/jmammal/gyw095. [DOI] [Google Scholar]
- Deng Y, Wang S, Bai X, Tian Y, Wu L, Xiao J, Chen F, Qian Q (2018) Relationship among land surface temperature and LUCC, NDVI in typical karst area. Sci Rep 8: 641. 10.1038/s41598-017-19088-x. [DOI] [PMC free article] [PubMed] [Google Scholar]
- Di Minin E, Leader-Williams N, Bradshaw CJA (2016) Banning trophy hunting will exacerbate biodiversity loss. Trends Ecol Evol 31: 99–102. 10.1016/j.tree.2015.12.006. [DOI] [PubMed] [Google Scholar]
- Didan K (2015) MOD/MYD13Q1 MODIS/Terra/aqua vegetation indices 16-day L3 global 250m SIN grid V006.
- Flølo LM, Hunninck L, May R, Jackson CR, Setsaas TH, Holmern T, Røskaft E (2021) Behavioural and demographic changes in impala populations after 15 years of improved conservation management. Glob Ecol Conserv 27: e01586. 10.1016/j.gecco.2021.e01586. [DOI] [Google Scholar]
- Frid A, Dill L (2002) Human-caused disturbance stimuli as a form of predation risk. Conserv Ecol 6: 11. 10.5751/ES-00404-060111. [DOI] [Google Scholar]
- Gairin E, Dussenne M, Mercader M, Berthe C, Reynaud M, Metian M, Mills SC, Lenfant P, Besseau L, Bertucci Fet al. (2022) Harbours as unique environmental sites of multiple anthropogenic stressors on fish hormonal systems. Molec Cell Endocrinol 555: 111727. 10.1016/j.mce.2022.111727. [DOI] [PubMed] [Google Scholar]
- Garine-Wichatitsky M, Fritz H, Gordon IJ, Illius AW (2004) Bush selection along foraging pathways by sympatric impala and greater kudu. Oecologia 141: 66–75. 10.1007/s00442-004-1630-3. [DOI] [PubMed] [Google Scholar]
- Giudice MD, Buck CL, Chaby LE, Gormally BM, Taff CC, Thawley CJ, Vitousek MN, Wada H (2018) What is stress? A systems perspective. Integrat Compar Biol 58: 1019–1032. 10.1093/icb/icy114. [DOI] [PubMed] [Google Scholar]
- Goodale E, Ruxton GD, Beauchamp G (2019) Predator eavesdropping in a mixed-species environment: how prey species May use grouping. Front Ecol Evol 7: 00141. 10.3389/fevo.2019.00141. [DOI] [Google Scholar]
- Hamilton RH, Chrysikou EG, Coslett B (2011) Mechanisms of aphasia recovery after stroke and the role of noninvasive brain stimulation. Brain Lang 118: 40–50. 10.1016/j.bandl.2011.02.005. [DOI] [PMC free article] [PubMed] [Google Scholar]
- Hamilton WD (1971) Geometry for the selfish herd. J Theor Biol 31: 295–311. 10.1016/0022-5193(71)90189-5. [DOI] [PubMed] [Google Scholar]
- Hariohay KM, Jackson CR, Fyumagwa RD, Røskaft E (2018) Trophy hunting versus ecotourism as a conservation model? Assessing the impacts on ungulate behaviour and demographics in the Ruaha-Rungwa ecosystem, Central Tanzania. Environ Nat Resource Res 8: 33. 10.5539/enrr.v8n2p33. [DOI] [Google Scholar]
- Hariohay KM, Munuo WA, Røskaft E (2020) Human–elephant interactions in areas surrounding the Rungwa, Kizigo, and Muhesi game reserves, Central Tanzania. Oryx 54: 612–620. 10.1017/S003060531800128X. [DOI] [Google Scholar]
- Hariohay KM, Ranke PS, Fyumagwa RD, Kideghesho JR, Røskaft E (2019) Drivers of conservation crimes in the Rungwa-Kizigo-Muhesi game reserves. Glo Ecol Conserv 17: e00522. 10.1016/10.1016/j.gecco.2019.e00522. [DOI] [Google Scholar]
- Harris RBS (2015) Chronic and acute effects of stress on energy balance: are there appropriate animal models? Am J Physiol Regul Integr Comp Physiol 308: R250–R265. 10.1152/ajpregu.00361.2014. [DOI] [PMC free article] [PubMed] [Google Scholar]
- Hennessy MB, Kaiser S, Sachser N (2009) Social buffering of the stress response: diversity, mechanisms, and functions. Front Neuroendocrinol 30: 470–482. 10.1016/j.yfrne.2009.06.001. [DOI] [PubMed] [Google Scholar]
- Heylen BC, Nachtsheim DA (2018) Bio-telemetry as an Essential Tool in Movement Ecology and Marine Conservation. Paper presented at the YOUMARES 8 – Oceans Across Boundaries: Learning from each other, Cham, 10.1007/978-3-319-93284-2_7. [DOI] [Google Scholar]
- Hoffmann M (2016) IUCN SSC Antelope Specialist Group: Assessment of Tragelaphus strepsiceros, greater kudu. Geneva, Switzerland. Retrieved from http://www.iucnredlist.org. [Google Scholar]
- Hopcraft JGC, Olff H, Sinclair ARE (2010) Herbivores, resources and risks: alternating regulation along primary environmental gradients in savannas. Trends Ecol Evol 25: 119–128. 10.1016/j.tree.2009.08.001. [DOI] [PubMed] [Google Scholar]
- Huber S, Palme R, Arnold W (2003) Effects of season, sex, and sample collection on concentrations of fecal cortisol metabolites in red deer (Cervus elaphus). Gen Comp Endocrinol 130: 48–54. 10.1016/S0016-6480(02)00535-X. [DOI] [PubMed] [Google Scholar]
- Hunninck L, Jackson CR, May R, Røskaft E, Palme R, Sheriff MJ (2020a) Triiodothyronine (T3) levels fluctuate in response to ambient temperature rather than nutritional status in a wild tropical ungulate. Conservation. Phys Ther 8: coaa105. 10.1093/conphys/coaa105. [DOI] [Google Scholar]
- Hunninck L, May R, Jackson CR, Palme R, Røskaft E, Sheriff MJ (2020b) Consequences of climate-induced vegetation changes exceed those of human disturbance for wild impala in the Serengeti ecosystem. Conservation. Phys Ther 8: coz117. 10.1093/conphys/coz117. [DOI] [PMC free article] [PubMed] [Google Scholar]
- Hunninck L, Palme R, Sheriff MJ (2020c) Stress as a facilitator? Territorial male impala have higher glucocorticoid levels than bachelors. Gen Comp Endocrinol 297: 113553. 10.1016/j.ygcen.2020.113553. [DOI] [PubMed] [Google Scholar]
- Hunninck L, Ringstad IH, Jackson CR, May R, Fossøy F, Uiseb K, Killian W, Palme R, Røskaft E (2017) Being stressed outside the park—conservation of African elephants (Loxodonta africana) in Namibia. Conserv Physiol 5: 11. 10.1093/conphys/cox067. [DOI] [PMC free article] [PubMed] [Google Scholar]
- Jarman PJ, Jarman MV (1973) Social behaviour, population structure and reproductive potential in impala. East Afr Wildl J 11: 329–338. 10.1111/j.1365-2028.1973.tb00097.x. [DOI] [Google Scholar]
- Kie JG (1999) Optimal foraging and risk of predation: effects on behavior and social structure in ungulates. J Mammal 80: 1114–1129. 10.2307/1383163. [DOI] [Google Scholar]
- Knappa EJ, Peaceb N, Bechtelb L (2017) Poachers and poverty: assessing objective and subjective measures of poverty among illegal hunters outside Ruaha National Park. Tanzania Conserv Soc 15: 24–32. 10.4103/0972-4923.201393. [DOI] [Google Scholar]
- Kyando M, Ikanda D, Røskaft E (2017) Hotspot elephant-poaching areas in the eastern Selous game reserve, Tanzania. Afr J Ecol 55: 365–371. 10.1111/aje.12363. [DOI] [Google Scholar]
- Lindsey PA, Alexander R, Frank LG, Mathieson A, Romañach SS (2006) Potential of trophy hunting to create incentives for wildlife conservation in Africa where alternative wildlife-based land uses may not be viable. Anim Conserv 9: 283–291. 10.1111/j.1469-1795.2006.00034.x. [DOI] [Google Scholar]
- Lunde ET, Bech C, Fyumagwa RD, Jackson C, Røskaft E (2016) Assessing the effect of roads on impala (Aepyceros melampus) stress levels using faecal glucocorticoid metabolites. Afr J Ecol 54: 434–441. 10.1111/aje.12302. [DOI] [Google Scholar]
- Madliger CL, Love OP, Hultine KR, Cooke SJ (2018) The conservation physiology toolbox: status and opportunities. Conserv Physiol 6: 29. 10.1093/conphys/coy029. [DOI] [PMC free article] [PubMed] [Google Scholar]
- Mahoney SP, Geist V (2019) The North American model of wildlife conservation. Johns Hopkins University Press, Baltimore, USA. 10.1353/book.67481. [DOI] [Google Scholar]
- Maloiy GMO, Hopcraft D (1971) Thermoregulation and water relations of two east african antelopes: the hartebeest and impala. Comp Biochem Physiol 38: 525–534. 10.1016/0300-9629(71)90119-8. [DOI] [PubMed] [Google Scholar]
- Marshal JP, Grange S, Marneweck D (2012) Seasonal variation in body condition of impala at Manyeleti game reserve, South Africa. S Afr J Wildl Res 42: 128–137. 10.3957/056.042.0212. [DOI] [Google Scholar]
- Marttila O (2011) The great savanna, the national parks of Tanzania and other key conservation areas. Auris Publishers, Rauha, Finland. [Google Scholar]
- Midgley GF, Bond WJ (2015) Future of African terrestrial biodiversity and ecosystems under anthropogenic climate change. Nat Clim Change 5: 823–829. 10.1038/nclimate2753. [DOI] [Google Scholar]
- Millspaugh JJ, Washburn BE (2003) Within-sample variation of fecal glucocorticoid measurements. Gen Comp Endocrinol 132: 21–26. 10.1016/s0016-6480(03)00061-3. [DOI] [PubMed] [Google Scholar]
- Millspaugh JJ, Washburn BE (2004) Use of fecal glucocorticoid metabolite measures in conservation biology research: considerations for application and interpretation. Gen Comp Endocrinol 138: 189–199. 10.1016/j.ygcen.2004.07.002. [DOI] [PubMed] [Google Scholar]
- Millspaugh JJ, Woods RJ, Hunt KE, Raedeke KJ, Brundige GC, Washburn BE, Wasser SK (2001) Fecal glucocorticoid assays and the physiological stress response in elk. Wildl Soc Bull 29: 899–907. [Google Scholar]
- Möstl E, Maggs JL, Schrötter G, Besenfelder U, Palme R (2002) Measurement of cortisol metabolites in Faeces of ruminants. Vet Res Commun 26: 127–139. 10.1023/A:1014095618125. [DOI] [PubMed] [Google Scholar]
- Nakagawa S, Cuthill IC (2007) Effect size, confidence interval and statistical significance: a practical guide for biologists. Biol Rev 82: 591–605. 10.1111/j.1469-185X.2007.00027.x. [DOI] [PubMed] [Google Scholar]
- Niang I, Ruppel OC, Abdrabo MA, Essel A, Lennard C, Padgham J, Urquhart P (2014) Africa. In VR Barros, CB Field, DJ Dokken, MD Mastrandrea, KJ Mach, TE Bilir, M Chatterjee, KL Ebi, YO Estrada, RC Genova, B Girma, ES Kissel, AN Levy, S MacCracken, PR Mastrandrea, LL White, eds, Climate Change 2014: Impacts, Adaptation, and Vulnerability. Retrieved from Cambridge, United Kingdom and New York, USA. [Google Scholar]
- Nyahongo JW (2008) Flight initiation distances of five herbivores to approaches by vehicles in the Serengeti National Park, Tanzania. Afr J Ecol 46: 227–229. 10.1111/j.1365-2028.2007.00818.x. [DOI] [Google Scholar]
- Oduor S, Brown J, Macharia GM, Boisseau N, Murray S, Obade P (2020) Differing physiological and behavioral responses to anthropogenic factors between resident and non-resident African elephants at Mpala ranch, Laikipia County, Kenya. PeerJ 8: e10010. 10.7717/peerj.10010. [DOI] [PMC free article] [PubMed] [Google Scholar]
- Palme R (2019) Non-invasive measurement of glucocorticoids: advances and problems. Physiol Behav 199: 229–243. 10.1016/j.physbeh.2018.11.021. [DOI] [PubMed] [Google Scholar]
- Palme R, Rettenbacher S, Touma C, El-Bahr SM, Möstl E (2005) Stress hormones in mammals and birds: comparative aspects regarding metabolism, excretion, and noninvasive measurement in fecal samples. Ann N Y Acad Sci 1040: 162–171. 10.1196/annals.1327.021. [DOI] [PubMed] [Google Scholar]
- Pérez-Barbería FJ, García AJ, Cappelli J, Landete-Castillejos T, Serrano MP, Gallego L (2020) Heat stress reduces growth rate of red deer calf: climate warming implications. PLOS ONE 15: e0233809. 10.1371/journal.pone.0233809. [DOI] [PMC free article] [PubMed] [Google Scholar]
- Pettorelli N, Chauvenet ALM, Duffy JP, Cornforth WA, Meillere A, Baillie JEM (2012) Tracking the effect of climate change on ecosystem functioning using protected areas: Africa as a case study. Ecol Indic 20: 269–276. 10.1016/j.ecolind.2012.02.014. [DOI] [Google Scholar]
- Pettorelli N, Ryan S, Mueller T, Bunnefeld N, Jedrzejewska B, Lima M, Kausrud K (2011) The normalized difference vegetation index (NDVI): unforeseen successes in animal ecology. Climate Res 46: 15–27. 10.3354/cr00936. [DOI] [Google Scholar]
- Pettorelli N, Vik JO, Mysterud A, Gaillard J-M, Tucker CJ, Stenseth NC (2005) Using the satellite-derived NDVI to assess ecological responses to environmental change. Trends Ecol Evol 20: 503–510. 10.1016/j.tree.2005.05.011. [DOI] [PubMed] [Google Scholar]
- Pirotta E, Booth CG, Costa DP, Fleishman E, Kraus SD, Lusseau D, Moretti D, New LF, Schick RS, Schwarz LKet al. (2018) Understanding the population consequences of disturbance. Ecol Evol 8: 9934–9946. 10.1002/ece3.4458. [DOI] [PMC free article] [PubMed] [Google Scholar]
- Pokharel SS, Singh B, Seshagiri PB, Sukumar R (2019) Lower levels of glucocorticoids in crop-raiders: diet quality as a potential ‘pacifier’ against stress in free-ranging Asian elephants in a human-production habitat. Anim Conserv 22: 177–188. 10.1111/acv.12450. [DOI] [Google Scholar]
- Pulliam HR (1973) On the advantages of flocking. J Theor Biol 38: 419–422. 10.1016/0022-5193(73)90184-7. [DOI] [PubMed] [Google Scholar]
- R Core Team . (2020). R: a language and environment for statistical computing. Retrieved from http://www.R-project.org/.
- Rehnus M, Wehrle M, Palme R (2014) Mountain hares Lepus timidus and tourism: stress events and reactions. J Appl Ecol 51: 6–12. 10.1111/1365-2664.12174. [DOI] [Google Scholar]
- Roberts G (1996) Why individual vigilance declines as group size increases. Anim Behav 51: 1077–1086. 10.1006/anbe.1996.0109. [DOI] [Google Scholar]
- Santicchia F, Wauters LA, Dantzer B, Westrick SE, Ferrari N, Romeo C, Palme R, Preatoni DG, Martinoli A (2020) Relationships between personality traits and the physiological stress response in a wild mammal. Current Zool 66: 197–204. 10.1093/cz/zoz040. [DOI] [PMC free article] [PubMed] [Google Scholar]
- Santos JPV, Acevedo P, Carvalho J, Queirós J, Villamuelas M, Fonseca C, Gortázar C, López-Olvera JR, Vicente J (2018) The importance of intrinsic traits, environment and human activities in modulating stress levels in a wild ungulate. Ecol Indic 89: 706–715. 10.1016/j.ecolind.2018.02.047. [DOI] [Google Scholar]
- Sapolsky RM, Romero LM, Munck AU (2000) How do glucocorticoids influence stress responses? Integrating permissive, suppressive, stimulatory, and preparative actions*. Endocr Rev 21: 55–89. 10.1210/edrv.21.1.0389. [DOI] [PubMed] [Google Scholar]
- Seebacher F (2022) Interactive effects of anthropogenic environmental drivers on endocrine responses in wildlife. Molec Cell Endocrinol 556: 111737. 10.1016/j.mce.2022.111737. [DOI] [PubMed] [Google Scholar]
- Setsaas T, Hunninck L, Jackson CR, May R, Røskaft E (2018) The impacts of human disturbances on the behaviour and population structure of impala (Aepyceros melampus) in the Serengeti ecosystem, Tanzania. Glob Ecol Conserv 16: e00467. 10.1016/j.gecco.2018.e00467. [DOI] [Google Scholar]
- Sheriff MJ, Dantzer B, Delehanty B, Palme R, Boonstra R (2011) Measuring stress in wildlife: techniques for quantifying glucocorticoids. Oecologia 166: 869–887. 10.1007/s00442-011-1943-y. [DOI] [PubMed] [Google Scholar]
- Shrestha AK, Wieren SE, Langevelde F, Fuller A, Hetem RS, Meyer L, Bie S, Prins HHT (2014) Larger antelopes are sensitive to heat stress throughout all seasons but smaller antelopes only during summer in an African semi-arid environment. Int J Biometeorol 58: 41–49. 10.1007/s00484-012-0622-y. [DOI] [PubMed] [Google Scholar]
- Sih A, Ferrari MCO, Harris DJ (2011) Evolution and behavioural responses to human-induced rapid environmental change. Evol Appl 4: 367–387. 10.1111/j.1752-4571.2010.00166.x. [DOI] [PMC free article] [PubMed] [Google Scholar]
- Stabach JA, Boone RB, Worden JS, Florant G (2015) Habitat disturbance effects on the physiological stress response in resident Kenyan white-bearded wildebeest (Connochaetes taurinus). Biol Conserv 182: 177–186. 10.1016/j.biocon.2014.12.003. [DOI] [Google Scholar]
- Strack AM, Sebastian RJ, Schwartz MW, Dallman MF (1995) Glucocorticoids and insulin: reciprocal signals for energy balance. Am J Physiol Regul Integr Comp Physiol 268: R142–R149. 10.1152/ajpregu.1995.268.1.R142. [DOI] [PubMed] [Google Scholar]
- Tingvold HG (2011) Does human activities affect stress level in Serengeti elephants (Loxodonta africana)? (MSc MSc). Norwegian University of Science and Technology, Trondheim, Norway. [Google Scholar]
- Tingvold HG, Fyumagwa R, Baardsen LF, Rosenlund H, Bech C, Røskaft E (2013) Determining adrenocortical activity as a measure of stress in African elephants (Loxodonta africana) in relation to human activities in Serengeti ecosystem. Afr J Ecol 51: 580–589. 10.1111/aje.12069. [DOI] [Google Scholar]
- URT (2007) Wildlife Policy of Tanzania. Retrieved from Dar es Salaam, Tanzania. [Google Scholar]
- Ven TMFN, McKechnie AE, Cunningham SJ (2019) The costs of keeping cool: behavioural trade-offs between foraging and thermoregulation are associated with significant mass losses in an arid-zone bird. Oecologia 191: 205–215. 10.1007/s00442-019-04486-x. [DOI] [PubMed] [Google Scholar]
- Vilela S, Alves da Silva A, Palme R, Ruckstuhl KE, Sousa JP, Alves J (2020) Physiological stress reactions in Red Deer induced by hunting activities. Animals 10: 1003. 10.3390/ani10061003. [DOI] [PMC free article] [PubMed] [Google Scholar]
- Wan Z, Hook S, Hulley G (2015) MOD11A2 MODIS/Terra land surface temperature/emissivity 8-day L3 global 1km SIN grid V006. Nasa Eosdis Land Processes Daac 10. 10.5067/MODIS/MYD11A1.006. [DOI] [Google Scholar]
- Wronski T (2002) Feeding ecology and foraging behaviour of impalaAepyceros melampusin Lake Mburo National Park, Uganda. Afr J Ecol 40: 205–211. 10.1046/j.1365-2028.2002.00348.x. [DOI] [Google Scholar]
Associated Data
This section collects any data citations, data availability statements, or supplementary materials included in this article.
Supplementary Materials
Data Availability Statement
The data that support the findings of this study are available from the corresponding author upon reasonable request.