

Abstract
The therapeutic benefits of metered dose inhalers (MDIs) in pulmonary disorders are mainly driven by aerosol performance, which depends on formulation variables (drug and excipients), device design, and patient interactions. The present study provides a comprehensive investigation to better understand the effect of formulation variables on mometasone furoate (MF) suspension-based MDI product performance. The effects of MF particle size (volume median diameter; X50) and excipient concentration (ethanol and oleic acid, cosolvent, and surfactant, respectively) on selected critical quality attributes (delivered dose (DD), fine particle dose of particles lesser than 5 μm (FPD < 5), ex-throat dose and median dissolution time (MDT)) were studied. Eight MF-MDI formulations (one per batch) were manufactured based on a reduced factorial design of experiment (DOE) approach, which included relevant formulation levels with varying X50 (1.1 and 2 μm), concentration of ethanol (0.45, 0.9, 1.8, and 3.6%w/w), and oleic acid (0.001 and 0.025%w/w). The in vitro evaluation of these MF-MDI formulations indicated the importance of drug particle’s X50, oleic acid, and ethanol canister concentration as critical formulation variables governing the performance of MF suspension-based MDI products. The effect of these formulation variables on DD, FPD < 5, ex-throat dose, and MDT was subsequently utilized to develop empirical relationships linking formulation factors with effects on in vitro performance measures. The developed strategy could be useful for predicting MF-MDI product performance during MDI product development and manufacturing. The systematic DOE approach utilized in this study may provide insights into the understanding of the formulation variables governing the MF-MDI product performance.
Keywords: cascade impactor, critical quality attributes, delivered dose, empirical correlations, fine particle dose, mean dissolution time, metered dose inhalers, mouth-throat models
INTRODUCTION
Metered dose inhalers (MDIs), incorporating solution- or suspension-based formulations, are widely used for inhalation therapy in a number of lung disorders (1, 2) due to their higher regional pulmonary effects and reduced systemic side effects (3–5). The overall performance of MDI products has shown to be affected by formulation and device characteristics (6) and the patient/device interaction (7). While the in vitro properties, such as the aerodynamic particle size distribution (APSD) (8) and plume geometry (2, 4), are generally used for characterizing MDIs, more comprehensive studies assessing the relationships among formulation variables (e.g., surfactant and co-solvent concentrations, and particle size of the active pharmaceutical ingredient (API)) and in vitro product performance are rare (5).
Several reports have evaluated the effect of changes in individual formulation variables (e.g., drug particle size, co-solvent, or surfactant concentrations) on in vitro MDI performance (6, 9–11). However, there is a need for a systematic, multifactorial evaluation of the effects of formulation variables on MDI product performance (12, 13), with the goal to relate formulation variables to in vitro performance data. This is especially true as regulatory guidelines encourage the use of modeling approaches to establish ranges for formulation variables within which the desired product performance could be attained (14). Recently, such an approach has evaluated the effects of albuterol sulfate suspension-MDI and beclomethasone dipropionate (BDP) solution-MDI formulation variables (ethanol and oleic acid concentrations and, in the case of albuterol sulfate suspension MDI, drug volumetric median diameter (X50)) on critical in vitro aerosol performance parameters like delivered dose (DD) and APSD (2). These investigations were further extended to predict the effect of these formulation variables on in vivo lung deposition using an in silico computational lung dosimetry model (15).
In this study, we were interested in widening these investigations by evaluating suspension-based MDIs of lipophilic corticosteroids. Therefore, a suspension-based mometasone furoate (MF)-MDI system was selected for evaluating the effects of formulation variables on selected critical in vitro performance properties of MDIs. Consequently, a reduced factorial DOE approach coupled with subsequent statistical analysis including multivariate polynomial regression was applied. By employing a DOE approach, (i) a number of MF-MDI batches, which differed in formulation characteristics, were prepared, and (ii) subsequently evaluated through relevant in vitro tests; (iii) the effects of formulation variables on selected in vitro performance attributes were statistically evaluated and (iv) it was hypothesized that the empirical relationships describing the effect of formulation variables on the critical in vitro characteristics can be developed. The goal of this work was to evaluate, in general, relationships between formulation factors and performance, not to establish a quality by design framework. To increase the relevance for formulators in pharmaceutical industry, it was decided to perform experiments with formulations related to a commercial MDI product (containing approximately 1.81%w/w and 0.0049%w/w ethanol and oleic acid canister concentrations, respectively). Using these formulation attributes as a reference, the impact of changes in ethanol and oleic acid concentrations as well as MF particle size (see Table I) on in vitro performance was evaluated as relevant formulation variables (2). Furthermore, two additional product variables, moisture content and in vitro performance after 1-month storage at 40 °C/75%RH, were included. In vitro performance was assessed using pharmacopeial as well as non-pharmacopeial (dissolution and ex-throat dose) methodologies. It was hypothesized that this investigation will allow development of empirical relationships linking formulation factors with in vitro performance measures. It was outside of the scope of this work to evaluate the physicochemical mechanisms involved. While these studies might be relevant for quality by design approaches, it was not the goal of this work to develop such an approach or define target properties and design spaces for the commercial MDI product.
Table I.
Formulation Variables of MF-MDI Batches Manufactured. Target Values Along with Actual Values. Data for Actual Values (n = 3) Are Presented as Mean (%RSD)
| Batch No. | Formulation variables |
Net fill weight in g (%RSD) | |||||
|---|---|---|---|---|---|---|---|
| Drug particle size X50 (μm)# |
Ethanol (%w/w) |
Oleic acid (%w/w) |
|||||
| Target | Actual (%RSD) | Target | Actual (%RSD) | Target | Actual (%RSD) | ||
| 1 | 1.1 | 1.07 (1.94) | 0.45 | 0.42 (0.72) * | 0.001 | 0.0007 (27.1) * | 14.82 (0.9) |
| 2 | 2.0 | 1.98 (0.58) | 0.45 | 0.43 (0.49) | 0.025 | 0.0198 (4.3) * | 15.00 (1.1) |
| 3 | 2.0 | 1.98 (0.58) | 0.90 | 0.87(1.15) | 0.001 | 0.0012 (7.7) * | 14.73 (0.5) |
| 4 | 1.1 | 1.07 (1.94) | 0.90 | 0.90 (0.74) | 0.025 | 0.0257 (0.7) * | 14.80 (0.5) |
| 5 | 2.0 | 1.98 (0.58) | 1.80 | 1.79 (0.32) | 0.001 | 0.0039 (5.4) * | 14.67 (2.1) |
| 6 | 1.1 | 1.07 (1.94) | 1.80 | 1.77(0.86) | 0.025 | 0.0276 (0.2) * | 14.78 (1.3) |
| 7 | 1.1 | 1.07 (1.94) | 3.60 | 3.52 (0.43) | 0.001 | 0.0036(4.5) * | 14.80 (0.6) |
| 8 | 2.0 | 1.98 (0.58) | 3.60 | 3.59 (0.89) | 0.025 | 0.0304 (3.2) * | 14.73 (1.0) |
Actual values outside ± 5% of the target;
X50 Drug particle size determined as volumetric median diameter;
RSD Relative standard deviation
MATERIALS AND METHODS
Materials
Propellant HFA-227 was purchased from Dupont (Wilmington, DE, USA), 50μL EPDM metering valves were purchased from Aptar Pharma (Congers, NY, USA), and 17 mL uncoated aluminum canisters were purchased from Presspart (Blackburn, UK). Dulera® (MF 200 μg per actuation, the commercial MDI product selected for the study) along with the corresponding commercially available actuators (Merck, Whitehouse Station, NJ, USA) were purchased from a local pharmacy in NC (USA); the latter were modified by Recipharm Laboratories, Inc., to accommodate the Aptar metering valves and were used for all aerosol testing. All laboratory solvents were HPLC grade and purchased from Fisher Scientific. All other materials used in the study are described in the sections below.
Analytical Methods
The following analytical methods were utilized for the quantification of MF and excipients (ethanol and oleic acid), total fatty acid content, moisture content, MF volumetric median diameter (X50), and in vitro MDI product characterization during reverse engineering of the commercial MDI product and for characterization of the MF-MDI batches formulated using a DOE approach. Details of the analytical methods can be found in the Supplementary Information section.
MF and Excipients Canister Content
Samples for MF and oleic acid content analysis were prepared by freezing (−70 °C) the MDI canisters to liquefy their content, followed by cutting the canisters and assaying the whole content. Samples for ethanol content were prepared by spraying forty actuations from each MDI canister into a 200-mL volumetric flask partially filled with n-propanol (internal standard) solution in water (details in Supplementary section). Ethanol and oleic acid contents were determined using gas chromatography coupled with flame-ionization detection (GC-FID; Supplementary Information, Sections S1 and S2). Both ethanol and oleic acid GC-FID methods showed a precision of < 1.5% RSD with 97.0 to 103.0% accuracy. Calibration curves of oleic acid and ethanol were linear between 32 and 96 μg/mL, and 160 and 270 μg/mL, respectively.
For MF content and impurities, canister contents were dissolved in methanol and analyzed by HPLC–UV using BDP (a compound with similar lipophilicity) as an internal standard (16) (Supplementary Information, Table S1).
Drug Particle Size Distribution
A wet dispersion static laser-light diffraction method was used for determining the volumetric median diameter (X50) of MF collected from both commercial MDIs (reverse engineering) and manufactured MDIs (MF-MDI batches). For X50 determination, the MDIs (n = 3) were first sprayed into a scintillation vial followed by wetting with a concentrated polysorbate 80-glycerol aqueous solution. A few drops of this wetted suspension were dispersed in a relatively dilute acidified polysorbate 80-glycerol aqueous dispersing agent. The acidified aqueous dispersing agent was confirmed to dissolve formoterol fumarate dihydrate in the commercial MDI products while adequately dispersing the MF, for which X50 in the dispersion was determined by laser-light diffraction (Sympatec Helos H0877).
In the case of bulk MF (LGM Pharma, USA), X50 was determined by laser-light diffraction using the Sympatec Helos H0877 in combination with a RODOS model T4.1 dry dispersion unit.
Moisture Content
The moisture content of the MDIs (n = 4) was measured using a Karl Fisher Coulometer (Metrohm 831 Coulometric Titrator) as described in USP < 921 > (17). The Karl Fisher Coulometer was validated for precision testing by measuring the water content of a Hydranal water standard 1.00 (Fluka) with two consecutive measurements being within the manufacturer’s listed range. Prior to testing, the aspiration needle (Victor G. & Co., 18 G × 6 inches) coupled to the valve stem using 4 × 2.4 mm tubing and an actuation plate (fabricated by Recipharm Laboratories, Inc.) was primed with four actuations. Subsequently, five actuations were delivered to the titration cell by direct injection to determine the moisture content. About 3 samples per canister were collected (total 12 samples from 4 canisters). The method’s precision was determined to be within 97 to 103% with < 2% RSD between canisters (n = 3).
Delivered Dose
The DD was determined using a modified collection apparatus and a similar method to that described in USP < 601 > (18) at ambient laboratory conditions of 22 ± 3 °C and 50 ± 10% RH.
The sampling device consisted of a 500-mL separator funnel with a cotton plug. For sampling, the MDI canisters (n = 4) were shaken vertically (5 s), primed (5 actuations), connected through an adaptor to the separator funnel and actuated manually (< 1 s actuation-hold time) twice at an interval of 10 s to discharge the spray plume into the separator funnel. While the adaptor was not assayed during routine runs, it was found to contribute negligibly (~ 1–2% mass) during method development. The experimental set-up employed an air flow adjusted to 28.3 L/min (± 5%). After 30 s resting period, the MDIs were decoupled from the collection apparatus and the deposited drug was dissolved in approximately 50 mL of HPLC grade methanol containing 5 μg/mL of BDP as an internal standard. Three beginning of canister life samples per canister were collected (a total of 12 samples from 4 canisters). The collected samples were analyzed for MF using HPLC–UV-MSD (Supplementary Information, Section S3 and Table S1).
Aerodynamic Particle Size Distribution
APSD was determined using a Next Generation Impactor (NGI) (Apparatus 6 described in USP < 601 >) operated at 30 L/min (± 5%) at ambient laboratory conditions of 22 ± 3 °C and 50 ± 10% RH in conjunction with the standard USP induction port and stages without coating, as previously reported (2). Before testing, the MDIs (n = 4) were shaken vertically (5 s) and primed (5 actuations), connected through an adaptor to the USP induction port, and actuated manually (< 1 s actuation-hold time) twice at an interval of 10 s. Adaptor deposition was found to be negligible (~ 1–2% mass) during method development. After 30 s resting period, the vacuum pump was stopped, and the MDIs were decoupled. The NGI was dismantled and individual components (NGI stages, including the filter, valve stem, actuator, and induction port) were washed down using approximately 50 mL of HPLC grade methanol. The quantitative analysis of MF was performed by HPLC–UV-MSD (Supplementary Information, Section S3 and Table S1).
The mass median aerodynamic diameter (MMAD) and geometric standard deviation (GSD), NGI total delivered dose (sum of drug deposited on all stages, USP induction port, and filter; NGI-DD), fine particle fraction (particles smaller than 5 μm; FPF < 5), and fine particle dose (particles smaller than 5 μm; FPD < 5) were calculated using NGI data as described elsewhere (2).
The FPF < 5 was derived by linear interpolation between the ex-device cumulative percent mass on stage 4 to filter (≤ 3.99 μm) and the ex-device cumulative percent mass on stage 3 to filter (≤ 6.4 μm). The FPD < 5 was obtained by multiplication of the FPF < 5 and the total ex-device mass collected from the induction port to the filter (e.g., NGI-DD).
MMAD and geometric standard deviation (GSD) were calculated by linear regression of the inverse normal of the percent cumulative distribution of the aerodynamic diameter vs. log of effective cut-off diameter. The cut-off diameters specified in USP < 601 > for the NGI at 30 L/min were used (18).
Ex-Throat Dose
The ex-throat dose (also called in vitro lung dose) was determined for all three (small, medium, and large) anatomical mouth-throat (MT) models (Emmace Consulting, Lund), originally developed by the Oropharyngeal Consortium (19). Prior to testing, the interior of the MT was coated with a Brij/glycerol solution (1.7% Brij35, 6.3% water, 38% glycerol, and 54% ethanol). For the analysis, the outlet of the MT model was connected to an integral filter (AirLife, model 303EU from Carefusion), which was then attached to an internal vacuum line via the NGI (used as a tripod). To ensure a tight fit between the MDI and the inlet of the MT model, a silicon adapter was used (Supplementary Information, Fig. S1). The analysis was performed at four different air flow rates (15, 30, 60, and 90 L/min). After each run (n = 2/batch/flow), the filter was removed and extracted five times with 15 mL ethanol containing Propagin (6 mg/L) as an internal standard. A 0.5 mL aliquot of the extract was then mixed with 0.8 mL of water and 50 μL were analyzed by HPLC–UV at 254 nm (Supplementary Information, Table S1).
In vitro Dissolution
In vitro dissolution testing was conducted using commercially available Transwell® plates (Corning, Tewksbury, MA, 24 mm diameter, 0.4 μm pore size), as described previously (20). The ex-throat dose of MDIs was collected at the exit of a custom-made Alberta Idealized Throat (AIT) model (provided by Boehringer Ingelheim, USA) to remove the dose fraction that is likely to be deposited in the mouth/throat region (20). For coating the model’s surface area, the AIT model (consisting of two units that, when combined, formed the 3-dimensional inner mouth-throat structure) was opened to make the inner surface of the model accessible. The surface was coated with an emulsion prepared by mixing 10 mL of ethanol, 0.5 g of Brij 80 (Sigma), and 50 g of glycerol, by spreading by hand (glove covered) about 2 mL of the coating mixture evenly across the surface to form a thin film. After about 30 min to allow evaporation of the ethanol, the outlet of the reassembled model was connected to a custom-made dose collection unit containing a 24-mm glass microfiber filter paper (Whatman GF/C™). Airflow through the assembled unit was controlled by a Copley® HCP5 high-capacity vacuum pump. A customized silicone mouthpiece adapter was utilized for the MDI device to provide an air-tight connection between the inhalation device and the throat model. The MDI was then actuated once at a flow rate of 30 L/min (± 5%) and the sample was deposited on a filter paper (25 mm in diameter, Corning®) which was placed in a custom-made filter holder and attached to the outlet of the AIT model. Before testing, the MDIs (n = 6) were shaken vertically (5 s) and primed (5 actuations).
One representative section of the five drug-containing filter sections was then placed face-up on the Transwell® donor compartment. A volume of 1.4 mL of the dissolution medium (0.5% Tween 80) was placed into the receptor compartment. Dissolution testing was initiated by adding 500 μL of 0.5% Tween 80 as a dissolution medium onto the donor compartment. The Transwell® system was kept in an incubator at 37 °C and 100% relative humidity (RH) for the duration of the experiment and the receptor compartment was stirred with a micro magnetic stir bar. At defined time points (10, 20, 30, 45 min, and 1, 1.5, 2, 3, 4, 5, 6, 8, 12, and 24 h), 0.5 mL samples were withdrawn from the receptor compartment and the volume was replaced with fresh dissolution medium. After the last sampling time point, the filter paper was washed with methanol to measure the amount of undissolved drug. The collected samples were analyzed for MF content by HPLC and UV detect ion at 254 nm (Supplementary Information, Table S1). Experiments were performed in hexaplicate for a given formulation.
The cumulative fraction of drug dissolved over time was calculated. For statistical analysis and empirical correlations, the median dissolution time (MDT; the time when 50% of the drug has been dissolved) was determined by applying the monomolecular model to the mean dissolution data with representing the fraction (%) of drug released at time t (21) and then estimating the MDT from the following equation.
MF-MDIs with Changes in Formulation Variables
Reduced Factorial Design of Experiments
A reduced factorial design of experiments (DOE) was used to explore the effects of formulation variables (X50, ethanol, and oleic acid concentrations) on critical quality attributes (CQAs) of manufactured MF-MDIs. The inactive ingredients used in the MF-MDI model system were based on reverse engineering of the commercial MDI product (Dulera®), considering Q1 (qualitative) and Q2 (quantitative) sameness; Q1 and Q2 are defined elsewhere (22). The DOE plan utilized the targets of formulation variables determined from the MF-MDI model system as central points and added low and high levels from the central points for detection of effects. Two oleic acid concentrations (0.001 or 0.025% w/w) and four ethanol concentrations (0.45, 0.90, 1.80, and 3.60%w/w) were selected accordingly. The X50 of 1.1 and 2.0 μm were selected based on the evaluation of micronization process capabilities using the Fluid Energy or Glenn Mills jet mills. Applying this reduced factorial DOE plan, a total of 8 MF-MDI formulations (Table I) were manufactured in a randomized order. The CQAs such as, MF canister content, moisture content, DD, APSD parameters, ex-throat dose, and in vitro dissolution (MDT) were assessed for these formulations.
Preparation and Characterization of MF-MDI Batches
A Fluid Energy PE JET-O-MIZER jet mill (Model 00, Fluid Energy PE, USA) using pusher and grinder pressures of 40 psi each was used to obtain micronized MF at volumetric median diameter of approximately 2.0 μm. A Glen Mills LHM001 jet mill (USA) using pusher and grinder pressures of 120 psi each was used to obtain micronized MF at volumetric median diameters of 1.1 to 1.2 μm. The micronized powders were allowed to equilibrate at room temperature for at least 1-month prior use. The particle size distribution of the resulting micronized MF was determined by dry dispersion laser-light diffraction method, as described above.
The MF-MDI batches (Table I) were prepared using laboratory scale MDI filling equipment (Diaphragm filler with a 3-L jacketed vessel; Pamasol, Switzerland). HFA-227 was used as a propellant. To decrease the introduction of moisture, the canisters and valves were vacuum crimped (Vacuum Crimper, model-02002/021, Pamasol, Switzerland). To ensure adequate mixing of micronized MF with excipients (ethanol, oleic acid (dissolved in ethanol), and propellant), such that the MF aggregates were sufficiently broken up, an in-line homogenizer (operated at 13,500 rpm) was used. The MF formulations were stirred and recirculated between the homogenizer and the vessel to prevent changes in MF concentration (e.g., via creaming) over the life of the batch. The MF formulations were filled into canisters and equilibrated in a valve down position for 2 weeks at ambient temperature. The MF-MDI batches were analyzed (n = 3) for X50 and concentrations of ethanol and oleic acid were determined experimentally (Table I). Representative samples from all the eight MF-MDI batches were stored valve down for 1-month at 40 °C/75% RH (accelerated conditions).
The MF-MDI batches were characterized for MF content (6 canisters per batch, one determination per canister), moisture content (3 determinations per canister, 4 canisters per batch), DD (3 determinations per canister, 4 canisters per batch), and APSD parameters (1 determination per canister, 4 canisters per batch) at the initial time-point (ambient temperature; after equilibration) and after 1-month storage at 40 °C/75%RH (accelerated conditions). The other CQAs (ex-throat dose (n = 2/batch/flow rate) and MDT (n = 6)) were only determined for seven MF-MDI batches after 6-month storage at 25 °C/65%RH (ambient conditions).
Statistical Data Analysis
The potential effects of formulation variables and 1-month storage at accelerated conditions (40 °C/75%RH) were evaluated by a main effect analysis of variance (ANOVA) using SAS v9.2 and JMP v13.0. The target values of drug particle size (X50), ethanol and oleic acid concentrations (Table I) were used as independent variables (factors). The statistical analysis was performed to determine the effect of design factors on CQAs. DD and FPD < 5 were used as primary parameters, and the secondary parameters were (i) MF canister content, (ii) NGI-DD, (iii) moisture content, (iv) ex-throat dose, and (v) MDT. The design factors were considered to have a statistically significant effect when the associated p-value was < 0.05.
Multivariate Polynomial Curve Fitting Approaches
Based on residuals analysis, various multivariate polynomial curve fits were evaluated to identify the model that best related a given aerosol performance attribute (DD, FPD < 5, ex-throat dose, or MDT) to formulation variables (ethanol and oleic acid concentrations and X50), in addition to flow rate in the ex-throat dose testing and stability after storage under accelerated condition (1 month at 40 °C/75%RH). During model development, actual assay values (not target values) of formulation variables were used (Table I). In general, only factors that significantly affected the MDI performance characteristics were included during the model building. The exception was the factors for MDT that was included, although no significance was reached, as it was likely that non-significance was due to high variability. The number of replicates could not be increased because of the extreme time intensity of the assay. Various empirical linear, power-linear, and log-linear models were evaluated. The final models were selected based on the review of plotted data (residual analysis) and explanatory power, defined as proportion (%) of total variation explained.
RESULTS AND DISCUSSION
A total of eight MF-MDI batches were manufactured with two MF particle sizes (X50), four concentrations of ethanol, and two concentrations of oleic acid. The MF X50 of 1.1 and 2.0 μm were selected based on the micronization process capabilities and their similarities to the commercial MDI product (Dulera®) based on the results of reverse engineering (X50 = 1.72 μm). Similar to the previous study (2), larger number of ethanol levels (four) were selected (0.45, 0.9, 1.8, and 3.6%w/w) to bracket the ethanol canister concentration found in the reverse engineered commercial MDI product (1.81%w/w). The selected DOE approach allowed studying the effect of multiple factors with a limited number of experiments (12). Among potential designs, a reduced factorial design was considered adequate for the statistical analysis and subsequent quantitative evaluation of the effects of formulation factors on in vitro performance attributes.
Composition of MDI Formulations
The first step within the characterization of the MF-MDI batches was to determine whether the actual canister composition agreed with target values.
MF Canister Content
MF canister content (0.309–0.339%w/w) and net fill weight (14.67–15.00 g) were within ± 5% of the target values (0.323%w/w and 14.73 g, respectively; Table I and II). All MF-MDI batches were stable with less than a 3% change in MF canister content after 1 month storage at 40 °C/75%RH.
Table II.
Critical Quality Attributes (CQAs) of Mometasone Furoate (MF) MDI Batches at Initial and After Storage at Controlled Conditions
| MF-MDI batch | Formulation variables | CQAs of MF-MDI Formulations at Initial and After a 1 or 6 Month Storage under Controlled Conditions |
||||||||||||
|---|---|---|---|---|---|---|---|---|---|---|---|---|---|---|
| X50 (μm) EtOH (%w/w) OA (%w/w) |
MF canister content (%w/w) |
Moisture content |
DD$$ (μg) |
NGI# DD (μg) |
FPD < 5## (μg) |
MMAD### (μm) |
MDT** (h) | |||||||
| Initial* | 1 month$ | Initial* | 1 month$ | Initial* | 1 month$ | Initial* | 1 month$ | Initial* | 1 month$ | Initial* | 1 month$ | 6 month@ | ||
| 1 | 1.07 0.42 0.0007 |
0.3392 (0.5008) | 0.3319 (0.4%) | 323 (5.2) | 326 (4.8) | 201 (4.4) | 183 (4.5) | 174 (4.5) | 166 (3.9) | 112 (2.3) | 106.9 (2.1) | 2.4 (4.5) | 2.40 (0.9) | 4.6 |
| 2 | 1.98 0.43 0.0198 |
0.3094 (2.8388) | 0.3068 (2.0%) | 861 (11.5) | 777 (6.9) | 107 (16.6) | 91 (16.8) | 86 (14.2) | 84 (11.7) | 20 (45.3) | 13.1 (44.3) | 5.5 (35.9) | 6.17 (8.5) | ND |
| 3 | 1.98 0.87 0.0012 |
0.3313 (0.5672) | 0.3283 (0.3%) | 222 (17.0) | 302 (4.7) | 190 (2.7) | 194 (4.3) | 182 (7.8) | 160 (2.9) | 84 (13.3) | 71.5 (4.4) | 3.2 (6.3) | 3.27 (2.7) | 3.4 |
| 4 | 1.07 0.90 0.0257 |
0.3240 (0.5359) | 0.3259 (0.8%) | 329 (2.5) | 392 (5.3) | 194 (3.0) | 180 (4.9) | 164 (2.1) | 153 (8.8) | 92 (4.6) | 84.0 (6.0) | 2.6 (2.0) | 2.54 (1.4) | 6.7 |
| 5 | 1.98 1.79 0.0039 |
0.3104 (0.7218) | 0.3126 (0.5%) | 260 (4.0) | 409 (4.7) | 191 (2.5) | 183 (3.6) | 163 (3.0) | 164 (2.1) | 69 (4.5) | 64.4 (2.6) | 3.0 (5.9) | 2.82 (2.9) | 4.9 |
| 6 | 1.07 1.77 0.0276 |
0.3285 (1.0092) | 0.3237 (1.8%) | 355 (5.9) | 465 (3.8) | 191 (3.4) | 194 (2.4) | 188 (4.3) | 167 (1.1) | 98 (5.0) | 84.6 (0.5) | 2.6 (3.4) | 2.62 (3.8) | 4.9 |
| 7 | 1.07 3.52 0.0036 |
0.3380 (0.6595) | 0.3283 (2.1%) | 566 (6.0) | 851 (3.5) | 213 (2.2) | 213 (2.2) | 193 (2.2) | 186 (2.3) | 88 (2.4) | 72.2 (9.8) | 2.4 (5.8) | 2.27 (6.3) | 2.6 |
| 8 | 1.98 3.59 0.0304 |
0.3287 (0.8130) | 0.3225 (1.4%) | 373 (5.5) | 501 (4.4) | 202 (5.2) | 200 (8.7) | 177 (2.2) | 164 (3.2) | 54 (5.4) | 42.1 (1.4) | 3.3 (2.4) | 3.14 (9.1) | 5.2 |
Data presented as mean (%RSD)
EtOH ethanol; OA oleic acid; X50 MF volumetric median diameter
Analysis at initial time-point (at 2 weeks of equilibration after manufacturing)
Analysis after a 1-month storage at 40 °C/75%RH (accelerated condition)
DD delivered dose
NGI next generation impactor
FPD < 5 fine particle dose lesser than 5 μm
MAAD mass median aerodynamic diameter
MDT median dissolution time
Analysis after a 6-month storage at 25 °C/60%RH (ambient condition)
Ethanol and Oleic Acid Content
Except for batch #1, all batches showed ethanol concentrations within ± 5% of the target values (Table I). On the other hand, except for batch #4, oleic acid concentrations differed generally by more than ± 5% of the target values. While ethanol and MF canister concentrations were within 5% of the target values, oleic acid concentrations differed significantly from the target values (Table I), especially at the lower target concentration of 0.001%w/w. Analytical challenges might have been the reason as oleic acid concentrations were close to the lower limit of quantification (LLOQ). Since the two target oleic acid concentrations were sufficiently different (0.001 and 0.025%w/w), the batches were deemed acceptable with the target concentrations used within the statistical analysis and subsequent empirical correlation exercises.
While the target canister concentrations of ethanol and MF were achieved in the MF-MDI batch #2, a suboptimal MDI performance was observed (Table II and Fig. 2a–b). Batch #2 combined the highest oleic acid concentration (0.025%w/w) with the lowest ethanol content (0.45% w/w). Thus, the inability of the system to evenly suspend and deliver the MF appropriately may be a consequence of low ethanol canister concentration, which may not be sufficient for solubilization of the oleic acid. Prevention of caking and drug particle adhesion to canister walls are among the important function of the surfactants in suspension-base MDI products (23). When transferred to a pressure resistant glass container, it was possible to visualize that batch #2 exhibited aggregated MF particles and caky residue accumulated at the walls, indicating an unstable MF suspension (Supplementary Information, Fig. S2). Because of these observations, batch #2 was not included in the ex-throat dose and dissolution studies. Moreover, batch #2 was excluded from statistical analysis and empirical correlations.
Fig. 2.
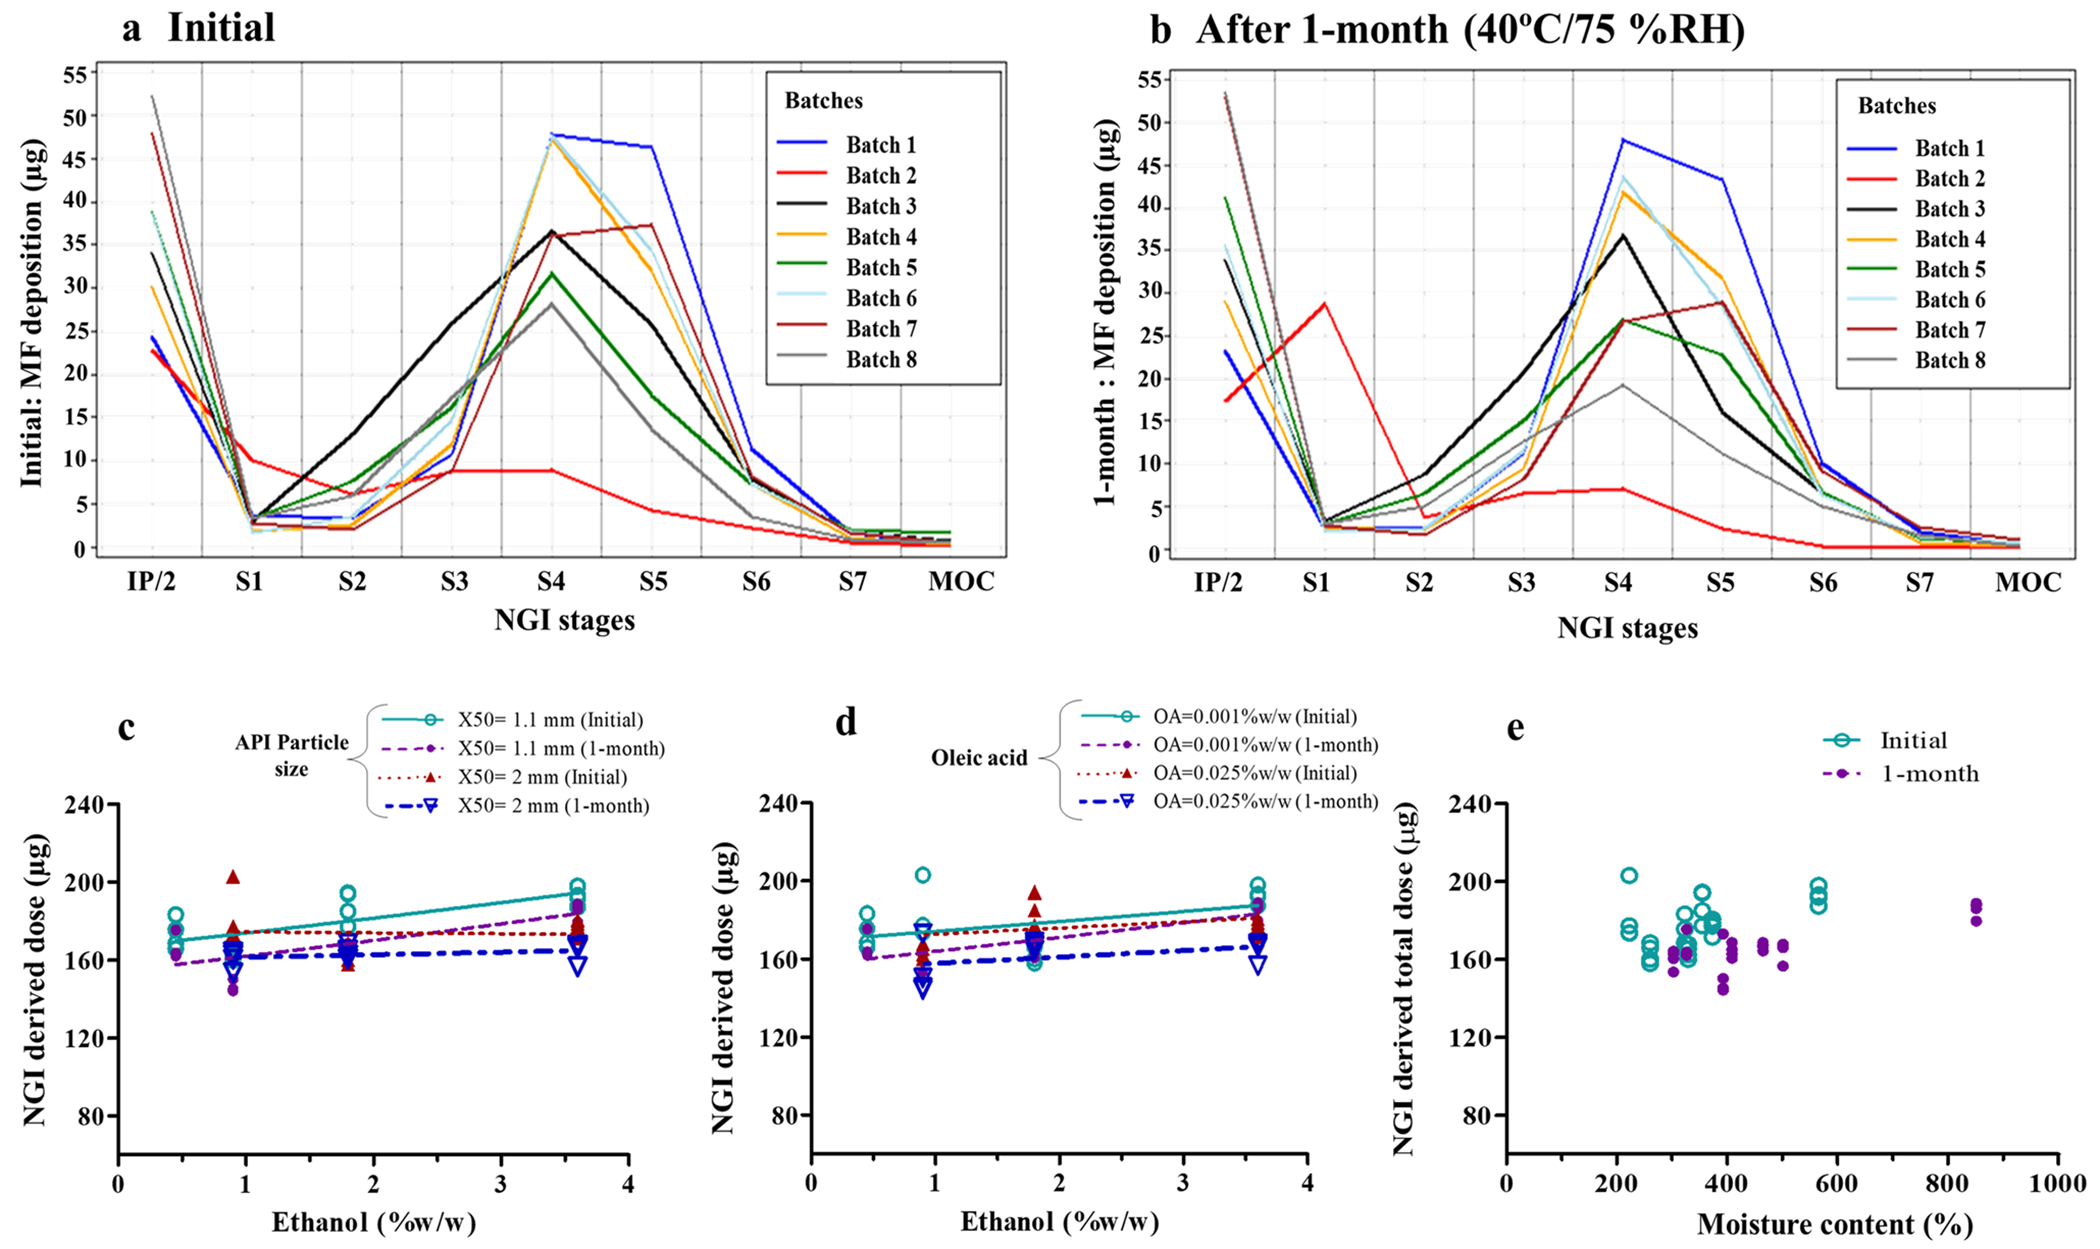
Drug deposition on Next Generation Impactor (NGI) stages of MF-MDI batches at initial timepoint (a) and after 1-month storage at accelerated conditions (b). Effect of ethanol concentration (c and d) and moisture content (e) on NGI delivered dose. Symbols indicate mean values (n = 4) of each batch and lines represent the linear regression (c–e). IP = induction port, in which the mean value was divided by 2 to allow visualization of batch differences on NGI stages with low deposition
Moisture Content
Except for batch #2 (861 ± 99.0 ppm), all other MF-MDI batches showed mean moisture content between 222 and 566 ppm (Table II). Moisture content was higher for MF-MDI formulations with higher ethanol concentration (Fig. 1a and b). However, at higher oleic acid concentration (0.025% w/w), the effect of ethanol on moisture content was not as evident (Fig. 1b). Moisture content was lower for MF-MDI formulations with higher MF particle size (X50) (Fig. 1a), while it was higher in MF-MDI formulations with higher oleic acid concentration (Fig. 1b). In all cases, moisture content was higher after 1-month storage at 40 °C/75%RH (Fig. 1a and b). This change in moisture content after 1-month storage differed between batches (Table II), ranging from 1% increase for batch #1 (0.45% ethanol) to > 50% for batch #5 (1.8% ethanol) and batch #7 (3.6% ethanol). Therefore, a more pronounced increase in moisture content following 1-month storage at 40 °C/75% RH was generally observed for MF-MDI batches containing higher ethanol concentrations (Fig. 1). Even at lower concentrations, ethanol (p = 0.03) and oleic acid (p = 0.0007) showed significant effects on moisture content (Table III). It may be hypothesized that the increase in moisture content during 1-month storage at 40°C/75%RH could have influenced the droplet size due to differential evaporation rates, resulting in a decrease in FPD < 5 (Table II).
Fig. 1.

Effect of formulation variables and 1-month storage at 40 °C/75%RH on moisture content (MC) (a, b) and delivered dose (DD) (c, d) of MF-MDI formulations. Symbols indicate mean values (n = 12) of each batch, and lines represent the linear regression
Table III.
Summary (p-values) of Statistical ANOVA Analysis Comparing the Effect of Formulation Variables on Critical Quality Attributes (CQAs)
| Critical quality attributes (CQAs) | Formulation variables |
After 1-month storage at 40°C/75%RH | Experimental condition (flow rate) | ||
|---|---|---|---|---|---|
| Drug particle size (X50) | Concentration of ethanol | Concentration of oleic acid | |||
| Drug content uniformity | 0.1337 | 0.1163 | 0.7258 | 0.2694 | - |
| Moisture content | 0.0015 * | 0.0007 * | 0.0356 * | 0.0070 * | - |
| DD | 0.2433 | 0.0122 * | 0.2433 | 0.2565 | - |
| NGI-DD | 0.1182 | 0.1140 | 0.1183 | 0.0427 * | - |
| FPD < 5 | 0.0001 * | 0.0014 * | 0.0445 * | 0.0049 * | - |
| Ex-throat dose (Small OPC model) | < 0.0001* | < 0.0001* | 0.6007 | - | 0.0108 * |
| Ex-throat dose (Medium OPC model) | < 0.0001* | < 0.0001* | 0.9574 | - | < 0.0001* |
| Ex-throat dose (Large OPC model) | < 0.0001* | < 0.0001* | 0.0075 * | - | < 0.0001* |
| Median dissolution time (MDT) | 0.80 | 0.84 | 0.38 | - | - |
Data were analyzed excluding the MF-MDI batch #2; X50 Volumetric median diameter
OPC oropharyngeal consortium
Formulation variable that shows statistically significant effect on CQAs
Statistical analysis showed a significant effect of X50 (p < 0.01), ethanol (p < 0.001), oleic acid (p < 0.05), and 1-month storage at 40 °C/75%RH (p < 0.01) on moisture content (Table III). Least square mean estimates suggested a threefold (189 to 572 ppm) increase in moisture content following a change in ethanol concentration from the lowest to the highest level (Supplementary information. Table S2). Based on the least square mean estimates, moisture content increased across all batches by about 38% after 1-month storage at 40 °C/75%RH (Table III).
Effects on In Vitro Attributes
Delivered Dose
To ensure consistency in DD, MDI canisters were shaken as previously recommended (24) to resuspend the drug before measurements. DD ranged from 190 to 213 μg (Table II), which was within 95–105% of the marketed MF-containing commercial MDI product (200 μg MF), except in case of the MF-MDI batch #2 (107 ± 16.6 μg). In agreement with our previous report (2), a marginal (~ 4%) decrease in DD following 1-month storage at 40 °C/75%RH was observed, indicating a good stability of manufactured MF-MDIs, even at low oleic acid canister concentrations. DD increased significantly (p < 0.05) with increasing ethanol content (Fig. 1c, d, and Table III). This is in contrast to results for beclomethasone dipropionate solution-based MDIs in our previous report (2) and may be related to the effect of ethanol on total mass of formulation atomized after the actuation (i.e., formulation density) (5).
Oleic acid content and MF X50 did not affect DD (Fig. 1c, d, and Table III). Surfactants are believed to play a significant role in achieving a uniform DD by reducing the risk of spray orifice clogging and particle adhesion to the canister and valve components (5, 25). The lack of significant effects by oleic acid on the DD seems to suggest that the stabilizing action of oleic acid could have been achieved already at the lower oleic acid canister concentration. Because we did not observe any effect of MF X50 and oleic acid on DD, ethanol concentration was the only formulation variable considered for the model predictions of the DD.
Neither a linear (DD = 183.9 + 6.166·(ethanol)) nor the logarithmic (DD = 192.2 + 8.256·ln(ethanol)) model predictions described the observed DD data sufficiently well (Fig. 6a). Both quadratic (DD = 194.8–8.9877·ethanol + 3.5629·(ethanol)2) and exponential (DD = 189.1 + 0.2227·exp(1.2430·ethanol)) models showed the best fits, also the agreement between observed and predicted estimates was modest, explaining 65% and 63% total variation in DD, respectively (Table IV and Fig. 6a). Nonetheless, the quadratic model would predict an increase in DD at lower ethanol canister concentrations, which seems unlikely based on the physicochemistry involved in this process. Hence, the exponential model (DD = 189.1 + 0.2227·exp(1.2430·(ethanol)) was selected as the final model for DD.
Fig. 6.

(a) Predicting mean delivered dose (DD) as function of ethanol (EtOH) concentration (% w/w). (b) Residuals from predicting fine particle dose lesser than 5 μm (FPD < 5) by MF particle size (X50), ethanol, and oleic acid concentrations and 1-month storage at accelerated conditions. (c–e) Residuals from predicting ex-throat dose by MF particle size (X50), ethanol, and oleic acid concentrations and flow rate for (c) small, (d) medium, and (e) large OPC MT models. (f) Predicted median dissolution time (MDT) of MF-MDI batches using different models
Table IV.
Empirical Relationship Between Formulation Variables and Critical Quality Attributes (CQAs). Final Models Are Bolded
| CQAs (units) | Model | Explanatory power (%) | Parameter estimates££ |
|||||
|---|---|---|---|---|---|---|---|---|
| a | b | C | d | e | f | |||
| Delivered dose (DD)¥€ (μg) | Linear* | 53 | 183.9 | 6.1661 | - | - | - | - |
| Logarithmic** | 36 | 192.2 | 8.2558 | - | - | - | - | |
| Quadratic*** | 65€€ | 194.8 | −8.9877 | 3.5629 | - | - | - | |
| Exponential **** | 63 £ | 189.1 | 0.2227 | 1.2430 | - | - | - | |
| Fine particle dose (FPD < 5) (μg) | Linear @ | 95.45 £ | 145.0 | −28.2883 | −7.7373 | −376.5 | −10.4214 | - |
| Logarithmic## | 95.13 | 90.9436 | −39.2121 | −12.5078 | −2.2072 | −15.0349 | - | |
| Exponential### | 94.71 | 5.1946 | −0.3688 | −0.0963 | −5.5558 | −0.1208 | - | |
| Ex-throat dose with small OPC MT model (μg) | Linear@ | 83.42 | 37.9064 | −10.9490 | −3.3273 | −37.9462 | - | 0.0127 |
| Logarithmic # | 88.14 £ | 19.2889 | −14.8554 | −6.0536 | −0.00409 | - | 1.0532 | |
| Exponential$ | 89.21 | 4.2461 | −0.7917 | −0.2238 | −6.2408 | - | 0.00101 | |
| Ex-throat dose with medium OPC MT model (μg) | Linear@ | 96.64 | 79.8291 | −22.6470 | −5.7243 | −30.8814 | - | 0.4442 |
| Logarithmic # | 96.47 £ | 5.2211 | −31.4493 | −9.9946 | 0.3722 | - | 18.6402 | |
| Exponential$ | 96.16 | 4.4463 | −0.4069 | −0.0978 | −1.5779 | - | 0.00719 | |
| Ex-throat dose with large OPC MT model (μg) | Linear@ | 90.58 | 137.7 | −27.5419 | −10.2923 | −352.1 | - | 0.2176 |
| Logarithmic # | 95.47 £ | 56.5606 | −36.8022 | −17.7577 | −1.7626 | - | 10.3191 | |
| Exponential$ | 92.29 | 5.0946 | −0.3472 | −0.1238 | −5.4365 | - | 0.00236 | |
| Median dissolution time (MDT) (μg) | Linear@ | 73.7 | 4.2337 | 0.2779 | −0.5918 | 81.5988 | - | - |
| Logarithmic # | 84.1 £ | 9.5463 | 0.7428 | −1.4125 | 0.9011 | - | - | |
| Exponential$ | 75.7 | 1.3475 | 0.1159 | −0.1496 | 19.0469 | - | - | |
Final model was selected based on explanatory power (equivalent to R2*100), except for DD
Quadratic model would predict an increase in DD at lower ethanol canister concentrations, which is unlikely as per physicochemistry involved
Units for formulation variables used during modeling: X50 (in μm), ethanol (in %w/w), oleic acid (in %w/w), flow rate (in mL), and storage (1 month in 40°C/75%RH)
Mathematical model for DD was developed as function of ethanol concentration only
For numerical comparison with DD, a linear regression model for NGI-DD was developed as, NGI-DD (μg) = 163.380 + 4.598·(ethanol). The direction for the linear regression for NGI-DD is consistent with DD
DD (μg) = a + b·(ethanol)
DD = a + b·ln(ethanol)
DD = a + b·(ethanol) + c·(ethanol) 2
DD = a + b·exp(c·ethanol)
CQA = a – b·(X50) + c·(ethanol) + d·(oleic acid) + e·(1-month) + f·(flow rate)
CQA = a + b·ln(X50) + c·ln(ethanol) + d·ln(oleic acid) + e·ln(1-month) + f·ln(flow rate)
CQA = a + b×exp(X50) + c×exp(ethanol) + d×exp(oleic acid) + e×exp(1-month)+ f×exp(flow rate)
Aerodynamic Particle Size Distribution
To assess the effects of formulation variables on typical in vitro performance characteristics relevant for pulmonary deposition, cascade impactor-based parameters were studied. These included NGI-DD, FPD < 5, and MMAD. Estimates for NGI-DD were generally 20% lower than DD estimates. The APSD profiles observed initially and after 1-month storage at 40 °C/75%RH are shown in Fig. 2a and b. The primary (NGI-DD and FPD < 5) and secondary (MMAD) APSD parameters obtained from NGI profiles are shown in Table II. In agreement with other results, the MF-MDI batch #2 showed anomalous APSD parameters (Fig. 2a and b) with a very low mean NGI-DD of 87 μg MF, almost 60% less than the target value (200 μg). Excluding batch #2, the mean NGI-DD ranged from 165 to 193 μg MF (Table II).
None of the formulation variables demonstrated a significant effect on NGI-DD (Table III, Fig. 2c, d). NGI-DD was marginally (~ 6%) but significantly (p < 0.05) lower after 1-month storage a 40 °C/75%RH (Table II and III, Fig. 2c). Estimates for NGI-DD were generally 20% lower than DD estimates. Unlike DD, which was significantly affected by ethanol, the NGI-DD was not influenced significantly by any of the three formulation variables (Table III) with p values only reaching 0.1 for ethanol. The following might be relevant for these observations. DD measurements were made in triplicate. However, this was not the case for the NGI-DD measurements, because of the overall complexity of the assay procedure. Hence, data points used for the statistical analysis of DD were based on the mean of triplicate estimates while this was not the case for NGI-DD. NGI-DD measurements, as such, were further likely to be more variable because of the overall complexity of the assay procedure (i.e., sum of stage deposition data) and loss of drug during the execution of the procedure. We believe that the lack of significance of the ethanol effect on NGI-DD might be related to above observations, especially as the trend for an increase in NGI-DD with ethanol concentration as indicated in Fig. 2c.
The MF-MDI batch #2 showed very low FPD < 5 (20 μg MF) and high MMAD (5.5 μm) (Table II). Excluding batch #2, all other formulations showed FPD < 5 and MMAD within a range of 54 to 112 μg MF and 2.4 to 3.3 μm, respectively.
NGI deposition data indicated increased induction port deposition with higher ethanol concentration (Fig. 2a and Table II). In line with the previous work (2), FPD < 5 was significantly decreased with an increase in X50 (p < 0.001), ethanol (p < 0.01), or oleic acid concentration (p < 0.05) (Fig. 3, Table II and III), all these factors being relevant for affecting deposition related events. The effect of ethanol on FPD < 5 was associated with higher X50 and oleic acid concentrations (Fig. 3a and b). Overall, all four variables (X50, ethanol, and oleic acid concentrations and 1-month storage at 40 °C/75%RH) had a statistically significant effect on the FPD < 5 (Table III) and the magnitude of these effects were 37%, 46%, 9%, and 14%, respectively (Supplementary information. Table S2). FPD < 5 decreased with increased X50 following 1-month storage at 40 °C/75%RH (Fig. 3, Table II and III).
Fig. 3.
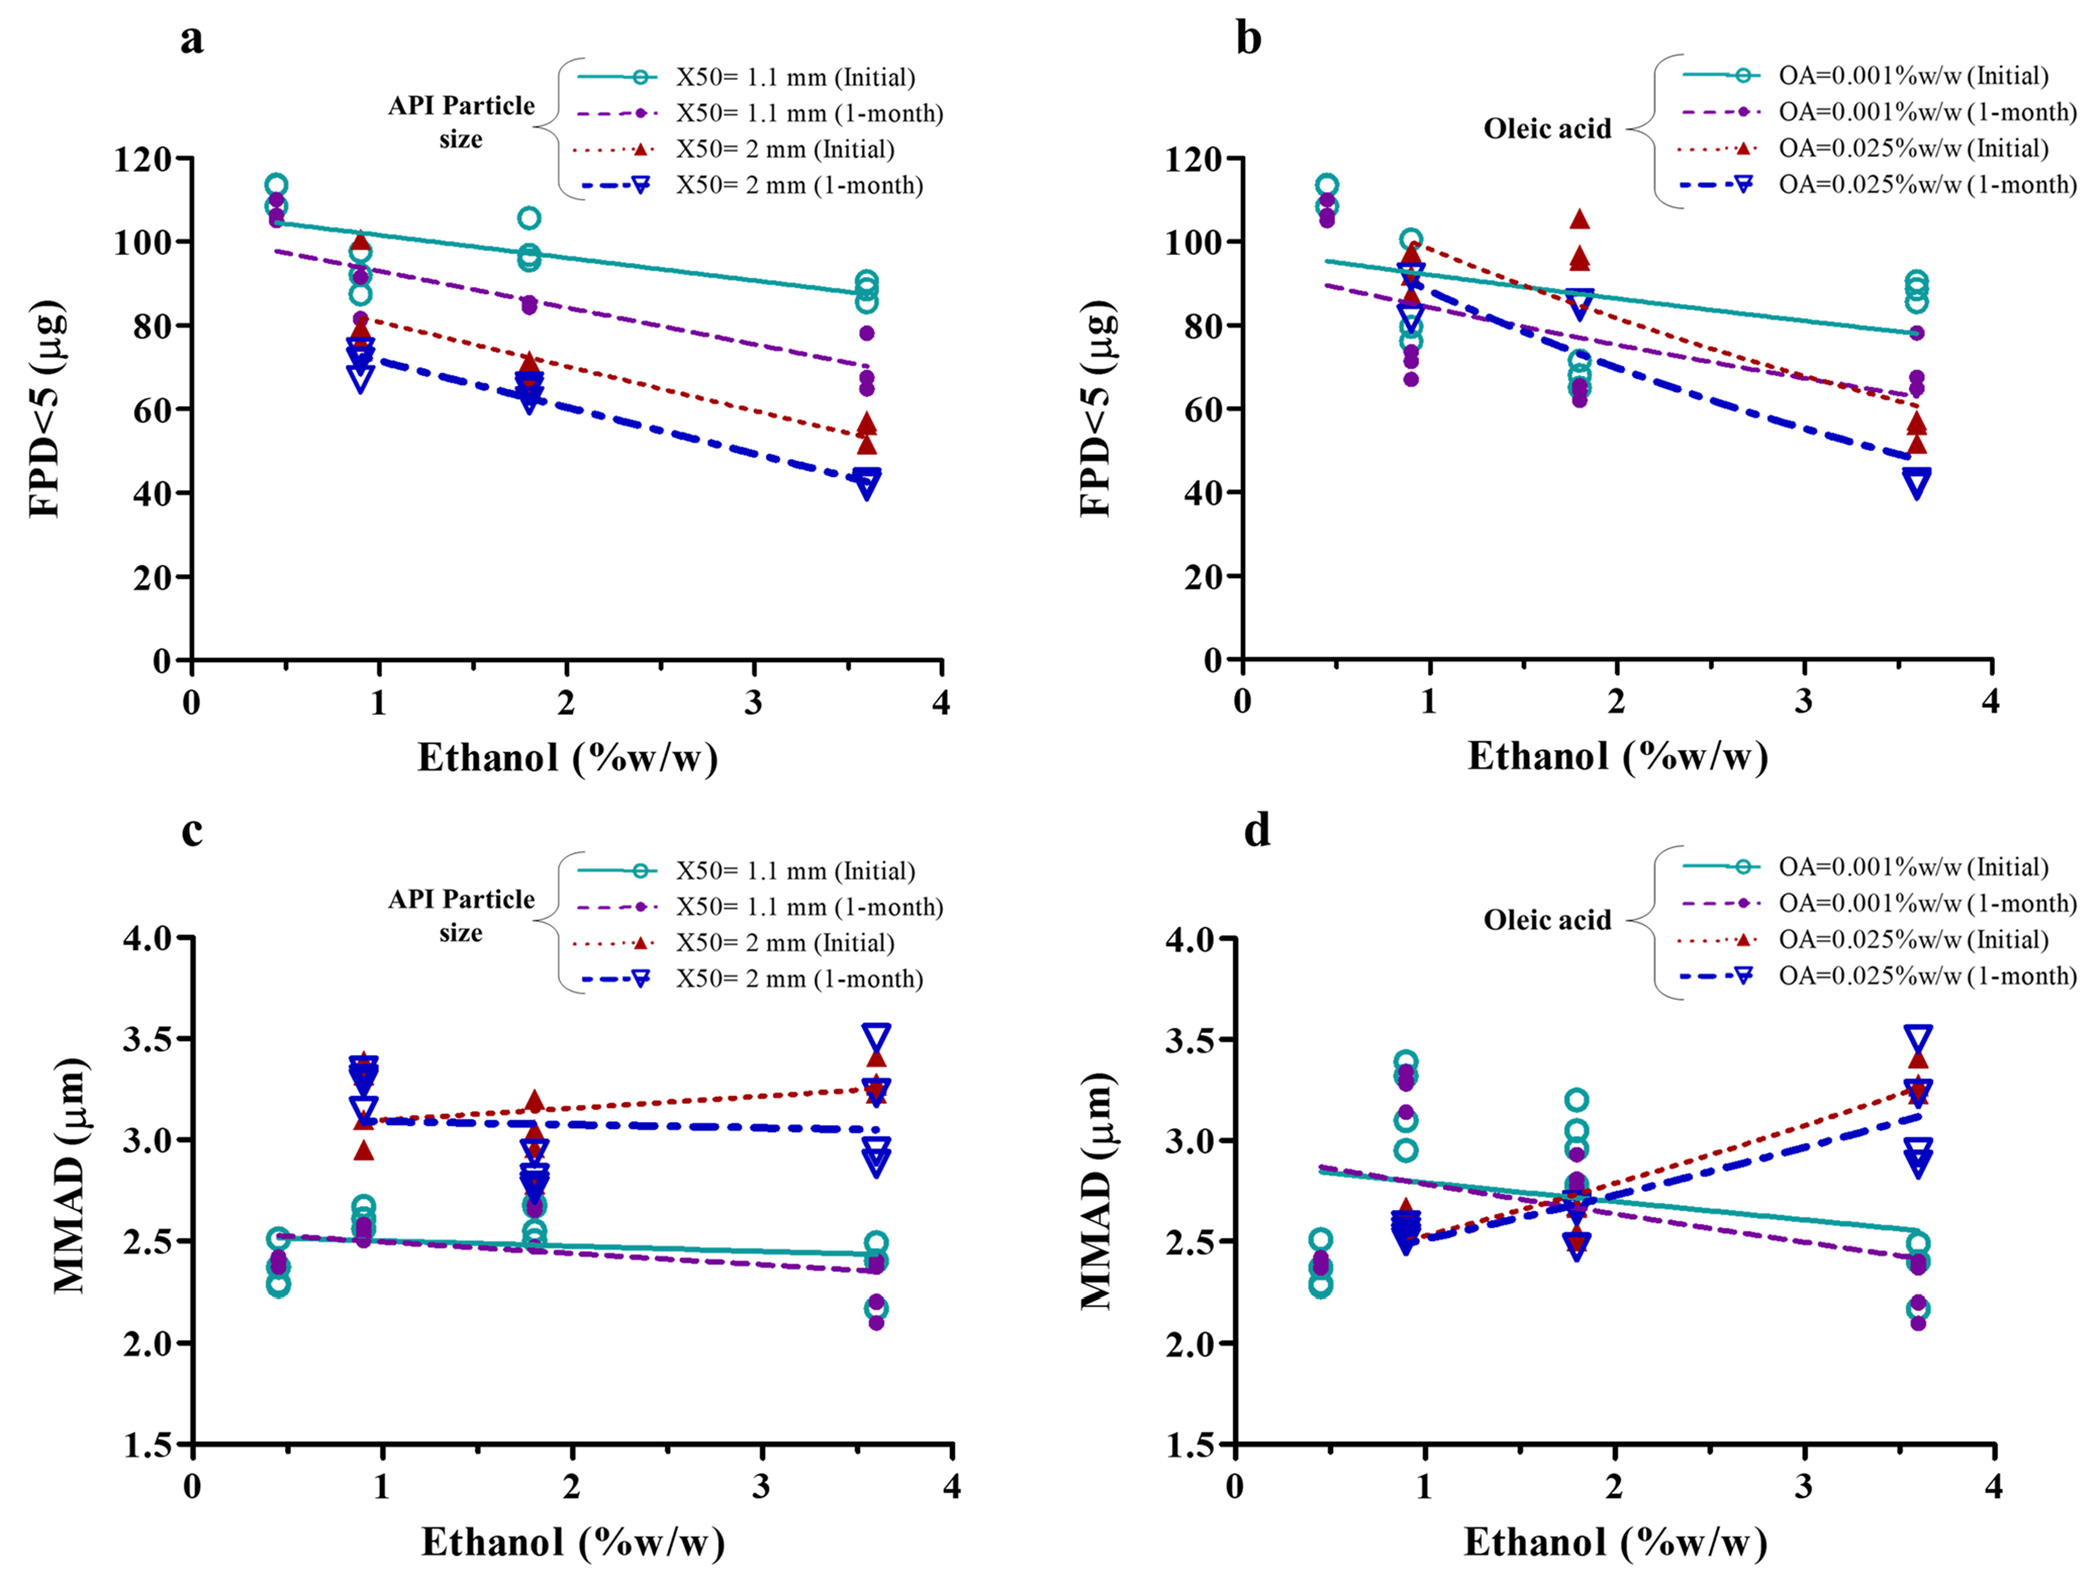
Effect of formulation variables on fine particle dose lesser than 5 μm (FPD < 5) (a and b) and on mass median aerodynamic diameter (MMAD) (c and d). Symbols indicate mean values (n = 4) of each MF-MDI batch and lines represent the linear regression
All three models (linear, logarithmic, and exponential) predicting FPD < 5 based on X50, ethanol, and oleic acid concentrations and storage condition described the data well and explained > 94% of variation (Table IV). The residuals from the model fitting to the observed FPD < 5 data also revealed good fit with all models (Fig. 6b). A slightly better fit was obtained with the simplest linear model (FPD < 5 = 145.0 – 28.2883·(X50) – 7.7373·(ethanol) – 376.5·(oleic acid) – 10.4214·(1-month)) explaining 95.45% of the variation in FPD < 5 (Table IV).
MMAD increased with larger X50 (Fig. 3c). The effect of ethanol on MMAD depends on the oleic acid concentrations (Fig. 3d). No change in MMAD following 1-month storage at 40 °C/75%RH was evident (Fig. 3c and d). A change in FPD < 5 (and MMAD) has been reported also by others with increase in the drug X50 displaying X50 as a critical formulation variable for suspension-based MDIs (2, 26, 27). The suspended drug particle size contained within the emitted aerosol droplets has also been reported by others to modulate the overall aerodynamic particle (droplet) size of a suspension-based MDI. This makes sense as MMAD cannot be smaller than those of the API particles themselves (2, 26, 27) with the APSD being shifted to the right for MDIs containing larger suspended particles. Indeed, similar to reports in the literature (5), we found an increase in MMAD with an increase in suspended drug particle size (X50) (Fig. 3c). Therefore, in the present study, the decrease in FPD < 5 with the larger X50 (Fig. 3, Table II) may be due to an overall shift of the distribution to larger values, resulting subsequently in more particles being outside of the FPD < 5 range.
We also found a decrease in FPD < 5 with increasing ethanol concentrations (0.45, 0.9, 1.8, and 3.6%w/w) (Fig. 3a and b). A 31% decrease in FPD < 5 was observed following a twofold increase (from 0.45 to 0.9%w/w) in ethanol concentration. Effects of ethanol concentration on the FPD < 5 have been suggested to be associated with its effect on droplet size (8), and evaporation rate (28). In agreement with our finding and potentially linked to its semi-volatile properties, an increase in ethanol concentration has been reported to decrease FPF and FPD of other MDI systems (2, 8, 10, 29, 30).
An increase in oleic acid concentration was associated with a lower FPD < 5 (Table II). Surfactants have been reported to increase deposition in the mouth-throat and upper airway regions, consequently reducing FPF (10, 31). In the previous study, no significant effect of oleic acid concentration on FPD < 5 was observed for suspension-based albuterol sulfate MDIs and it was hypothesized that this was related to the low concentrations of oleic acid studied (0.005–0.25%w/w) (2). The significant effect of oleic acid concentration on FPD < 5 seen in this study may be due to lower concentrations of ethanol (0.45–3.6%w/w) allowing to see the effects of oleic acid, which may have been masked in the previous studies due to much higher ethanol (7–20%w/w) concentrations used (2).
Overall, to develop an empirical correlation for predicting FPD < 5 of MF-MDI, all the three formulation variables and 1-month storage at accelerated condition (total four factors) were considered (Table IV). All three models (linear, logarithmic, and exponential) predicting FPD < 5 based on X50, ethanol, and oleic acid concentrations and storage condition described the data well and explained > 94% of variation (Table IV). The residuals from the model fitting to the observed FPD < 5 data also revealed good fit with all models (Fig. 6b). A slightly better fit was obtained with the simplest linear model (FPD < 5 = 145.0 – 28.2883·(X50) – 7.7373·(ethanol) – 376.5·(oleic acid) – 10.4214·(1-month)) explaining 95.45% of the variation in FPD < 5 (Table IV), which indicates that FPD < 5 is inversely correlated to all four formulation variables. Among all variables, ethanol concentration and X50 were found to have the strongest effect on FPD < 5 (Table IV). An empirical relationship, such as the one above linking formulation variables to FPD < 5, may be useful in facilitating formulation and product development.
Ex-Throat Dose
For more realistic in vitro measures and hence improved in vivo predictions of mouth-throat and lung deposition, anatomically relevant MT models (Alberta Idealized Throat (AIT), Virginia Commonwealth University (VCU) and Oropharyngeal Consortium (OPC)) have been widely studied in place of the conventional USP induction port (32). The OPC MT models were selected for the study as anatomically relevant MT models that may improve in vitro in vivo correlation (IVIVC) as compared to the USP induction port (32, 33). In this work, the in vitro parameters ex-throat dose was also assessed at 4 different flow rates. Apart from formulation variables, the ex-throat dose relies on both MT geometry and flow conditions (34). To assess the effects of flow conditions, the OPC MT models (small, medium, and large) were used at four constant flow rates (15, 30, 60, and 90 L/min). The flow rate of 15 L/min was included to maximize the possibility of discriminating between MF-MDI formulations and to determine the ex-throat dose at a suboptimal inhalation flow, while flow rates of 30, 60, and 90 L/min were selected to represent lower, median, and upper clinically relevant peak respiratory flow rate for asthma and COPD patients, respectively. All studies were performed at constant flow rates; as for MDIs, the use of actual inhalation profiles might not be as relevant as for DPIs, for which deagglomeration of particles has to occur during the inhalation process (35).
Ex-throat doses determined with the small, medium, and large OPC MT models varied significantly, increasing from small, medium, to large (Fig. 4a), on a qualitative level, mirroring estimates for FPD < 5. Ex-throat doses increasing in the order of small < medium < large OPC MT model indicated that the three dimensional (3-D) geometries of the smaller OPC MT model represent a larger barrier to the aerosolized particles (36).
Fig. 4.

(a) Ex-throat dose (n = 2) for MF-MDI batches using (1) small, (2) medium, and (3) large Oropharyngeal Consortium (OPC) mouth-throats (MT) models at different flow rates (L/min). (b–d) Effect of formulation variables (MF particle size X50, ethanol, and oleic acid concentrations) on ex-throat dose for (b) small, (c) medium, and (d) large OPC MT models at different flow rates (L/min); Symbols indicate mean values (n = 2) of each batch and lines represent the linear regression
Although the flow rate showed a significant effect on ex-throat doses using small (p < 0.05) and large (p < 0.001) OPC MT models (Table III), the effect was inconsistent (Fig. 4a). Except for MF-MDI batch #3 (for small OPC MT model) and batch #1 (for large OPC MT model), the change in flow rate from 60 to 90 L/min showed a decrease in respective small/large OPC MT model derived ex-throat doses (Fig. 4a). On the other hand, the ex-throat dose determined with the medium OPC MT model increased significantly (p < 0.0001) in a linear fashion (R2 = 0.9904) with flow rate (Fig. 4a and Table III). Almost twofold increase in ex-throat dose with medium OPC MT model was observed with a change in flow rate from 15 to 90 L/min, while this relationship was much less pronounced for small and large OPC MT models.
Overall, flow rate-related observations can be summarized as follows: For a given OPC MT model, ex-throat doses increased monotonically with increasing flow rate from 15 to 60 L/min (Fig. 4). Wei et al. (2018) reported a decrease in MT deposition and higher lung dose (ex-throat dose) of albuterol suspension-based MDIs with increase in flow rate from 15 to 45 L/min (34). The results obtained in this study suggest that independent of the size of the OPC MT model used, a flow rate of 60 L/min may provide efficient delivery to the lung which supports the recommendations published by others (37–39). Nonetheless, at higher flow rate (90 L/min), depending on the size of the OPC MT model used, an increase or decrease in ex-throat dose was observed (Fig. 4a, Table III). A decrease in ex-throat dose with an increase in flow rate above 90 L/min has been reported (40). The existence of such high “peak” flow rates might contribute to the observed lower ex-throat doses due to increased inertial impaction (37). The overall ex-throat deposition (μg) in the small OPC MT model was rather modest and very similar for all investigated MF-MDI formulations and flow rates, not allowing a statistical differentiation between MF-MDI formulations. Ex-throat deposition increased in medium and large OPC MT models (Fig. 4a) for all MF-MDI formulations. However, the large OPC MT model also showed very similar estimates for all MF-MDI formulations. Thus, the medium OPC MT model allowed the best differentiation across the MF-MDI formulations and flow rates.
The ex-throat dose decreased with increase in X50, ethanol, and oleic acid concentrations (Fig. 4b–d). For all OPC MT models, the smallest ex-throat dose was obtained for MF-MDI batch #8, which has the highest X50 and ethanol and oleic acid concentrations (Fig. 4a), while batch #1 (with the lowest levels of these formulation variables) showed the highest ex-throat dose (Table II). For all three OPC MT models, X50 (p < 0.001) and ethanol concentration (p < 0.001) showed a significant effect on ex-throat dose (Table III and Fig. 4b–d), while the effect of oleic acid was statistically significant only for the large OPC MT models. The least square mean estimates showed decrease in ex-throat doses with an increase in X50 or ethanol levels (Supplementary information. Table S2).
While the discriminatory power differed across the size of the OPC MT models, the general effects of the MF-MDI formulation variables on the ex-throat dose were consistent and independent of the OPC MT models studied, with an increase in MF particle size X50, oleic, acid and ethanol concentrations resulting in a decrease in ex-throat dose (Fig. 4b–d and Table II). The decrease in ex-throat dose for larger particles can be related to more pronounced inertial impaction and sedimentation of larger particles. The trend in decreased ex-throat dose with increase in surfactant concentrations was supported by an increase in the USP induction port deposition (indicator of mouth-throat deposition) (31), although the exact mechanism is still under discussion. In this study, the effect of oleic acid on ex-throat dose was statistically significant only for large OPC MT model. However, to ensure consistency, oleic acid was included in the model for all three OPC MT models (small, medium, and large) (Table IV). Furthermore, inclusion of oleic acid concentration in the correlation had no negative effect on the precision of the resulting models.
For the ex-throat dose collected with different OPC MT anatomical models (small, medium, or large), flow rate was included as the fourth factor, in addition to X50, ethanol, and oleic acid concentrations (while 1-month storage at accelerated condition was excluded). Although all the models resulted in good fits, their explanatory power varied with the type of OPC MT used. The residuals (the difference between actual and predicted ex-throat dose) derived for the small, medium, and large OPC MT models are shown in Fig. 6c–e. All models explained > 90% variation in ex-throat dose for the medium and large OPC MT models. Overall, the logarithmic model (ex-throat dose = a + b·ln(X50) + c·ln(ethanol) + d·ln(oleic acid) + f·ln(flow rate)) was considered best to link ex-throat dose to formulation variables and experimental condition.
We have recently reported differences in the ex-throat dose when throats were coated with either Brij or silicone based coating solutions (41). However, the ex-throat dose experiments with Brij solution in the present study were conducted earlier to these reported studies (41) and thus did not consider these potential coating material differences in the experimental design. Therefore, the reported quantitative relationship between ex-throat dose and formulation factors reported in present study could only be applicable for these specific experimental conditions, as they are likely to be affected by the coating solution.
Dissolution Rate
The fate of deposited drug in the pulmonary region is related to its dissolution as the rate of dissolution is known to affect pulmonary targeting (3, 42). We employed a fluid limited Transwell® system, which has previously been used to generate dissolution profiles for a range of corticosteroids which were found to be in good agreement with their in vivo absorption profiles (20). Average dissolution profiles and MDT of the seven investigated MF-MDI formulations (batch #2 was not assessed) are shown in Fig. 5 and Table II, respectively. Estimates for the MDT ranged from 2.6 to 6.2 h. The least square mean estimates of MDT (Supplementary information. Table S2) suggested a potential role of ethanol and oleic acid in modulating MDT. However, because of the variability in the data, statistical analysis was unable to confirm this observation with p values ranging from 0.3 to 0.8 (Table III).
Fig. 5.

In vitro dissolution of MF-MDI formulations. (a) Cumulative in vitro dissolution profiles. (b) Monomolecular growth model: predicted vs. observed dissolution profiles. (c) and (d) Effect of formulation variables on median dissolution time (MDT); symbols indicate mean values (n = 6) of each MF-MDI batch
In this work, different dissolution profiles were observed for all seven MF-MDI batches (Fig. 5a and b). While trends were observed, the variability in MDT (up to 30% SD for MDT of a given batch, data not shown) resulted in p values larger than 0.05. Although particle size of the drug is expected to affect dissolution profiles (43), we did not find any detectable effect of X50 on MDT. This finding may be due to the smaller MF particle size range studied (1.1 vs. 2.0 μm), and variability in measured data. The non-significant effect of other formulation variables on MDT could also be due to the higher variability observed in these experiments. The higher variability may be related in part to the use of a small portion of the filter for dissolution experiments, which was necessary to reduce the amount of drug loaded to insure sink conditions during the experiments. Assay of all sections of the filter paper (n = 5 per independent experiment) might have reduced the overall variability. However, this was not possible because of the time intensity of the experiments (210 independent dissolution profiles, maximum of 6 dissolution profiles per 24 h). Observed mean MDT estimates suggested some effects of ethanol and oleic acid concentrations, but neither factor was statistically significant. Decrease in MDT with higher ethanol concentration may be due to increased solubility of MF in ethanol and the generation of faster dissolving MF particles during evaporation. Although surfactants have been reported to influence dissolution rate (5), at the rather low concentrations employed in this study, no statistically significant effect of oleic acid on MDT could be detected.
Despite the lack of statistical significance, we decided to incorporate all formulation variables into the model, as lack of statistical significance may be associated with a larger variability in the data. The logarithmic model (MDT = 9.5463 + 0.7428·ln(X50) – 1.4125·ln(ethanol) + 0.9011·ln(oleic acid)) was found to describe the data well (Fig. 6f), explaining more than 84% of the total variation (Table IV). Overall, the results suggested that dissolution of the drug following deposition in the sites of action in the lung could be influenced by formulation variables and thus may impact the performance of MDI products. However, we note that dissolution data with less variability should be used for further improving the link between MDT and formulation factors to increase its utility during MF-MDI product evaluations.
CONCLUSION
The study illustrates the importance of API particle size (X50) and canister concentrations of oleic acid (surfactant) and, more importantly, ethanol (cosolvent) as critical formulation variables governing performance of MF suspension-based MDIs. The study demonstrated profound effects of formulation variables and other experimental conditions (storage time at the accelerated conditions and flow rate when evaluating APSD using anatomical MT models) on aerosol performance of MF-MDI products. The impact of these formulation variables on CQAs such as DD, FPD < 5, ex-throat dose, and MDT was subsequently utilized to develop relationship models, which may be useful for predicting aerosol performance of similar MF-MDI formulations. The DOE-based analysis has the potential to provide insights into the understanding of formulation variables governing the MF-MDI product performance. However, despite relatively large changes in the levels of formulation variables within the studied MF-MDI manufactured batches using a DOE approach, cases without significant effect of excipients on CQAs were also found which may be due to the limitations of the study design utilized. Further research in this field may be warranted to better understand the impact of MDI formulation variables in vivo.
Supplementary Material
Acknowledgements
We dedicate this work to our dear friend and colleague Dennis Sandell, a major player in the performance assessment of inhalation drugs, who passed away much too early.
Funding
Funding for this work was made possible, in part, by the US Food and Drug Administration through grant U01FD004943.
Abbreviations
- AIT
Alberta Idealized Throat
- ANOVA
Analysis of variance
- API
Active pharmaceutical ingredient
- APSD
Aerodynamic particle size distribution
- BDP
Beclomethasone dipropionate
- CMA
Critical material attribute
- COPD
Chronic obstructive pulmonary disease
- CPPs
Critical process parameters
- CQAs
Critical quality attributes
- DOE
Design of experiment
- FPD < 5
Fine particle dose lesser than 5 μm
- FPF < 5
Fine particle fraction lesser than 5 μm
- GSD
Geometric standard deviation
- HFA
Hydrofluoroalkane
- IP
Induction port
- MDI
Metered dose inhaler
- MDT
Median dissolution time
- MF
Mometasone furoate
- MMAD
Mass median aerodynamic diameter
- MOC
Micro-orifice collector
- NGI
Next generation impactor
- OPC
Oropharyngeal consortium
- X50
Drug volumetric median diameter
- RSD
Relative standard deviation
- SD
Standard deviation
- USP
United States Pharmacopoeia
- NGI-DD
Next generation impactor-total delivered dose
Footnotes
Supplementary Information The online version contains supplementary material available at https://doi.org/10.1208/s12248-021-00638-1.
Disclaimer The opinions expressed in this article are those of the authors only and do not necessarily reflect the official policies of the Department of Health and Human Services, nor does any mention of trade names, commercial practices, or organization imply endorsement by the United States Government.
References
- 1.Leach CL, Davidson PJ, Hasselquist BE, Boudreau RJ. Lung deposition of hydrofluoroalkane-134a beclomethasone is greater than that of chlorofluorocarbon fluticasone and chlorofluorocarbon beclomethasone: a cross-over study in healthy volunteers. Chest. 2002;122(2):510–6. [DOI] [PubMed] [Google Scholar]
- 2.Sheth P, Sandell D, Conti DS, Holt JT, Hickey AJ, Saluja B. Influence of formulation factors on the aerosol performance of suspension and solution metered dose inhalers: a systematic approach. AAPS J. 2017;19(5):1396–410. [DOI] [PubMed] [Google Scholar]
- 3.Hochhaus G, Möllmann H, Derendorf H, Gonzalez-Rothi RJ. Pharmacokinetic/pharmacodynamic aspects of aerosol therapy using glucocorticoids as a model. J Clin Pharmacol. 1997;37(10):881–92. [DOI] [PubMed] [Google Scholar]
- 4.Sheth P, Grimes MR, Stein SW, Myrdal PB. Impact of droplet evaporation rate on resulting in vitro performance parameters of pressurized metered dose inhalers. Int J Pharm. 2017;528(1):360–71. [DOI] [PubMed] [Google Scholar]
- 5.Myrdal PB, Sheth P. Stein SW. Advances in metered dose inhaler technology: formulation development. AAPS PharmSciTech. 2014;15(2):434–55. [DOI] [PMC free article] [PubMed] [Google Scholar]
- 6.Sheth P, Stein SW, Myrdal PB. Factors influencing aerodynamic particle size distribution of suspension pressurized metered dose inhalers. AAPS PharmSciTech. 2015;16(1):192–201. [DOI] [PMC free article] [PubMed] [Google Scholar]
- 7.van Beerendonk I, Mesters I, Mudde AN, Tan T. Assessment of the inhalation technique in outpatients with asthma or chronic obstructive pulmonary disease using a metered-dose inhaler or dry powder device. J Asthma. 1998;35(3):273–9. [DOI] [PubMed] [Google Scholar]
- 8.Sheth P, Stein SW, Myrdal PB. The influence of initial atomized droplet size on residual particle size from pressurized metered dose inhalers. Int J Pharm. 2013:455(1):57–65. [DOI] [PubMed] [Google Scholar]
- 9.Smyth HDC. The influence of formulation variables on the performance of alternative propellant-driven metered dose inhalers. Adv Drug Deliv Rev. 2003;55(7):807–28. [DOI] [PubMed] [Google Scholar]
- 10.Williams Iii R, Liu J. Formulation of a protein with propellant HFA 134a for aerosol delivery. Eur J Pharm Sci. 1999:7(2):137–44. [DOI] [PubMed] [Google Scholar]
- 11.Leach CL, Davidson PJ, Hasselquist BE, Boudreau RJ. Influence of particle size and patient dosing technique on lung deposition of HFA-beclomethasone from a metered dose inhaler. J Aerosol Med. 2005;18(4):379–85. [DOI] [PubMed] [Google Scholar]
- 12.Zhang L, Mao S. Applications of quality by design (QbD) and its tools in drug delivery. Asian J Pharm Sci. 2016;11:144–5. [Google Scholar]
- 13.Djuris J, Djuric Z. Modeling in the quality by design environment: regulatory requirements and recommendations for design space and control strategy appointment. Int J Pharm. 2017;533(2):346–56. [DOI] [PubMed] [Google Scholar]
- 14.Gernaey KV, Gani R. A model-based systems approach to pharmaceutical product-process design and analysis. Chem Eng Sci. 2010;65(21):5757–69. [Google Scholar]
- 15.Schroeter JD, Sheth P, Hickey AJ, Asgharian B, Price OT, Holt JT, Conti DS, Saluja B. Effects of Formulation Variables on Lung Dosimetry of Albuterol Sulfate Suspension and Beclomethasone Dipropionate Solution Metered Dose Inhalers. AAPS PharmSciTech. 2018; 19(5): 2335–45. [DOI] [PubMed] [Google Scholar]
- 16.Sheth P VIE, Susick R, Menzeleev R. A Dual-internal standard LC-UV-MSD method to improve accuracy and efficiency of characterizing mometasone furoate MDIs. The American Association of Pharmaceutical Scientists (AAPS) Annual Meeting; October 25–29. 2015; Orlando, FL, USA: AAPS; 2015. [Google Scholar]
- 17.<921> C. Physical tests and determination, water determination. Rockville, MD, USA: The United States Pharmacopeial Convention; 1995. p. 1840–1. [Google Scholar]
- 18.Chapter G, editor 601> Aerosols, nasal sprays, metered dose inhalers, and dry powder inhalers. United States Pharmacopeia—National Formulary United States Convention, Washington, DC; 2009. [Google Scholar]
- 19.Byron PR, Wei X, Delvadia RR, Longest PW. Standardizing in vitro test methods to support aerosol drug evaluation in the clinic. RDD Europe. 2013;1:85–92. [Google Scholar]
- 20.Rohrschneider M, Bhagwat S, Krampe R, Michler V, Breitkreutz J, Hochhaus G. Evaluation of the transwell system for characterization of dissolution behavior of inhalation drugs: effects of membrane and surfactant. Mol Pharm. 2015;12(8):2618–24. [DOI] [PubMed] [Google Scholar]
- 21.Draper N, Smith HJNY, NY. Applied Regression Analysis, 2nd edn. Wiley; 1981. [Google Scholar]
- 22.Draft Guidance on Formoterol fumarate; Mometasone furoate. United States Food Drug Administration; 2016. [Google Scholar]
- 23.Vervaet C, Byron PR. Drug–surfactant–propellant interactions in HFA-formulations. Int J Pharm. 1999;186(1):13–30. [DOI] [PubMed] [Google Scholar]
- 24.Everard ML, Devadason SG, Summers QA, Le Souëf PN. Factors affecting total and “respirable” dose delivered by a salbutamol metered dose inhaler. Thorax. 1995;50(7):746–9. [DOI] [PMC free article] [PubMed] [Google Scholar]
- 25.Newman SP. Principles of metered-dose inhaler design. Respir Care. 2005;50(9):1177–90. [PubMed] [Google Scholar]
- 26.Pu Y, Kline LC, Khawaja N, Van Liew M, Berry J. Comparison of optical particle sizing and cascade impaction for measuring the particle size of a suspension metered dose inhaler. Drug Dev Ind Pharm. 2015;41(5):737–43. [DOI] [PubMed] [Google Scholar]
- 27.Berry J, Kline LC, Sherwood JK, Chaudhry S, Obenauer-Kutner L, Hart JL, et al. Influence of the size of micronized active pharmaceutical ingredient on the aerodynamic particle size and stability of a metered dose inhaler. Drug Dev Ind Pharm. 2004;30(7):705–14. [DOI] [PubMed] [Google Scholar]
- 28.Stein SW, Myrdal PB. The relative influence of atomization and evaporation on metered dose inhaler drug delivery efficiency. Aerosol Sci Technol. 2006;40(5):335–47. [Google Scholar]
- 29.Zhu B, Traini D, Lewis DA, Young P. The solid-state and morphological characteristics of particles generated from solution-based metered dose inhalers: influence of ethanol concentration and intrinsic drug properties. Colloids Surf, A. 2014;443:345–55. [Google Scholar]
- 30.Zhu B, Traini D, Chan H-K, Young PM. The effect of ethanol on the formation and physico-chemical properties of particles generated from budesonide solution-based pressurized metered-dose inhalers. Drug Dev Ind Pharm. 2013;39(11):1625–37. [DOI] [PubMed] [Google Scholar]
- 31.Saleem IY, Smyth HD. Tuning aerosol particle size distribution of metered dose inhalers using cosolvents and surfactants. BioMed Res Int. 2013;2013:1–7. [DOI] [PMC free article] [PubMed] [Google Scholar]
- 32.Olsson B, Berg E, Svensson M, editors. Comparing aerosol size distributions that penetrate mouth-throat models under realistic inhalation conditions. Respiratory drug delivery; 2010: David Healthcare International Publishing Orlando Florida, River Grove IL. [Google Scholar]
- 33.Olsson B, Borgström L, Lundbäck H, Svensson M. Validation of a general in vitro approach for prediction of total lung deposition in healthy adults for pharmaceutical inhalation products. J Aerosol Med Pulm Drug Deliv. 2013;26(6):355–69. [DOI] [PubMed] [Google Scholar]
- 34.Wei X, Hindle M, Kaviratna A, Huynh BK, Delvadia RR, Sandell D, et al. In vitro tests for aerosol deposition. VI: realistic testing with different mouth-throat models and in vitro—in vivo correlations for a dry powder inhaler, metered dose inhaler, and soft mist inhaler. J Aerosol Med Pulm Drug Deliv. 2018;31(6):358–71. [DOI] [PubMed] [Google Scholar]
- 35.Haughney J, Price D, Barnes NC, Virchow JC, Roche N, Chrystyn H. Choosing inhaler devices for people with asthma: current knowledge and outstanding research needs. Respir Med CME. 2010;3(3):125–31. [DOI] [PubMed] [Google Scholar]
- 36.Kaviratna A, Tian G, Liu X, Delvadia R, Lee S, Guo C. Evaluation of bio-relevant mouth-throat models for characterization of metered dose inhalers. AAPS PharmSciTech. 2019;20(3):130. [DOI] [PubMed] [Google Scholar]
- 37.Newman S, Steed K, Hooper G, Källén A, Borgström L. Comparison of gamma scintigraphy and a pharmacokinetic technique for assessing pulmonary deposition of terbutaline sulphate delivered by pressurized metered dose inhaler. Pharm Res. 1995;12(2):231–6. [DOI] [PubMed] [Google Scholar]
- 38.Tomlinson HS, Corlett SA, Allen MB, Chrystyn H. Assessment of different methods of inhalation from salbutamol metered dose inhalers by urinary drug excretion and methacholine challenge. Br J Clin Pharmacol. 2005;60(6):605–10. [DOI] [PMC free article] [PubMed] [Google Scholar]
- 39.Azouz W, Campbell J, Stephenson J, Saralaya D, Chrystyn H. Improved metered dose inhaler technique when a coordination cap is used. J Aerosol Med Pulm Drug Deliv. 2014;27(3):193–9. [DOI] [PubMed] [Google Scholar]
- 40.Asking LOB, Berg E, Svensson M. Pressurized metered dose inhalers and the slow inhalation recommendation. Respir Drug Deliv. 2018;2:463–6. [Google Scholar]
- 41.Dhapare SNB, Svensson M, Elfman P, Sandell D, Winner L, Bulitta JB, Hochhaus G. Factors influencing plume characteristics of metered dose inhalers (MDIs) following passage through bio-relevant mouth-throat models. Respir Drug Deliv. 2021;2021:301–6. [Google Scholar]
- 42.Arya V, Coowanitwong I, Brugos B, Kim W-S, Singh R, Hochhaus G. Pulmonary targeting of sustained release formulation of budesonide in neonatal rats. J Drug Target. 2006;14(10):680–6. [DOI] [PubMed] [Google Scholar]
- 43.Arora D, Shah KA, Halquist MS, Sakagami M. In vitro aqueous fluid-capacity-limited dissolution testing of respirable aerosol drug particles generated from inhaler products. Pharm Res. 2010;27(5):786–95. [DOI] [PubMed] [Google Scholar]
Associated Data
This section collects any data citations, data availability statements, or supplementary materials included in this article.