

Social connections with countries affected by COVID-19 before the United States increase compliance with mobility restrictions.
Abstract
We study the role of social connections in compliance of U.S. households with mobility restrictions imposed in response to the coronavirus disease 2019 (COVID-19) pandemic, using aggregated and anonymized Facebook data on social connections and mobile phone data for measuring social distancing at the county level. Relative to the average restriction efficacy, a county with one-SD more social connections with China and Italy—the first countries with major COVID-19 outbreaks—has a nearly 50% higher compliance with mobility restrictions. By contrast, social connections of counties with less-educated populations, a higher Trump vote share, and a higher fraction of climate change deniers show decreased compliance with mobility restrictions. Our analysis suggests that social connections are conduits of information about the pandemic and an economically important factor affecting compliance with, and impact of, mobility restrictions.
INTRODUCTION
The coronavirus disease 2019 (COVID-19) pandemic has taken hundreds of thousands of lives, strained health care systems, and forced shutdowns of large parts of the global economy. The first outbreak in Wuhan, China, officially claimed the first life on 11 January 2020 and led to a lockdown of the entire Hubei province, affecting ca. 56 million people. The second major outbreak of the virus was in Lombardy, Italy, which led to a nationwide lockdown on March 9 and to Italy having the highest estimated case fatality rate in the world by mid-March. In the United States, travel from China was restricted on January 30, and the rapid increase in local COVID-19 cases in early March sparked large-scale mobility restrictions across many states, including further travel restrictions (including Italy), school closures, social distancing orders, and shelter-in-place orders (1). These interventions are broadly similar to the measures implemented around the world during the Ebola and H1N1 pandemics (2–9).
Interventions related to social distancing face inherent limitations that hamper their effectiveness. Countries, as well as local governments within countries, may vary in their capacity to surveil and enforce laws and regulations (10). Local interventions appeared effective in stemming the outbreak in Hubei, entailing rigorous implementation of mobility restrictions throughout China (11, 12). In the United States and other places where a similar level of enforcement may not be feasible, people must voluntarily comply with mobility restrictions for them to be effective (13, 14). People may choose not to comply because they perceive the risk of the pandemic or the benefits of mobility restrictions to be low. Such perceptions depend on the amount, quality, and interpretation of information available for several reasons: Information acquisition is costly (15), people might lack information due to processing constraints and limited attention (16), and motivated reasoning may lead them to interpret the information they receive in ways that fit their existing biases (17).
We study how social interactions facilitated through mobile communications affect household behavior by acting as a conduit of relevant COVID-19 information during the period from 1 February 2020 to 30 March 2020, in the early stages of the pandemic. We use information in a broad sense, encompassing any information about the dangers of COVID-19 and trying personal anecdotes or social norms about the importance of complying with mobility restrictions. Social connections can be an important means by which people receive such information, reducing the cost of information acquisition as they disseminate information without specific effort required (18). Moreover, socially connected persons are typically considered trustworthy, possibly increasing the impact of the information coming from them (19). Existing research studies provide evidence of the influence of social connections on household decision-making. For example, news about natural disasters flows through online social connections, acting as a warning system during a natural disaster (20). There is also an important literature exploring the role of online social networks in personal health decisions, emphasizing the capacity of online social networks—and mobile communications more broadly—to disseminate both information and misinformation (21, 22). We extend this literature to the context of social distancing and nonpharmaceutical interventions.
We hypothesize that people receiving information about COVID-19 through social connections with China and Italy are more likely to comply with mobility restrictions. The reason we focus on China and Italy is that they were the first two countries to report major outbreaks of COVID-19, earlier than the United States. Hence, they are the most obvious sources of useful information about the severity of the pandemic. To test this hypothesis empirically, we use observational data from Facebook’s county-level Social Connectedness Index (SCI) (23) to measure social connectedness between U.S. counties and different foreign countries. Facebook is the largest online social network in the world, and online connections have been shown to meaningfully reflect direct social ties, suggesting that the SCI is likely to be a good proxy for general social connectedness (24, 25). We combine the index data with county-level mobility data from SafeGraph, a company producing anonymized mobile phone location statistics covering 10% of U.S. mobile devices. SafeGraph’s social distancing measures allow us to evaluate the empirical relationship between the extent of social connections with China and Italy and the effect of mobility restrictions on social distancing.
We find that the estimated effect of mobility restrictions on social distancing is significantly larger for counties with more social connections with China or Italy. We then examine two main alternative interpretations of our findings: that social connections proxy for risk exposures such as traveling or that social connections convey information. First, as social connections with China or Italy might be correlated with travel from affected areas, we ask whether households socially distance in response to heightened concerns about travelers from areas with a lot of reported cases. Our findings suggest that this is unlikely, as our results are weaker in areas with populations at higher risk from COVID-19, as measured by population density and rates of diabetes and obesity. Our results also remain unchanged when excluding counties with commercial airports and those adjacent to them. These findings suggest that the increase in the effect of mobility restrictions is primarily driven by differences in information, not in risk.
After showing evidence more consistent with social connections acting as a conduit of information than as a proxy for risk exposures, we further analyze the informational role of social connections by addressing three questions: (i) does the importance of social connections as a conduit of information depend on proxies of sophistication, (ii) do the estimated effects of social connections simply reflect motivated reasoning such as political preferences, and (iii) does similarity between socially connected populations modulate the effect of information through social connections? In analyses addressing each of these three questions, we find that (i) social connections have a larger estimated effect in counties with older populations and those with fewer people with at least a bachelor’s degree, (ii) partisan differences in social distancing behavior are more consistent with differences in information than with motivated reasoning, and (iii) social connections between counties with a higher fraction of Asians and Italy, as well as those with a higher fraction of whites and China, generate larger estimated effects of mobility restrictions on social distancing.
Last, we find evidence consistent with social connections disseminating both information and misinformation. When considering measures of social connections with areas within the United States that are likely to spread or believe in misinformation, we find the opposite results. More connections with counties with low education levels, counties with a higher share of voters who voted for Donald Trump in the 2016 presidential election, and counties with a higher fraction of people denying the existence of climate change are all associated with a decrease in the effect of mobility restrictions. These results suggest that the potential role of social connections in influencing pandemic-related household behavior may be large, but not unequivocally positive.
MATERIALS AND METHODS
Data and measurement
For our analysis, we assemble a county-by-day panel dataset comprising five main components: (i) daily county-level data of social distancing; (ii) social connectedness to COVID-19–affected areas at the county level; (iii) daily county-level data on mobility restrictions; (iv) daily county-level data on confirmed COVID-19 cases and deaths from the John Hopkins University, accessed through the New York Times; and (v) county-level characteristics data from the U.S. Census. We briefly discuss the main variables of interest below, and section S1 provides more details on other variable definitions and discusses data quality. Our sample period covers 1 February 2020 to 30 March 2020.
Social distancing
Our main outcome variable measuring social distancing comes from data provided by SafeGraph, a specialized location data company. SafeGraph obtains its data through users of mobile phone applications who opt in to provide their anonymized location data. For research related to COVID-19, SafeGraph has provided access to its location and point-of-interest data to researchers and government organizations. The data include aggregated mobility measures and the number of devices (smartphones) at the census block group level. To identify each person’s home, SafeGraph calculates a “common evening location,” a location where an individual typically resides during nighttime hours (6 p.m. to 7 a.m.) using data from January 2020. Phones spending 3 to 6 hours at a location other than their home between 8 a.m. and 6 p.m. are classified as part-time working, while those spending more than 6 hours from 8 a.m. to 6 p.m. are classified as engaging in full-time work behavior. This requires devices that are seen several times throughout the day. This includes 20.1 million devices per day over our sample period.
For our analysis, we aggregate the data to the county level and define social distancing as
| (1) |
where i indexes a county and t indexes a day. Completely Home and Working refer to the number of individuals who appear to stay completely home during the day and those working (either part time or full time), respectively. By subtracting out from the denominator those who go to work (presumably out of necessity), we take into consideration the fact that people may be constrained in their ability to choose to stay at home (26). Hence, we consider the ratio of those mobile devices, which remain completely at home relative to individuals with the choice to stay home. This ratio varies from 0 to 1, with 80% of the data in the range of 0.248 to 0.446 and an average of 0.337.
Social connectedness
To measure county-level social connections with different counties and countries, we use the SCI provided by Facebook (23, 27). Leveraging Facebook’s 2.5 billion active users globally and 190 million active users in the United States (as of 2019), the SCI calculates the relative frequency of Facebook friendship links between every county-pair in the United States, as well as every county in the United States to every country, defined for pairs of geographical regions i and j as
| (2) |
The index we use is based on active Facebook users as of April 2016 and can be interpreted as a measure of the relative probability of a Facebook friendship between a given Facebook user location i and j. For each country, the SCI for the county with largest number of friendship links is normalized to 1,000,000.
Mobility restrictions
We obtain data on restrictions imposed in different states from a crowd-sourced project, which we verify against news articles and other crowd-sourced lists. Different regions within the United States have implemented different restrictions, depending on their exposure to the pandemic, institutional capacity, and other local factors. The restrictions are classified into five types: school closures, closures of public places, restrictions of gatherings, shelter-in-place orders, and closures of all nonessential businesses. Restrictions are generally at the state level, but in some cases, there is also additional county-level variation in measures imposed above and beyond those imposed by the state.
Empirical design
Our main hypothesis is that social connections with China and Italy are associated with higher estimated effects of mobility restrictions on social distancing. We use a continuous treatment differences-in-differences regression specification to analyze the differences in response to mobility restrictions based on social connections with China or Italy. This approach falls under the category of “quasi-experimental methods” as there are treatment and control interpretations to our specification. The treatment group is counties with high social connections with China and Italy, and the control group is counties with lower social connections with China and Italy. The treatment is the introduction of mobility restrictions. This specification is not a controlled experiment because the group classifications are not randomly assigned and the treatment decisions come from policymakers. Statewide mobility restrictions might be partly related to county-level characteristics. Therefore, we model county-specific characteristics and the local COVID-19 situation, measured by the number of confirmed cases, in our regression analysis. We set up this analysis according to the equation
| (3) |
where i indexes a county, t indexes a day, s(i) indexes a state that a county i is in, and SCIi is the SCI with either China or Italy. The outcome variable is our measure of social distancing, and the variable of interest is Restrictionsi, t × ln (SCIi), which captures the incremental response to mobility restrictions related to social connections. Restrictionsi, t is a variable ranging from 0 to 5, counting the number of mobility restrictions in force in a county on a given day t. For example, for a state that implements two mobility restriction policies on the same day with no existing policies, Restrictionsi, t jumps from 0 to 2. This measure contains statistical variation along both the extensive margin, capturing counties implementing their first sets of mobility restrictions, as well as the intensive margin, capturing counties increasing the number of existing measures. This simple measure does not take a stance on exactly which type of mobility restriction is most effective, as the implementation of restrictions is typically clustered through time, as shown in Fig. 1. The coefficient of interest is β: the differential effect of one additional mobility restriction for counties with more social connections with Italy or China versus those with fewer social connections.
Fig. 1. Number of county-level restrictions, SCI China, and social distancing.
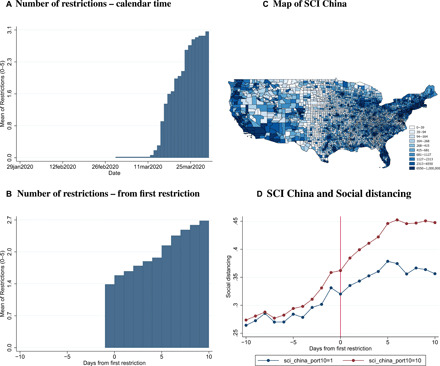
(A and B) County average number of types of restrictions implemented (0 to 5) in calendar time and relative to the first restriction in the county. As of 30 March 2020, the number of state-level school closing is 52, closures of public places is 43, stay-at-home orders is 36, no-gatherings is 20, and banning nonessential services is 11. (C) Map of the SCI with China. (D) Average Social distancing plotted conditional on the county’s social connectedness with China, the first country severely affected by COVID-19. Counties are sorted into 10 portfolios by state based on SCI China. Portfolio 10 represents the highest social connectedness to China, and 1 represents the lowest.
The remaining variables are high-dimensional fixed effects and controls included to account for confounding variables that might affect the outcome variable or the variables of interest. First, we include a control variable for the daily number of local COVID-19 cases, ln (Casesi,t), which represents the natural log of one plus the cumulative number of cases within a county, a measure of the severity of the local COVID-19 situation, which likely affects the perceived risk (28). Second, we include αs(i),t, a set of state-by-day fixed effects that control for any state- and nationwide policy, which may confound mobility restrictions and social distancing. This means that our analysis captures the variation of social distancing responses within states, not between them. For example, our empirical results are not influenced by state governors or federal-level changes in aid packages that affect each county within the state in a similar manner. Third, we include γi, a set of county fixed effects that control for any confounding average differences in county characteristics, such as personal wealth level, industry composition, age distribution, political leaning, and county-level fiscal conditions, which might affect both social connections and social distancing. Last, to address potential heteroscedasticity in our statistical inference, we use cluster-robust SEs along the county and day dimension, permitting time series correlation of social distancing and restrictions within a county, as well as contemporaneous correlations across states on the same day.
RESULTS
In this section, we first document our main results. In subsequent subsections, we conduct tests to help clarify alternative interpretations of our findings.
Social connections and mobility restrictions
We first document the relationship between social connections and estimated effects of mobility restrictions on social distancing. Over 20 states initiated their first mobility restriction on 16 March 2020. States often implement several restrictions simultaneously, but on average, states appear to first close schools and public places, then restrict gatherings, and finally implement shelter-in-place orders. The top five states have more than three mobility restrictions, and throughout our sample from 1 February to 30 March 2020, the average state has 0.629 restrictions. By the end of the sample period, the average number of mobility restrictions across states is 3.1.
There are large differences across counties and days in social distancing and social connections. For social distancing, counties in the lowest decile (those with the bottom 10% in social connections) spend up to 24.8% of flexible time at home, while counties in the top decile spend at least 44.6% of flexible time at home, with a mean of 33.7% and SD of 8.1%. For social connections, the SCI for each country is normalized to 1,000,000 for the county with the most social connections to it. To limit the impact of outliers, we winsorize the SCI indices at the 1% level, thus limiting the maximum values for China and Italy to 76,447 and 99,145, respectively. Counties in the lowest decile of social connections have SCI values of up to 48 and 64 for China and Italy, respectively, while the corresponding top decile values are 6692 and 8825. The mean of SCI China is 3519, and SD is 10,635. The corresponding values for SCI Italy are 4357 and 13332, respectively. In our regression specifications, we use the natural logarithm of the SCI indices, which makes their distributions less skewed. County-level SCI indices with China and Italy are only 0.016 to 0.017 correlated with the number of restrictions.
Figure 1 (A and B) shows the county-level average number of types of restrictions implemented in calendar time and relative to the first restriction in the county. Figure 1C shows a map of the SCI with China for illustrative purposes. Figure 1D shows the average social distancing plotted conditional on the county’s social connectedness with China. It is visible that counties in the top 10% of social connectedness to China exercise substantially more social distancing immediately after the imposition of mobility restrictions.
Table 1 shows our regression analyses from our main empirical specification in Eq. 3. Column 1 runs the analysis for social connections with China, and column 2 runs the analysis for social connections with Italy. We find a significant positive relationship between the impact of restrictions on social distancing and social connections with China and Italy. The economic magnitudes across columns 1 and 2 are similar. However, when comparing the effects of social connections with China to those with Italy, column 3 shows that when included in the same regression specification, connections with Italy dominate connections with China in relative importance. We conjecture that this may be due to Facebook restrictions in China since July 2009.
Table 1. The efficacy of mobility restrictions and social connectedness.
The dependent variable is Social distancing. Restrictions is the number of the five restriction types currently adopted in the county. SCI China and SCI Italy are the SCI values between the county and China and Italy, respectively. N cases is the current number of confirmed cases in the county. Heteroscedasticity-consistent SEs, double-clustered by county and day, are shown in parentheses. Significance levels: *0.1, **0.05, and ***0.01.
| (1) | (2) | (3) | |
| Restr. × ln(SCI China) | 0.0048*** (0.0004) |
0.0011** (0.0005) |
|
| Restr. × ln(SCI Italy) | 0.0052*** (0.0004) |
0.0042*** (0.0005) |
|
| Restrictions (0–5) | −0.0245*** (0.0040) |
−0.0280*** (0.0043) |
−0.0280*** (0.0042) |
| ln(N cases) | 0.0122*** (0.0009) |
0.0114*** (0.0009) |
0.0113*** (0.0009) |
| State-Day FE | Yes | Yes | Yes |
| County FE | Yes | Yes | Yes |
| N | 184,766 | 184,766 | 184,766 |
| R 2 | 0.756 | 0.756 | 0.756 |
Other reasons may include different time zones, with Italy sharing more intersecting hours of the workday with the United States, relative linguistic similarity, and potentially different information being shared from the two countries. For example, China had a stricter lockdown and articles or content shared may have focused more on the governmental response, while information from Italy may have focused more on mortality.
Although access to Facebook in China is still possible through a virtual private network with an estimate of 1.3 to 2.9 million active users, Facebook usage as a fraction of total population is much lower than that of Italy (51% as of September 2018), where the figures are based on Statista Digital Market Outlook from February 2019 and Internet World Statistics as of 10 April 2020. This might mean that it is a less accurate proxy for general social connections with China than with Italy.
The economic magnitude of the effect of social connections is large. Relative to a county with average social connectedness, a one SD increase in social connectedness to China or Italy—approximately an increase of five times the existing number of connections in a given county—increases the estimated effect of mobility restrictions by 45 and 47%, respectively. The details of this calculation are explained in section S3. In terms of statistical importance, section S3 discusses the relative improvement in R2 due to social connections. The incremental R2 from the inclusion of social connectedness is approximately 10% of the effect of mobility restrictions themselves.
Our main hypothesis is that social connections with the early epicenters of the pandemic increase the estimated effects of mobility restrictions by acting as a conduit of information. Consistent with this hypothesis, we find an economically and statistically significant positive relation between social connections with Italy and China and the estimated effect of mobility restrictions on social distancing. However, the alternative explanation for this positive relationship is that social connections may be correlated with travel between the two regions. Counties with more social connections with China or Italy may have more travelers from these countries and hence possibly face a higher risk of infection. This could result in more social distancing without more information. Although this concern is partially mitigated by the fact that international travel restrictions were imposed on China at the beginning of our sample and on Italy in the middle of our sample, physical travel could still have occurred. Hence, we next conduct additional empirical analyses to test this risk exposure hypothesis.
Information or risk exposures
The impact of social connections on the estimated effect of mobility restrictions could either reflect information brought about via social connections or perceived exposure to risk from travelers. To differentiate these two possibilities, we study whether differences in the effect of mobility restrictions related to social connections with China and Italy differ across county risk profiles. If social connectedness is simply a proxy for physical risk exposure, counties with populations that are more at risk from COVID-19 should be more sensitive to social connections.
Instead, if information is the main channel, the role of social connections in conveying new information should be smaller as people will be more incentivized to seek information elsewhere apart from their social connections. Because the marginal benefit of relevant information is higher for those with higher risk exposures, they will be more likely to pay a cost to actively search for information in other sources rather than simply rely on their social connections. In this sense, motivated by economic theory on rational inattention (29), if the main mechanism through which social connections affect the estimated effects of mobility restrictions on social distancing is information, then high-risk populations are likely less affected.
In Table 2, we study the interaction of three risk factors with mobility restrictions and social connections: proximity to an airport, diabetes, and population density. A risk-based explanation interprets social connections as a proxy for risk from greater flow thus, counties that are more at risk from travel from China or Italy should respond more to the interaction of social connections and mobility restrictions. The first two columns repeat our main analysis excluding counties with airports and adjacent counties, finding nearly identical coefficients. This result suggests that social connections with China and Italy do not increase the estimated effects of mobility restrictions on social distancing through perceptions of risk of travelers. Columns 3 through 6 test whether at-risk populations with high fractions of diabetic individuals and those in more densely populated areas respond more to social connections. The coefficients suggest that counties with a one SD higher population density have a roughly one-fourth smaller effect of social connections. People in more at-risk areas exhibit a smaller increase in the estimated effect of mobility restrictions due to social connections, which is inconsistent with a risk-based explanation. Therefore, our results appear more consistent with information flow via social connections.
Table 2. The effect of social connectedness across risk groups.
The dependent variable is Social distancing. Restrictions is the number of the five restriction types currently adopted in the county. SCI China and SCI Italy are the SCI values between the county and China and Italy, respectively. Diabetic is the share of county population diagnosed to have diabetes. Population density is the average population density in the county, measured in thousand people per square mile. N cases is the current number of confirmed cases in the county. Columns 1 and 2 exclude all counties with commercial airports handling at least 10,000 commercial services per year, as well as adjacent counties. Heteroscedasticity-consistent SEs, double-clustered by county and day, are shown in parentheses. Significance levels: *0.1, **0.05, and ***0.01.
| Ex. airp. & adj. counties | Diabetes | Pop. density | ||||
| (1) | (2) | (3) | (4) | (5) | (6) | |
| Restr. × ln(SCI China) | 0.0045*** (0.0006) | 0.0081*** (0.0008) | 0.0046*** (0.0004) | |||
| Restr. × ln(SCI Italy) | 0.0054*** (0.0006) | 0.0088*** (0.0008) | 0.0051*** (0.0004) | |||
| Restr. × ln(SCI China) × Diabetic | −0.0354*** (0.0057) | |||||
| Restr. × ln(SCI Italy) × Diabetic | −0.0374*** (0.0057) | |||||
| Restr. × Diabetic | 0.1588*** (0.0341) | 0.1782*** (0.0360) | ||||
| Restr. × ln(SCI China) × Pop. density | −0.0012*** (0.0003) | |||||
| Restr. × ln(SCI Italy) × Pop. density | −0.0007*** (0.0003) | |||||
| Restr. × Pop. density | 0.0140*** (0.0038) | 0.0085*** (0.0030) | ||||
| Restrictions (0–5) | −0.0159*** (0.0058) |
−0.0200*** (0.0059) | −0.0384*** (0.0057) | −0.0438*** (0.0061) | −0.0236*** (0.0040) | −0.0273*** (0.0043) |
| ln(N cases) | 0.0138*** (0.0020) | 0.0117*** (0.0019) | 0.0110*** (0.0009) | 0.0101*** (0.0009) | 0.0123*** (0.0009) | 0.0114*** (0.0009) |
| State-Day FE | Yes | Yes | Yes | Yes | Yes | Yes |
| County FE | Yes | Yes | Yes | Yes | Yes | Yes |
| N | 44,405 | 44,405 | 184,766 | 184,766 | 184,766 | 184,766 |
| R 2 | 0.713 | 0.714 | 0.757 | 0.757 | 0.756 | 0.756 |
In section S1, we perform further tests to confirm that our results are not driven by traveler risk. We find similar empirical results when excluding the state of New York, the epicenter of COVID-19 cases in the United States, as well as states adjacent to New York, which would be within a short travelling distance. The results are also robust to excluding the 20% of U.S. counties with the highest share of Asians. Similar to the results on diabetes, we also find that more obese populations comply with restrictions better and are less affected by additional information via social connections.
Together, the additional results above are more consistent with social connections acting as a conduit of information rather than acting as a proxy for risk exposures. However, what kind of information is transmitted through social connections? In the following section, we explore the nature of information transmitted through social connections by documenting whether counties with a more sophisticated population respond differentially to social connections, whether the information interacts with motivated reasoning, and whether homophily in social connections creates redundancies or complementarities with social connections.
The nature of information in social connections
County-level sophistication
People who are less informed about the risk of the pandemic might be less responsive to voluntary mobility restrictions and more affected by information received through social connections. In Table 3, we study two measures that are likely to be correlated with the level of information: age and education. First, columns 1 and 2 show that counties with older populations are less compliant with mobility restrictions, as reflected in the negative coefficient estimated for Restr. × ln (Age). Because older populations are more susceptible to the COVID-19 virus (30), if they were informed, we would expect larger estimated effects of mobility restrictions among counties with older populations. However, our estimates suggest the opposite. The coefficient of interest on Restr. × ln (Age) × ln (SCI China) is positive, meaning the impact of social connections on the estimated effects of mobility restrictions is higher in older populations, consistent with older populations actually being less informed about the impact of COVID-19.
Table 3. The effect of social connectedness by demography.
The dependent variable is Social distancing. Restrictions is the number of the five restriction types currently adopted in the county. SCI China and SCI Italy are the SCI values between the county and China and Italy, respectively. Age is the median age of the county population. Education is the share of county population having a bachelor’s degree or higher. N cases is the current number of confirmed cases in the county. Heteroscedasticity-consistent SEs, double-clustered by county and day, are shown in parentheses. Significance levels: *0.1, **0.05, and ***0.01.
| Age | Education | |||
| (1) | (2) | (3) | (4) | |
| Restr. × ln(SCI China) × ln(Age) |
0.0042*** (0.0014) |
|||
| Restr. × ln(SCI Italy) × ln(Age) |
0.0041*** (0.0014) |
|||
| Restr. × ln(Age) | −0.0242** (0.0097) |
−0.0253** (0.0100) |
||
| Restr. × ln (SCI China) × Edu. |
−0.0037** (0.0017) |
|||
| Restr. × ln (SCI Italy) × Edu. |
−0.0018 (0.0018) |
|||
| Restr. × Education | 0.0770*** (0.0150) |
0.0624*** (0.0155) |
||
| Restr. × ln (SCI China) |
−0.0106** (0.0051) |
0.0044*** (0.0006) |
||
| Restr. × ln (SCI Italy) |
−0.0099* (0.0051) |
0.0044*** (0.0006) |
||
| Restrictions (0–5) | 0.0646* (0.0358) |
0.0655* (0.0369) |
−0.0335*** (0.0050) |
−0.0336*** (0.0053) |
| ln(N cases) | 0.0125*** (0.0009) |
0.0117*** (0.0009) |
0.0104*** (0.0009) |
0.0094*** (0.0010) |
| State-Day FE | Yes | Yes | Yes | Yes |
| County FE | Yes | Yes | Yes | Yes |
| N | 184,766 | 184,766 | 184,766 | 184,766 |
| R 2 | 0.756 | 0.756 | 0.758 | 0.758 |
Similarly, columns 3 and 4 show that counties with a smaller share of college-educated residents are less responsive to restrictions, as illustrated by the positive coefficient on Restr. × Education. In addition, consistent with the age result, we find a negative sign on our coefficient of interest on Restr. × ln (Education) × ln (SCI), meaning that the impact of social connections on the estimated effects of mobility restrictions is higher in less educated counties. However, this relation is only statistically significant for social connections with China, whereas the interacted effect with social connections with Italy has a t statistic of roughly 1. This evidence suggests that social connections may be less important in explaining the responsiveness of relatively educated demographics to mobility restrictions. This is consistent with education and information transmission from social connections being possible substitutes.
New information versus motivated reasoning
Even if people received the same information, they may interpret it differently. Motivated reasoning means people interpret information in a biased fashion to achieve the preferred conclusion. In the United States, studies show that people with different political orientations respond differently to public health policies (31, 32). Political orientation even appears to affect primary care physicians’ recommendations for patients on politicized health issues, such as drug use, firearm safety, and sexual behavior (33). A concurrent study also provides evidence that political views have a significant effect on social distancing, with Republicans generally being less likely to socially distance (34). These differences may be because they receive different information (35, 36), or because of motivated reasoning, which leads individuals to misinterpret information to better fit their existing biases (17).
In the setting of the pandemic response in the United States, a natural question is whether the partisan differences in estimated effects of mobility restrictions on social distancing are mitigated or amplified by social connections. This analysis also provides an opportunity to test whether the partisan divide is more consistent with information differences or motivated reasoning. If Republican counties are less aware of the risks of COVID-19 than Democratic counties, they should be more affected by information from social connections. On the other hand, if the differences are driven purely by motivated reasoning, Republican counties should be less affected by social connections: Any information coming from them might be interpreted as false or not applicable to them and hence have a smaller effect on social distancing behavior.
In Table 4, we test the effect of social connections on the effect of mobility restrictions conditional on whether the county voted Democratic or Republican in the 2016 presidential election. Columns 1 and 2 interact SCI indices with an indicator of whether the county is Republican or Democratic. Consistent with the abovementioned studies, we find that Republicans are generally less responsive to mobility restrictions. However, the estimated coefficients for interaction terms with ln(SCI China) and ln(SCI Italy) are positive, showing that the effect of social connections is 17 to 25% larger for Republican counties than for Democratic ones. These results suggest that the documented partisan differences in social distancing are more consistent with differences in information than with motivated reasoning and that social connections with areas with more relevant information may mitigate the partisan differences in public health policy responses.
Table 4. The effect of social connectedness by political orientation and race.
The dependent variable is Social distancing. Restrictions is the number of the five restriction types currently adopted in the county. SCI China and SCI Italy are the SCI values between the county and China and Italy, respectively. Republican is a dummy taking the value one if more people voted Republicans than for Democrats in the 2016 presidential election. Asian and White are the shares of county population classified as Asian and White in the Census, respectively. N cases is the current number of confirmed cases in the county. Heteroscedasticity-consistent SEs, double-clustered by county and day, are shown in parentheses. Significance levels: *0.1, **0.05, and ***0.01.
| Political orientation | Race | |||
| (1) | (2) | (3) | (4) | |
| Restr. × ln(SCI China) × Rep. | 0.0010** (0.0004) | |||
| Restr. × ln(SCI Italy) × Rep. | 0.0008* (0.0004) | |||
| Restr. × Republican | −0.0066* (0.0034) | −0.0051 (0.0034) | ||
| Restr. × ln(SCI China) × Asian | −0.0601* (0.0303) | |||
| Restr. × ln(SCI Italy) × Asian | 0.0723** (0.0299) | |||
| Restr. × Asian | −0.0824 (0.0896) | |||
| Restr. × ln(SCI China) × White | 0.0066** (0.0032) | |||
| Restr. × ln(SCI Italy) × White | −0.0048 (0.0034) | |||
| Restr. × White | 0.0060 (0.0078) | |||
| Restr. × ln(SCI China) | 0.0040*** (0.0005) | 0.0016*** (0.0006) | −0.0043 (0.0027) | |
| Restr. × ln(SCI Italy) | 0.0046*** (0.0005) | 0.0034*** (0.0006) | 0.0083*** (0.0030) | |
| Restrictions (0–5) | −0.0199*** (0.0047) | −0.0245*** (0.0050) | −0.0251*** (0.0043) | −0.0357*** (0.0072) |
| ln(N cases) | 0.0129*** (0.0010) | 0.0120*** (0.0010) | 0.0106*** (0.0009) | 0.0122*** (0.0010) |
| State-Day FE | Yes | Yes | Yes | Yes |
| County FE | Yes | Yes | Yes | Yes |
| N | 184,766 | 184,766 | 184,766 | 184,766 |
| R 2 | 0.756 | 0.756 | 0.757 | 0.757 |
New information versus trust and homophily
Rather than social connections facilitating information flow, the larger estimated effects of mobility restrictions on social distancing due to social connections may reflect race-based trust, a potential confounding variable. On the one hand, more similar socially connected people trust each other more (37). On the other hand, people with similar traits and norms are more likely to be socially connected (38–40) and may therefore have similar information sets.
The trust hypothesis predicts that counties with more similar racial compositions with China or Italy would trust social connections from those areas more. In other words, counties with a larger white fraction of the population should be more responsive to social connections with Italy, while counties with a larger Asian fraction of the population should be more responsive to social connections with China.
Homophily in culture or norms implies that socially connected people of the same race may have similar information and norms. In this case, counties with a larger white fraction of the population will tend to have similar information sets as Italy and counties with a larger Asian fraction of the population will tend to have similar information sets as China. Therefore, if social connections facilitate information transmission, we should see social connections between counties with more Asians and Italy to be more influential than connections with China and vice versa for counties that have a larger white fraction of the population. Last, without the effects of any homophily in social connections, there should be no differential responses.
Columns 3 and 4 of Table 4 provide no evidence of race-based homophily and instead suggest that there appears to be more useful information to be gained across racial lines. More Asian communities are statistically more responsive to mobility restrictions when they are more socially connected to Italy. Meanwhile, more white communities with a larger fraction of Caucasian households are more responsive to social distancing restrictions when they are socially connected to people in China. In terms of economic magnitude, social connections to Italy in counties with 10% more Asian people have more than double the average effect from social connections to Italy, while social connections to China in counties with 10% more white people have an effect around 14% larger than the average effect from social connections to China based on the main results in Table 1.
These results are consistent with social connections facilitating information flow, as we find that more cross-racial social connections increase the estimated effect of mobility restrictions more. Homophily in social connections manifests as those with similar characteristics are more likely to be friends. For example, people in counties with a larger Asian fraction of the population and people in China may follow similar news sources, and therefore, on the margin, the social connections may be less useful in transmitting additional information. Such counties likely also have less overlapping information sets with people in Italy, so on the margin social connections with Italy may transmit more information. Therefore, cross-racial social connections will tend to transmit more incremental information.
Misinformation
Last, we study whether social connections may also transmit misinformation resulting in negative public health outcomes. For example, social connections with people who deny the existence of climate change might be associated with a flow of misinformation about the pandemic. If social connections spread misinformation that reduces the perceived severity of the situation, such connections would associate with reduced estimated effects of mobility restrictions on social distancing. We use three possible but imperfect proxies for misinformation: low education level, Trump vote share in the 2016 presidential election, and climate change denial.
For this analysis, rather than using social connections with foreign countries, we construct an adjusted social connection index for each county, weighting connections with other counties’ based on proxies for misinformation. In this calculation, we exclude one’s own state from the calculations. For example, when calculating the climate change denial SCI-weighted measure for Los Angeles county, we use Los Angeles county’s social connections with other counties but exclude other California counties.
Table 5 shows consistent results across all three proxies of misinformation. Column 1 suggests that being socially connected to less educated communities is associated with a decreased effect of mobility restrictions. Similarly, columns 2 and 3 suggest that social connections with counties where a larger share of population voted for Donald Trump in the 2016 election and with counties with a higher fraction of population denying the existence of climate change are associated with a reduction in the effect of mobility restrictions. These results suggest that social connections may also disseminate information that makes individuals less likely to comply with mobility restrictions.
Table 5. Misinformation via social connections.
The dependent variable is Social distancing. Restrictions is the number of the five restriction types currently adopted in the county. SCI-weighted Low education is the SCI-weighted average of the proportion of people with less than a bachelor degree in the counties that the county itself is connected to, SCI-weighted Trump vote is the SCI-weighted average of the Trump vote share in the 2016 presidential election in the counties that the county itself is connected to, and SCI-weighted Climate denial is the SCI-weighted average of the share of people saying climate change is not happening in the counties that the county itself is connected to. All SCI-weighted variables exclude the counties located in the same state. N cases is the current number of confirmed cases in the county. Heteroscedasticity-consistent SEs, double-clustered by county and day, are shown in parentheses. Significance levels: *0.1, **0.05, and ***0.01.
| (1) | (2) | (3) | |
| Restr. × SCI-w Low education |
−0.2286*** (0.0216) |
||
| Restr. × SCI-w Trump vote |
−0.0010*** (0.0001) |
||
| Restr. × SCI-w Climate denial |
−0.0015*** (0.0004) |
||
| Restrictions (0–5) | 0.1664*** (0.0162) |
0.0573*** (0.0076) |
0.0301*** (0.0079) |
| ln(N cases) | 0.0185*** (0.0011) |
0.0199*** (0.0011) |
0.0233*** (0.0012) |
| State-Day FE | Yes | Yes | Yes |
| County FE | Yes | Yes | Yes |
| N | 185,356 | 185,356 | 185,356 |
| R 2 | 0.752 | 0.751 | 0.749 |
Overall, our findings show that both information and misinformation appear to be transmitted through social connections. However, there may be additional interpretations of our results due to other confounding variables like altruism or remote working. For example, counties with more social connections overall may be more conscientious and therefore comply more with social distancing. Alternatively, counties with more social connections to China or Italy may also have switched more to remote working in response to mobility restrictions. In such a case, the increase in the estimated effect of mobility restrictions does not reflect voluntary changes in behavior but simply reflects changes in firm policies. In the section below, we provide additional empirical tests of such confounding effects.
Other robustness checks
Given the definition of Facebook’s SCI, counties more socially connected with China or Italy may also be socially connected to other countries in general. Such counties might be generally more cosmopolitan, aware of news, or more altruistic. Although plausible, this interpretation appears inconsistent with the data for two reasons: (i) The same results appear when using relative friend probabilities (see table S4), a measure of social connections that is scaled by population and for which measures across countries are less correlated, and (ii) social connections with China and Italy appear to matter significantly more than social connections with other countries that are unlikely to have more COVID-19–related information than the United States (table S6).
In addition to information from China or Italy, people may also respond to domestically generated COVID-19 information. We find evidence of this in section S4.5, which shows that social connections with counties in New York, as well as a social connection–weighted measure of U.S. cases, increase the efficacy of mobility restrictions. Both results corroborate our main finding that social connections transmit relevant information that affects the efficacy of mobility restrictions in the pandemic response.
Last, we consider how differences in ability to work remotely or remain employed during the pandemic may affect our inferences. One might wonder if socially connected counties differ in manners relevant for responses to mobility restrictions. For example, workers with international social connections might have higher income and thereby be able to afford not going to work, or have a greater ability to do remote work. In section S4.6, we discuss the issue at length. In short, we argue that work adjustments are unlikely to account for our results: Adjustments to work activity in the short window after the first mobility restriction were much smaller than the adjustments to devices remaining at home. Furthermore, we discuss numerous approaches to take in measuring county-level heterogeneity in local unemployment rates, remote work, delivery work, and other economic characteristics. We incorporate these data to construct multiple variations of our social distancing measure, finding quantitatively similar estimates in all empirical specifications.
DISCUSSION
We find robust evidence that U.S. counties with more social connections with the two countries most severely affected by COVID-19 early on, Italy and China, comply significantly more with mobility restrictions imposed by local governments. Our additional analysis suggests that this effect is most consistent with relevant information flow through social connections, as opposed to social connections acting as a proxy for risk of travel flow from affected areas. These findings have two major implications. First, the information that people possess about the severity of a pandemic is likely to affect the efficacy of mobility-based nonpharmaceutical interventions. Second, social connections are more broadly important in transmitting this information.
We also provide evidence that the differences between Republicans and Democrats in social distancing are more likely due to differences in information rather than to biases in interpreting information. This finding has important policy implications, as it suggests that changes in the information environment can boost the effectiveness of nonpharmaceutical interventions. This would not be the case if the differences were driven solely by motivated reasoning, which biases the interpretation of information, as the new information would not result in changes in behavior. Our finding, consistent with larger information gains in cross-racial social connections, could be taken as encouragement for maintaining a diverse group of social contacts.
However, we also find evidence possibly suggesting that not all social connections disseminate useful information. Social connections with counties more likely to be poorly informed are associated with reductions in the estimated effects of mobility restrictions on social distancing. Therefore, whether conducted by regulators or a social media platform, monitoring and ensuring transmission of high-quality information through social connections may have important implications for fighting pandemics. In this vein, our paper reinforces a broad thrust of research that assesses how online social networks mediate the flow of information and misinformation (21, 22), potentially affecting personal health decisions.
There are two limitations to this research that should be kept in mind when interpreting our findings. First, our study is based on observational data and not on field or laboratory experiments. The ideal scientific experiment would require the researcher to assign social connections and the pandemic across a broad spectrum of counties with various characteristics in a random manner. As that kind of experiment is clearly not possible in this case, we relied instead on attempting to control for the relevant differences in characteristics and local situation across counties. Although such exercises are never perfect, we draw comfort from the diversity of analyses that we perform, and on the fact that our analyses support the idea that social connections can be an important channel for information and have important real-world implications for government efforts to fight pandemics. Second, our results suggest that social connections affect the effectiveness of mobility restrictions on social distancing through information transmission; but these findings not exclude the possibility that other mechanisms, such as travel-based spread of COVID-19 or motivated reasoning, may play some role as well. However, quantifying the impact of such other mechanisms is beyond the scope of this study.
Supplementary Material
Acknowledgments
We thank the Facebook Data for Good initiative for providing access to anonymized aggregated social connection data, SafeGraph for providing access to anonymized aggregated mobility data, and the SafeGraph COVID-19 response community for helpful input. We also thank S. Davis, Z. He, C.-T. Hsieh, T.-C. Lin, M. Paaso, A. Wagner, B. Yeung, and participants of the Becker Friedman Institute–China and Asian Bureau of Finance and Economic Research seminar series on COVID-19. Funding: B.C. acknowledges financial support from NUS Start-up Research Grant R-315-000-119-133 and Singapore Ministry of Education Tier 1 Grant R-315-000-122-115. Author contributions: All authors contributed equally. Competing interests: The authors declare that they have no competing interests. Data and materials availability: All data needed to evaluate the conclusions in the paper are present in the paper and/or the Supplementary Materials. Additional data related to this paper may be requested from the authors.
SUPPLEMENTARY MATERIALS
Supplementary material for this article is available at http://advances.sciencemag.org/cgi/content/full/sciadv.abc3054/DC1
REFERENCES AND NOTES
- 1.Adalja A. A., Toner E., Inglesby T. V., Priorities for the US health community responding to COVID-19. JAMA 323, 1343–1344 (2020). [DOI] [PubMed] [Google Scholar]
- 2.Chowell G., Hengartner N. W., Castillo-Chavez C., Fenimore P. W., Hyman J. M., The basic reproductive number of Ebola and the effects of public health measures: The cases of Congo and Uganda. J. Theor. Biol. 229, 119–126 (2004). [DOI] [PubMed] [Google Scholar]
- 3.Milne G. J., Kelso J. K., Kelly H. A., Huband S. T., McVernon J., A small community model for the transmission of infectious diseases: Comparison of School closure as an intervention in individual-based models of an influenza pandemic. PLOS ONE 3, e4005 (2008). [DOI] [PMC free article] [PubMed] [Google Scholar]
- 4.Horney J. A., Moore Z., Davis M., MacDonald P. D., Intent to receive pandemic influenza a (H1N1) vaccine, compliance with social distancing and sources of information in NC, 2009. PLOS ONE 5, e11226 (2010). [DOI] [PMC free article] [PubMed] [Google Scholar]
- 5.Leung G. M., Nicoll A., Reflections on pandemic (H1N1) 2009 and the international response. PLOS Med. 7, e1000346 (2010). [DOI] [PMC free article] [PubMed] [Google Scholar]
- 6.Liao Q., Cowling B., Lam W. T., Ng M. W., Fielding R., Situational awareness and health protective responses to pandemic influenza A (H1N1) in Hong Kong: A crosssectional study. PLOS ONE 5, e13350 (2010). [DOI] [PMC free article] [PubMed] [Google Scholar]
- 7.Fisman D. N., Getting school: School closure, age distribution, and pandemic mitigation. Ann. Intern. Med. 156, 238–240 (2012). [DOI] [PubMed] [Google Scholar]
- 8.Gerwin L. E., The challenge of providing the public with actionable information during a pandemic. J. Law Med. Ethics 40, 630–654 (2012). [DOI] [PubMed] [Google Scholar]
- 9.Rappuoli R., Dormitzer P. R., Influenza: Options to improve pandemic preparation. Science 336, 1531–1533 (2012). [DOI] [PubMed] [Google Scholar]
- 10.Charoenwong B., Kwan A., Umar T., Does regulatory jurisdiction affect the quality of investment-adviser regulation? Am. Econ. Rev. 109, 3681–3712 (2019). [Google Scholar]
- 11.Prem K., Liu Y., Russell T. W., Kucharski A. J., Eggo R. M., Davies N.; Centre for the Mathematical Modelling of Infectious Diseases COVID-19 Working Group, Jit M., Klepac P., The effect of control strategies to reduce social mixing on outcomes of the COVID-19 epidemic in Wuhan, China: A modelling study. Lancet Public Health 5, e261–e270 (2020). [DOI] [PMC free article] [PubMed] [Google Scholar]
- 12.Kraemer M. U. G., Yang C.-H., Gutierrez B., Wu C.-H., Klein B., Pigott D. M.; Open COVID- Data Working Group, du Plessis L., Faria N. R., Li R., Hanage W. P., Brownstein J. S., Layan M., Vespignani A., Tian H., Dye C., Pybus O. G., Scarpino S. V., The effect of human mobility and control measures on the COVID-19 epidemic in China. Science 368, 493–497 (2020). [DOI] [PMC free article] [PubMed] [Google Scholar]
- 13.Tizzoni M., Bajardi P., Decuyper A., King G. K. K., Schneider C. M., Blondel V., Smoreda Z., González M. C., Colizza V., On the use of human mobility proxies for modeling epidemics. PLOS Comput. Biol. 10, e1003716 (2014). [DOI] [PMC free article] [PubMed] [Google Scholar]
- 14.Reluga T. C., Game theory of social distancing in response to an epidemic. PLOS Comput. Biol. 6, e1000793 (2010). [DOI] [PMC free article] [PubMed] [Google Scholar]
- 15.Grossman S. J., Stiglitz J. E., On the impossibility of informationally efficient markets. Am. Econ. Rev. 70, 393–408 (1980). [Google Scholar]
- 16.Lacetera N., Pope D. G., Sydnor J. R., Heuristic thinking and limited attention in the car market. Am. Econ. Rev. 102, 2206–2236 (2012). [Google Scholar]
- 17.Guilbeault D., Becker J., Centola D., Social learning and partisan bias in the interpretation of climate trends. Proc. Natl. Acad. Sci. U.S.A. 115, 9714–9719 (2018). [DOI] [PMC free article] [PubMed] [Google Scholar]
- 18.Goyal S., Rosenkranz S., Weitzel U., Buskens V., Information acquisition and exchange in social networks. Econ. J. 127, 2302–2331 (2017). [Google Scholar]
- 19.Glaeser E. L., Laibson D. I., Scheinkman J. A., Soutter C. L., Measuring trust. Q. J. Econ. 115, 811–846 (2000). [Google Scholar]
- 20.Sutton J., Spiro E. S., Johnson B., Fitzhugh S., Gibson B., Butts C. T., Warning tweets: Serial transmission of messages during the warning phase of a disaster event. Inf. Commun. Soc. 17, 765–787 (2014). [Google Scholar]
- 21.Zhang J., Centola D., Social networks and health: New developments in diffusion, online and offline. Annu. Rev. Sociol. 45, 91–109 (2019). [Google Scholar]
- 22.Swire-Thompson B., Lazer D., Public health and online misinformation: Challenges and recommendations. Annu. Rev. Public Health 41, 433–451 (2020). [DOI] [PubMed] [Google Scholar]
- 23.Bailey M., Cao R., Kuchler T., Stroebel J., Wong A., Social Connectedness: Measurement, determinants, and effects. J. Econ. Perspect. 32, 259–280 (2018). [PubMed] [Google Scholar]
- 24.Eagle N., Pentland A. S., Lazer D., Inferring friendship network structure by using mobile phone data. Proc. Natl. Acad. Sci. U.S.A. 106, 15274–15278 (2009). [DOI] [PMC free article] [PubMed] [Google Scholar]
- 25.Jones J. J., Settle J. E., Bond R. M., Fariss C. J., Marlow C., Fowler J. H., Inferring tie strength from online directed behavior. PLOS ONE 8, e52168 (2013). [DOI] [PMC free article] [PubMed] [Google Scholar]
- 26.C. E. Bird, P. P. Rieker, Gender and Health: The Effects of Constrained Choices and Social Policies (Cambridge Univ. Press, 2008), pp. 1–256. [Google Scholar]
- 27.Bailey M., Cao R., Kuchler T., Stroebel J., The economic effects of social networks: Evidence from the housing market. J. Polit. Econ. 126, 2224–2276 (2018). [Google Scholar]
- 28.Bu D., Hanspal T., Liao Y., Liu Y., Risk taking during a global crisis: Evidence from wuhan. Covid Econ. 5, 106–146 (2020). [Google Scholar]
- 29.C. A. Sims, Rational Inattention and Monetary Economics (Elsevier Ltd., 2010), vol. 3, pp. 155–181. [Google Scholar]
- 30.Grasselli G., Zangrillo A., Zanella A., Antonelli M., Cabrini L., Castelli A., Cereda D., Coluccello A., Foti G., Fumagalli R., Iotti G., Latronico N., Lorini L., Merler S., Natalini G., Piatti A., Ranieri M. V., Scandroglio A. M., Storti E., Cecconi M., Pesenti A.; COVID- 19 Lombardy ICU Network , Baseline Characteristics and Outcomes of 1591 Patients Infected With SARS-CoV-2 Admitted to ICUs of the Lombardy Region, Italy. JAMA 323, 1574–1581 (2020). [DOI] [PMC free article] [PubMed] [Google Scholar]
- 31.Baum M. A., Red state, blue state, flu state: Media self-selection and partisan gaps in swine flu vaccinations. J. Health Polit. Policy Law 36, 1021–1059 (2011). [DOI] [PubMed] [Google Scholar]
- 32.Mesch G. S., Schwirian K. P., Social and political determinants of vaccine hesitancy: Lessons learned from the H1N1 pandemic of 2009-2010. Am. J. Infect. Control 43, 1161–1165 (2015). [DOI] [PMC free article] [PubMed] [Google Scholar]
- 33.Hersh E. D., Goldenberg M. N., Democratic and Republican physicians provide different care on politicized health issues. Proc. Natl. Acad. Sci. U.S.A. 113, 11811–11816 (2016). [DOI] [PMC free article] [PubMed] [Google Scholar]
- 34.Painter M. O., Qiu T., Political beliefs affect compliance with covid-19 social distancing orders. Covid Econ. 4, 103–123 (2020). [Google Scholar]
- 35.Shuchman M., Wilkes M. S., Medical scientists and health news reporting: A case of miscommunication. Ann. Intern. Med. 126, 976–982 (1997). [DOI] [PubMed] [Google Scholar]
- 36.Martin G. J., Yurukoglu A., Bias in cable news: Persuasion and polarization. Am. Econ. Rev. 107, 2565–2599 (2017). [Google Scholar]
- 37.Guiso L., Sapienza P., Zingales L., Cultural biases in economic exchange? Q. J. Econ. 124, 1095–1131 (2009). [Google Scholar]
- 38.Watts D. J., Dodds P. S., Newman M. E. J., Identity and search in social networks. Science 296, 1302–1305 (2002). [DOI] [PubMed] [Google Scholar]
- 39.Hawkley L. C., Browne M. W., Cacioppo J. T., How can i connect with thee? Let me count the ways. Psychol. Sci. 16, 798–804 (2005). [DOI] [PubMed] [Google Scholar]
- 40.van Zomeren M., Postmes T., Spears R., Toward an integrative social identity model of collective action: A quantitative research synthesis of three socio-psychological perspectives. Psychol. Bull. 134, 504–535 (2008). [DOI] [PubMed] [Google Scholar]
- 41.J. I. Dingel, B. Neiman, “How many jobs can be done at home?” (Technical Report, National Bureau of Economic Research, 2020).
Associated Data
This section collects any data citations, data availability statements, or supplementary materials included in this article.
Supplementary Materials
Supplementary material for this article is available at http://advances.sciencemag.org/cgi/content/full/sciadv.abc3054/DC1