Abstract
Little is known about the biological roles of glycosylated RNAs (glycoRNAs), a recently discovered class of glycosylated molecules, because of a lack of visualization methods. We report sialic acid aptamer and RNA in situ hybridization-mediated proximity ligation assay (ARPLA) to visualize glycoRNAs in single cells with high sensitivity and selectivity. The signal output of ARPLA occurs only when dual recognition of a glycan and an RNA triggers in situ ligation, followed by rolling circle amplification of a complementary DNA, which generates a fluorescent signal by binding fluorophore-labeled oligonucleotides. Using ARPLA, we detect spatial distributions of glycoRNAs on the cell surface and their colocalization with lipid rafts as well as the intracellular trafficking of glycoRNAs through SNARE protein-mediated secretory exocytosis. Studies in breast cell lines suggest that surface glycoRNA is inversely associated with tumor malignancy and metastasis. Investigation of the relationship between glycoRNAs and monocyte–endothelial cell interactions suggests that glycoRNAs may mediate cell–cell interactions during the immune response.
Cellular glycans play important roles in biology by regulating many essential functions, including cell communication, homeostasis, immunomodulation and embryogenesis1. While proteoglycans, glycoproteins and glycosphingolipids have been widely studied, glycosylated RNAs (glycoRNAs) have recently been discovered on the surfaces of multiple cell lineages, organs and species2,3. This discovery is of interest because various modifications of RNAs (for example, pseudouridylation, methylation and adenylation4,5) contribute to diverse cellular processes, including tRNA-mediated translation4, RNA epigenetics6, chromatin structure modulation7 and RNA maturation8. Characterization of the spatial distributions and expression levels of glycoRNAs will elucidate the biological functions of glycoRNAs and their roles in health and diseas.
To identify and characterize glycoRNAs, several methods have I been used. Specifically, metabolic labeling and click chemistry-based RNA blots were used to confirm the existence of glycoRNAs in cells. To profile the sequences of glycoRNAs, next-generation sequencing has been used after magnetic bead-based enrichment of metabolically labeled glycoRNAs. In parallel, high-performance liquid chromatography and mass spectrometry were applied to study glycan composition and conformation. In addition, antibodies to double-stranded RNA or glycan-binding proteins (for example, lectin) have been used to verify glycoRNA on cell surfaces by imaging and proximity labeling2. However, these methods lack selectivity and specificity for glycoRNAs. Despite the progress made, there is a pressing need for a method to directly visualize glycoRNAs in situ, offering sequence and spatial information to better understand glycoRNA properties and functions.
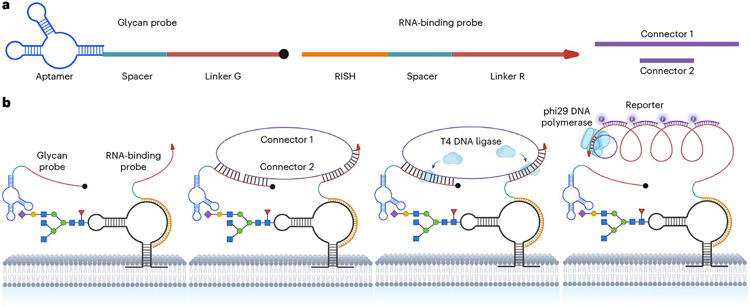
To image glycoRNAs in situ, we report herein a method to directly visualize glycoRNAs with high sensitivity and selectivity that contains a sialic acid aptamer for glycan binding and a DNA probe for glycoRNA in situ hybridization (termed sialic acid aptamer and RNA in situ hybridization-mediated proximity ligation assay (ARPLA)). Aptamers are single-stranded nucleic acids that act as affinity reagents for various targets9 and have wide applications in bioimaging10-12, diagnostics13-15, sensors16-19 and therapeutics 9,20-23. ARPLA relies on the in situ proximity ligation assay, which requires two binding probes in close proximity to generate a signal (Fig. 1)24-27. ARPLA’s dual recognition in proximity helps prevent false-positive signals from detecting each target individually or both targets that are far apart, and the proximity ligation assays have been widely applied to monitor the modifications and distribution of biomacromolecules with multiple recognizable moieties or interacting partners24,28-35. In ARPLA, glycoRNA dual recognition is achieved by combining the glycan-binding aptamer and RNA in situ hybridization (RISH) DNA probe36. This design ensures high selectivity for glycoRNAs with sequence specificity. The high detection sensitivity is attained when the dual-recognition probe triggers in situ ligation and rolling circle amplification (RCA) to generate signal outputs by the binding of fluorophore-labeled DNA probes24.
Fig. 1 ∣. Schematic illustration of glycoRNA in situ imaging using ARPLA.
a, Structure and functional domains of the glycan probe, the RNA-binding probe and the connectors. b, Details of ARPLA for glycoRNA recognition and signal amplification.
After validating the performance of ARPLA in various cell models and targeting multiple glycoRNAs, we focused on subcellular spatial distribution of glycoRNAs and revealed colocalization between glycoRNAs and lipid rafts. In addition, we observed intracellular localization of glycoRNAs, suggesting their secretory exocytosis through N-ethylmaleimide-sensitive factor attachment protein receptor (SNARE)-mediated pathways. Moreover, we applied ARPLA to investigate glycoRNA abundances in breast cancer models and observed a downregulation during breast cancer progression and metastasis. In immune cell models, we revealed a reduction in glycoRNAs during differentiation and an increase during proinflammatory responses. Finally, we demonstrated that glycoRNAs could strengthen interactions between monocytes/macrophages and vascular endothelial cells (ECs), suggesting their role in inflammatory responses. ARPLA expands the toolbox for glycoRNA imaging with high sensitivity and selectivity, paving the way for exploring the roles of glycoRNAs in diverse biological processes.
Results
Development of ARPLA for in situ imaging of glycoRNAs
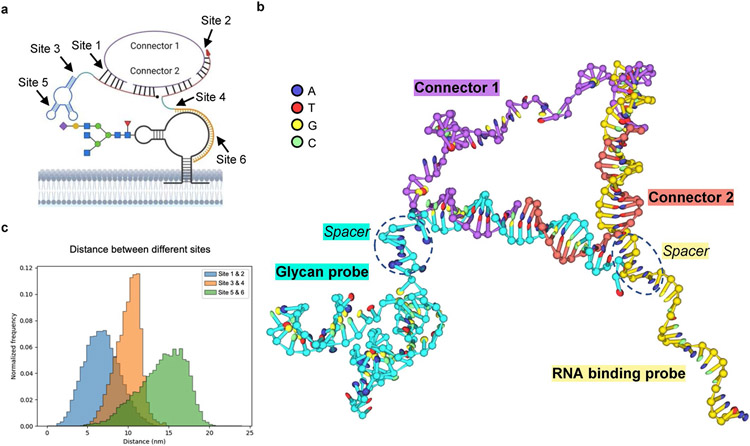
To visualize glycoRNAs on cell surfaces, we have designed ARPLA, which consists of four functional components (Fig. 1a): (1) a glycan probe, with an aptamer (‘aptamer’) selectively binding N-acetylneuraminic acid (Neu5Ac)36, which is enriched in glycoRNA2, a spacer (‘spacer’) to avoid steric hindrance during hybridization and a DNA linker (‘linker G’) for subsequent proximity ligation; (2) an RNA-binding probe with a DNA strand for RISH, another spacer (‘spacer’) and a DNA linker (‘linker R’) that works with linker G; (3) connectors 1 and 2 that hybridize with linkers G and R to allow in situ ligation to generate circular DNA as RCA template and (4) a reporter composed of fluorophore-conjugated single-stranded DNA (ssDNA) probes complementary to the RCA product to report the distribution of glycoRNAs. As shown in Fig. 1b, the detection of glycoRNAs occurs only when the dual recognition of glycan and RNA (step 1) triggers connector hybridization (step 2) and in situ ligation (step 3). The intact circular DNA then serves as the template for RCA to generate signal outputs by binding fluorescent reporters (step 4). The structure of ARPLA was predicted by molecular dynamics (MD) simulations (Extended Data Fig. 1), showing the assembly of the glycan probe, the RNA-binding probe and the connectors.
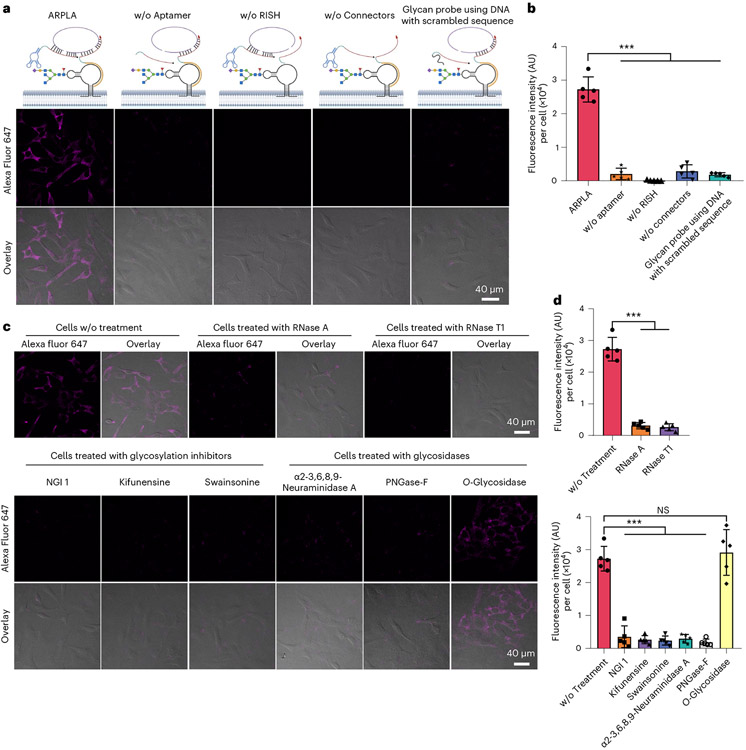
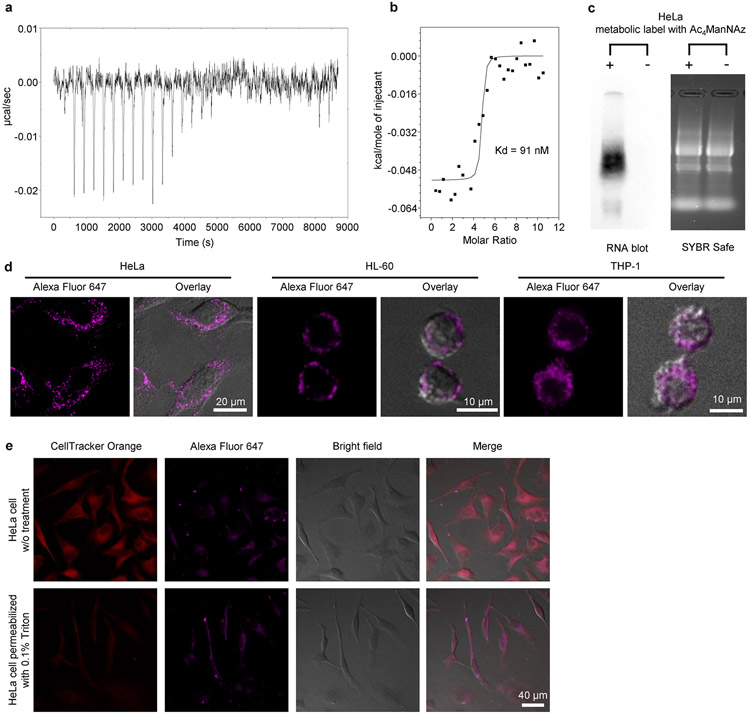
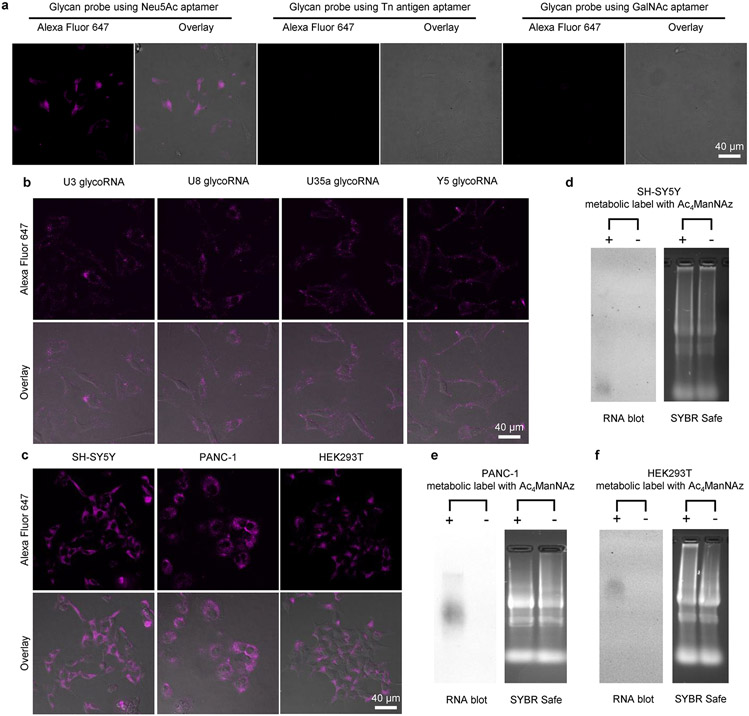
To validate ARPLA, we first determined the binding affinity (Kd) of the Neu5Ac aptamer by isothermal titration calorimetry (ITC) as 91 nM (Extended Data Fig. 2a,b), which is close to the reported Kd of 75 nM (ref. 36). As such, the Neu5Ac aptamer has a stronger Kd than other glycan-binding reagents, such as lectins (Kd = 1–10 μM)37 and antibodies (Kd in the micromolar range)38, making ARPLA a sensitive method to detect glycoRNAs. We verified the existence of glycoRNAs in HeLa cells through metabolic labeling with N-azidoacetylmannosamine-tetraacylated (Ac4ManNAz) biotinylation via click chemistry and RNA blotting, as described previously2 (Extended Data Fig. 2c). We then applied ARPLA to visualize small nuclear RNA U1 (U1 glycoRNA) as a representative target without cell membrane permeabilization using confocal laser-scanning microscopy (CLSM). As shown in Fig. 2a, Extended Data Fig. 2d and Supplementary Fig. 1, bright signals from ARPLA appeared on plasma membranes of all HeLa cells. Membrane integrity was confirmed intact by transmission-through-dye microscopic analysis (Extended Data Fig. 2e)39. When ARPLA was conducted without the aptamer, the RISH probe or the connectors, signals were reduced by 13-, 270- or 9-fold, respectively, demonstrating the necessity of all components (Fig. 2a,b). Additionally, replacing the Neu5Ac aptamer with a scrambled DNA sequence reduced fluorescence signals by tenfold, demonstrating the critical role of the aptamer in glycan recognition. Moreover, Tn antigen and GalNAc aptamers, which bind to O-linked glycans, were used individually to replace the Neu5Ac aptamer. As shown in Extended Data Fig. 3a, glycan probes with Tn antigen or GalNAc aptamer failed to produce visible signals, indicating that nearby glycans on the cell membrane do not contribute to ARPLA signals.
Fig. 2 ∣. Evaluation of ARPLA for glycoRNA imaging in HeLa cells.
a, CLSM images of glycoRNAs using ARPLA and various control groups in the absence of components for ARPLA; w/o, without. b, Quantification of average fluorescence intensity (arbitrary units (AU)) per cell in a; ***P < 0.0001. c, Validation of the specificity for ARPLA. Live HeLa cells were pretreated with RNase, glycosylation inhibitors or glycosidases, respectively, and fixed and analyzed by ARPLA. d, Quantification of average fluorescence intensity (AU) per cell in c. Data in b and d are representative of three independent experiments; n = 5 frames. Data are shown as mean ± s.d. Statistical significance was determined by unpaired two-tailed Student’s t-test; NS, not significant (P = 0.6100); ***P < 0.001.
To determine whether ARPLA can detect glycoRNAs semiquantitatively, we manipulated glycoRNA abundance by several approaches. To digest the RNA moiety of glycoRNA and validate sensor performance, live cells were incubated with RNase A or RNase T1 at 37 °C for 20 min, fixed and imaged with ARPLA. GlycoRNA signals were reduced by 88% or 90% after RNase A or T1 digestion compared to untreated cells (Fig. 2c,d). These results supported that cell surface RNA is one of the prerequisites for ARPLA to generate signals. To verify if the glycan moiety of glycoRNA is necessary for ARPLA, cells were pretreated with glycosylation inhibitors to disrupt the biosynthesis of glycoRNA2. As shown in Fig. 2c,d, after treating cells with N-linked glycosylation inhibitor 1 (NGI-1), kifunensine or swainsonine for 24 h, ARPLA signals decreased by 86%, 90% or 91%, respectively, compared to untreated cells, demonstrating ARPLA’s specificity for the glycan moiety of glycoRNA. Furthermore, live cells were treated with glycosidases, PNGase-F or α2-3,6,8,9-neuraminidase A, which are known to cleave the glycan moiety of glycoRNAs2. This treatment resulted in decreases in signals from PNGase-F- and α2-3,6,8,9-neuraminidase A-treated cells by 89% and 93%, respectively, compared to untreated cells (Fig. 2c,d). By contrast, a similar signal was obtained from O-glycosidase-treated cells (Fig. 2c,d), which cannot cleave glycan from glycoRNAs2. These pharmacological and enzymatic treatments validated the specificity of ARPLA for glycoRNA’s glycan moiety. Taken together, ARPLA can be used for in situ imaging of glycoRNAs with high sensitivity and selectivity.
To evaluate the generality of ARPLA, we further explored its ability to image glycoRNAs with various RNA sequences and its applicability in different cell lines. When the RISH section in the RNA-binding probe was replaced with a different sequence targeting other glycoRNAs, such as SNORD3a (U3), SNORD8 (U8), SNORD35a (U35a) or Y5 (ref. 2), ARPLA successfully visualized the corresponding glycoRNA in HeLa cells and not those with a different sequence (Extended Data Fig. 3b). Furthermore, we applied ARPLA to different cell lines, including a human neuroblastoma cell line (SH-SY5Y), a human pancreas carcinoma cell line (PANC-1) and a human embryonic kidney cell line (HEK293T). GlycoRNA fluorescent signals were detected in all cell lines (Extended Data Fig. 3c). The presence of glycoRNA was also verified by RNA blotting (Extended Data Fig. 3d-f). These results demonstrate that ARPLA can be applied to visualize glycoRNAs with various RNA sequences across different cell lines.
Visualizing glycoRNA spatial distributions with ARPLA
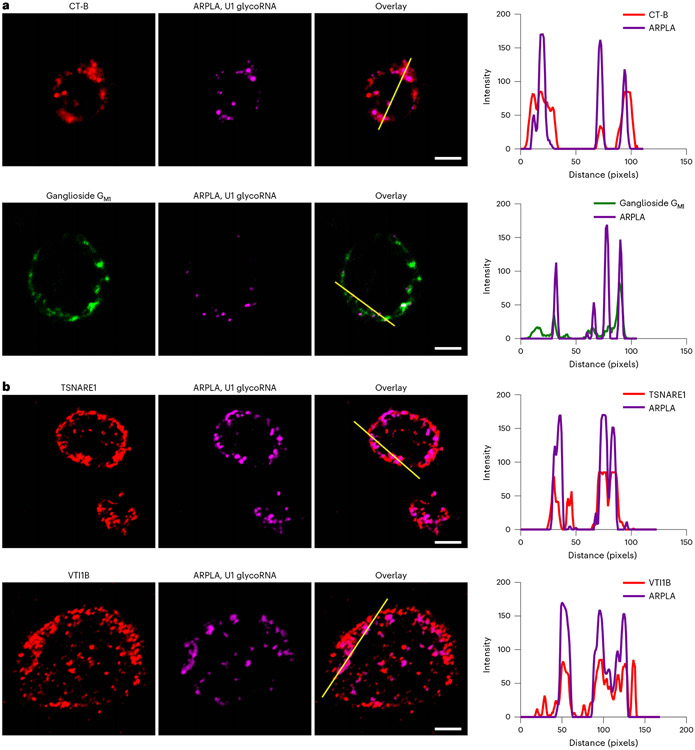
GlycoRNAs have been reported to be present on plasma membranes2, but their detailed spatial distributions remain unknown, as the lateral heterogeneity of plasma membranes featuresvarious distinct subcompartments40. For example, lipid rafts, which are ordered and tightly packed microdomains in cell membranes40, are often enriched with saturated phospholipids, sphingolipids, cholesterol, lipidated proteins and glycosylated biomolecules, such as glycolipids and glycosylphosphatidylinositol-anchored proteins40. Consequently, it is important to determine whether glycoRNAs are associated with lipid rafts and, if so, their distribution patterns. To achieve this goal, we used ARPLA to investigate distributions of glycoRNAs and lipid rafts through fluorescence imaging. We stained lipid rafts with Alexa Fluor 555-labeled cholera toxin subunit B (CT-B) or BODIPY dye-labeled ganglioside GM1 separately. As shown in Fig. 3a and Extended Data Fig. 4, lipid rafts were densely distributed in the plasma membranes of human promyelocytic leukemia (HL-60) cells, and glycoRNA signals displayed clear colocalization with lipid rafts. The Pearson’s coefficient between ARPLA and CT-B was calculated to be 0.572 ± 0.130. To determine the percentage of ARPLA signals that overlap with CT-B, we further calculated Manders’ overlap coefficient, which describes the degree of overlap between two channels41, demonstrating that 65.2% ± 18% of ARPLA signals overlapped with CT-B signals, and 40% ± 19% of CT-B signals overlapped with ARPLA signals. Similarly, the Pearson’s coefficient between ARPLA and GM1 was 0.539 ± 0.163. Based on Manders’ overlap coefficient, 79.5% ± 14.8% of ARPLA signals overlapped with GM1 signals, and 31.7% ± 13.8% of GM1 signals overlapped with ARPLA signals. In addition, we performed z-stack imaging to investigate glycoRNAs on the cell surface using U1 glycoRNA (green) and CT-B (red) as a proof of concept. U1 glycoRNA clearly colocalized with lipid rafts, as demonstrated by images in z-slice format (Extended Data Fig. 4a), orthographic projection (Extended Data Fig. 4b) and maximum intensity projection (Extended Data Fig. 4c). To confirm this colocalization, we isolated RNAs from the cytosol, crude membrane, lipid rafts and non-lipid rafts separately and performed RNA blotting. GlycoRNAs from lipid rafts displayed a similar intensity to those from crude membranes, and the signal was significantly higher than the signals from non-lipid raft membranes and the cytosol (Supplementary Fig. 2). Therefore, the colocalization of ARPLA signals with CT-B signals and ganglioside GM1 signals as well as the RNA blotting results suggest the spatial distribution of glycoRNAs on lipid rafts.
Fig. 3 ∣. Spatial distributions of glycoRNAs revealed by ARPLA in HL-60 cells.
a, Representative fluorescence imaging of lipid rafts, indicated by Alexa Fluor 555-labeled CT-B (top) or BODIPY dye-labeled sphingolipids (bottom), and glycoRNAs, imaged by ARPLA with U1 probe. The overlay images and plot profiles display the colocalization between glycoRNAs and lipid rafts; Pearson’s coefficients: r = 0.572 ± 0.130 (CT-B) and r = 0.539 ± 0.163 (BODIPY); scale bar, 5 μm. The intensities of different fluorochromes along the yellow lane in the overlay images are shown in the histograms on the right. b, Representative immunofluorescence images of t-SNARE (top) and v-SNARE (bottom) with glycoRNAs, indicating the intracellular trafficking of glycoRNAs. The overlay images and plot profiles show colocalization between glycoRNAs and t-SNARE (Pearson’s coefficient; r = 0.70) or v-SNARE (Pearson’s coefficient: r = 0.58); scale bar, 5 μm. The intensities of different fluorochromes along the yellow line in the merged images are shown in the histograms on the right. All experiments were repeated three times independently with similar results.
After visualizing the distribution of glycoRNAs on the cell surface, we further used ARPLA to monitor the intracellular trafficking of glycoRNAs. Soluble SNAREs play important roles in fusing cell membranes, docking vesicles to target compartments and mediating the fusion of the opposing membranes42. We hypothesize that glycoRNAs are associated with SNAREs, which may depict the intracellular trafficking and secretory exocytosis process of glycoRNAs. To test this hypothesis, we used ARPLA to image intracellular glycoRNAs after cell membrane permeabilization and stained SNAREs with antibodies. As shown in Fig. 3b, glycoRNAs were found to colocalize with target SNARE (t-SNARE; TSNARE1) and vesicle SNARE (v-SNARE; VTI1b), which are associated with the target compartments and vesicles, respectively42. These results suggest that glycoRNAs are presented on the cell surfaces through SNARE-mediated vesicle exocytosis and membrane fusion.
Visualization of glycoRNAs in breast cancer transformation
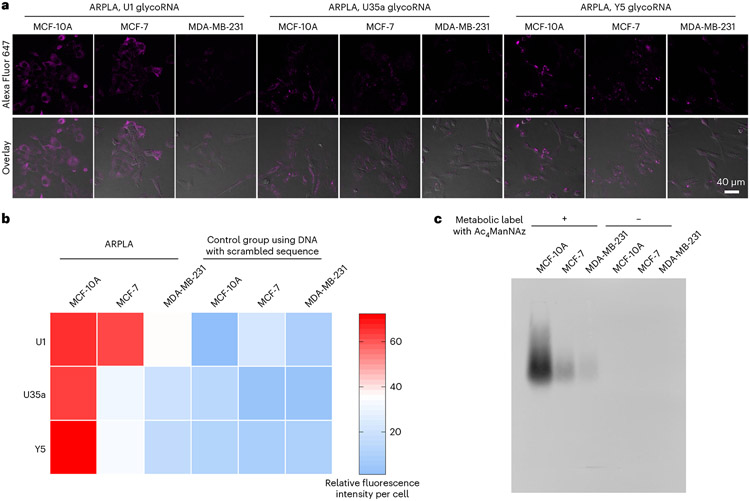
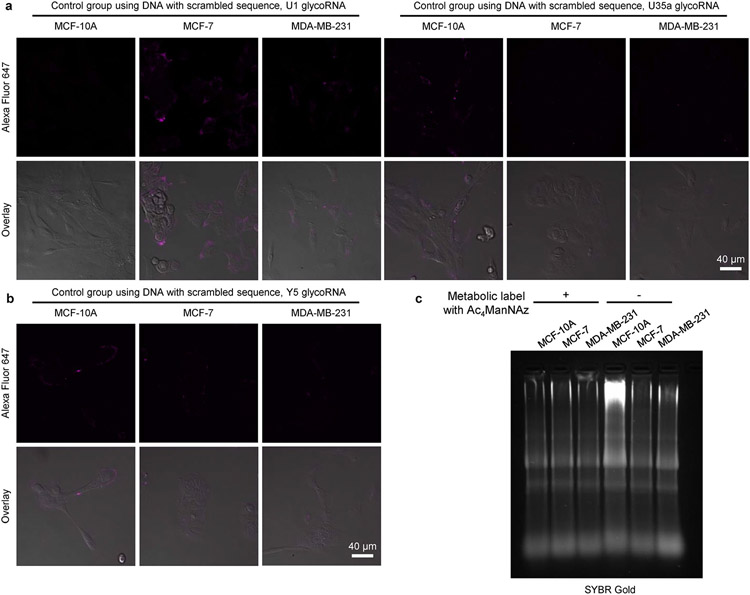
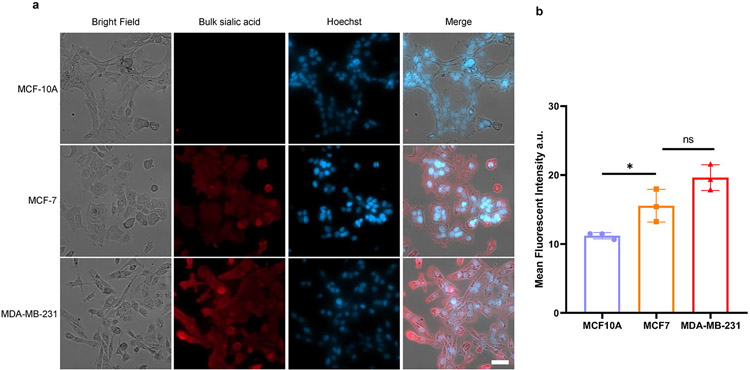
To demonstrate the wide application of ARPLA, we explored its application in visualizing glycoRNAs in malignant transformation, as altered glycosylation is a hallmark of malignant transformation43-46. For instance, the progression of breast cancer from normal cells to non-invasive carcinomas and metastases is linked to glycosylation changes in glycoproteins on the cell surface and in the extracellular matrix43,47,48; however, the relationship between glycoRNAs and cancer progression remains unclear. To address this issue, we chose non-tumorigenic (MCF-10A), malignant (MCF-7) and metastatic (MDA-MB-231) breast cancer cell lines as representative models for different tumoral statuses to study the relationship between glycoRNAs and breast cancer progression. Control experiments using sequence-scrambled DNA to replace the Neu5Ac aptamer displayed weak fluorescent signals in all breast cancer cell lines (Extended Data Fig. 5a,b). By contrast, using ARPLA with the correct aptamer to target different glycoRNAs showed the strongest fluorescent signals from U1, U35a and Y5 glycoRNAs in the non-malignant cell line MCF-10A, followed by the malignant cell line MCF-7, while the metastatic cell line MDA-MB-231 showed the weakest fluorescent signals (Fig. 4a,b and Supplementary Fig. 3), suggesting that surface glycoRNA has an inverse association with tumor malignance and metastasis. The effects on these breast cancer cells could be associated and not a causation of a phenotype. While a similar trend was observed in RNA blotting of total glycoRNAs (Fig. 4c and Extended Data Fig. 5c), ARPLA offers advantages, such as shorter processing time (4 h versus RNA blotting, which requires 24-48 h for metabolic labeling and ~5 h for RNA blotting), spatial distribution visualization and the customizability to visualize glycoRNAs with desired sequences. Moreover, the abundance of bulk sialic acid on the cell surfaces of MCF-10A, MCF-7 and MDA-MB-231 cell lines was assessed by metabolic labeling with Ac4ManNAz, click chemistry labeling and imaging. Significantly higher bulk sialic acid signals were found in MDA-MB-231 and MCF-7 cell lines than in the MCF-10A cell line, which agrees with the known correlation of hypersialylation in cancer45 (Extended Data Fig. 6).
Fig. 4 ∣. Visualization of glycoRNAs in malignant transformation using ARPLA.
a, CLSM images of U1, U35a and Y5 glycoRNAs by ARPLA in MCF-10A, MCF-7 and MDA-MB-231 cells. b, Heat map and quantitative analysis of relative fluorescence intensity in a and Extended Data Fig. 7a,b; n = 3 biological replicates. c, Total glycoRNA expression levels in MCF-10A, MCF-7 and MDA-MB-231 cells evaluated by RNA blotting. GlycoRNAs were metabolically labeled by Ac4ManNAz. The cell imaging experiments and RNA blotting assays were repeated three times independently with similar results.
GlycoRNA changes in immune cell differentiation and immune responses
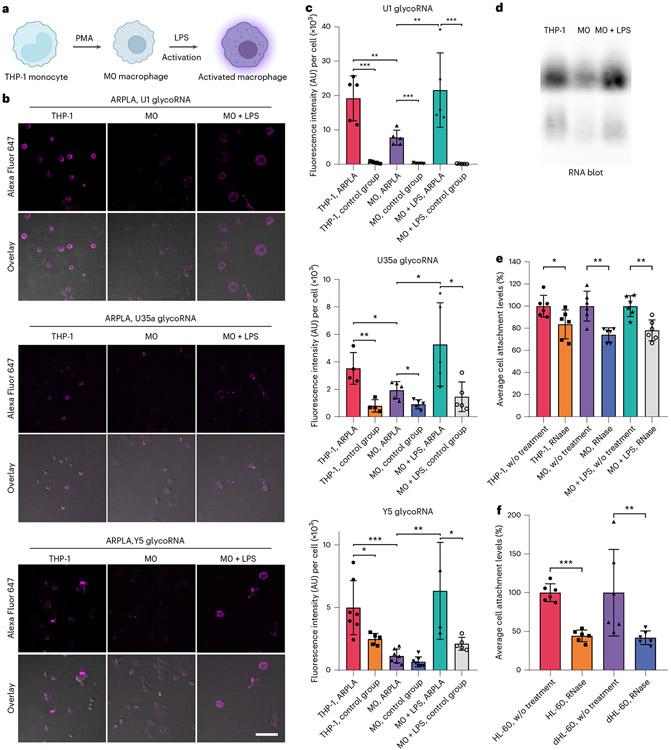
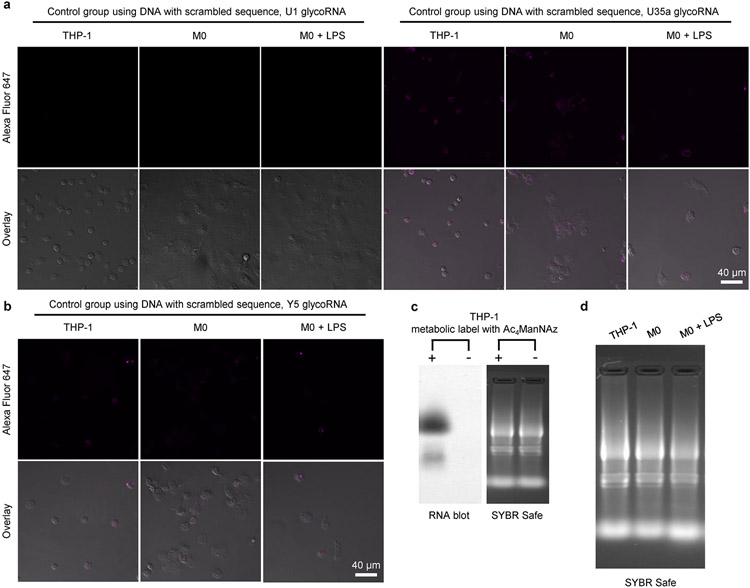
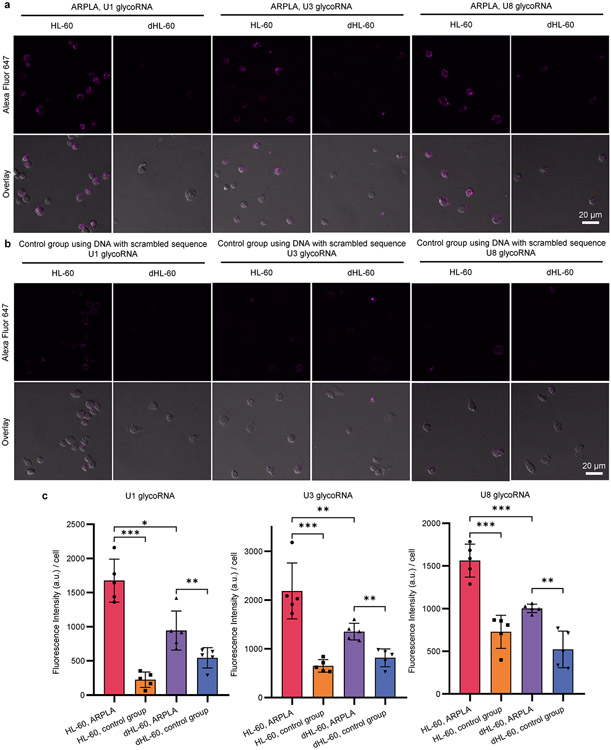
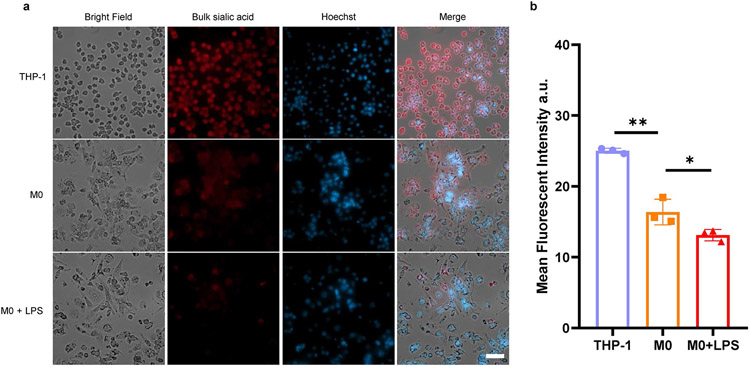
To demonstrate the versatility of ARPLA in other systems, we applied it to image glycoRNAs in innate immune cell differentiation and immune responses. Glycosylation is essential for immune cell development and function49-51, such as in neutrophils and macrophages, which exhibit timed expression of glycosylated granules52. Although previous studies revealed that membrane-associated extracellular RNAs function in mediating monocyte activities39, the roles of glycoRNAs in innate immune cell differentiation and activation are not well understood. To determine their potential roles, we investigated glycoRNA levels during THP-1 monocyte differentiation to resting (M0) macrophages using phorbol 12-myristate 13-acetate (PMA). M0 macrophages showed decreased U1, U35a and Y5 glycoRNA signals than THP-1 monocytes (Fig. 5a-c and Extended Data Fig. 7a,b). A similar trend was found by RNA blotting (Fig. 5d and Extended Data Fig. 7c,d). Moreover, a similar trend was observed in the HL-60 neutrophil model. After differentiation, mature neutrophils showed a lower glycoRNA level than original HL-60 cells (Extended Data Fig. 8 and Supplementary Fig. 4). To gain more insights into the role of glycoRNAs in innate immunity, we assessed glycoRNA changes after pathogenic stimulation. Activated M0 macrophages, stimulated by Escherichia coli-derived lipopolysaccharide (LPS), showed increases in U1, U35a and Y5 glycoRNA signals compared to M0 macrophages (Fig. 5b,c and Extended Data Fig. 7a,b). Similar trends in overall glycoRNA levels were observed by RNA blotting (Fig. 5d and Extended Data Fig. 7c,d). In addition, the abundance of bulk sialic acid on the cell surface was reduced in M0 and activated M0 macrophages compared to in THP-1 cells (Extended Data Fig. 9). These results demonstrate that glycoRNAs change substantially during immune cell differentiation and activation, implicating their potential roles in innate immune responses.
Fig. 5 ∣. Visualization of glycoRNA levels during THP-1 differentiation and activation by LPS.
a, Schematic of the differentiation and activation processes in THP-1 cells. b, CLSM images of U1, U35a and Y5 glycoRNA levels investigated by ARPLA in THP-1 monocytes, M0 macrophages and M0 macrophages activated by LPS; scale bar, 40 μm. c, Quantification analysis of fluorescence intensity (AU) per cell in b and Extended Data Fig. 10a,b; n = 5 frames; ***P < 0.001; top (U1 glycoRNA): PTHP-1 ARPLA, M0 ARPLA = 0.0060, PM0 ARPLA, M0 + LPS ARPLA = 0.0079; middle (U35a glycoRNA): PTHP-1 ARPLA, M0 ARPLA = 0.0321, PM0 ARPLA, M0 + LPS ARPLA = 0.0427; bottom (Y glycoRNA): PTHP-1 ARPLA, M0 ARPLA = 0.0006, PM0 ARPLA, M0 + LPS ARPLA = 0.0055. d, RNA blot of the total glycoRNA levels in THP-1 monocytes, M0 macrophages and M0 macrophages activated by LPS. e,f, Cell attachment levels in THP-1 models (e) and HL-60 models (f) after RNase treatment (normalized to the untreated control group). Data are representative of three independent experiments with n = 6 technical replicates. In e, PTHP1 = 0.0336, PM0 = 0.0017 and PM0 + LPS = 0.0024. In f, PHL-60 < 0.0001 and PdHL-60 = 0.0043. Data are shown as mean ± s.d. and were analyzed by unpaired two-tailed Student’s t-test; *P < 0.05; **P < 0.01; ***P < 0.001.
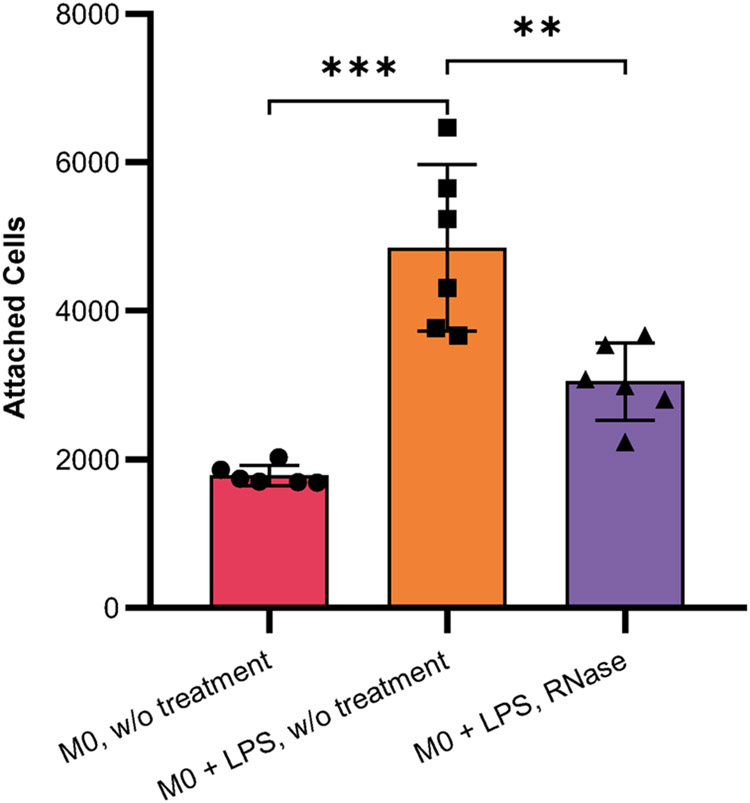
Inspired by the observed fluctuation of glycoRNA levels during immune cell differentiation and activation, we hypothesized that glycoRNAs may contribute to inflammatory responses. To test this hypothesis, we examined the potential impact of glycoRNAs on the cellular functions of THP-1 monocytes and macrophages. Monocyte–EC (M–EC) interaction is an essential event in inflammatory responses that is critical for monocyte migration from the bloodstream to inflammatory tissues, and this process is highly regulated by glycoproteins53. We adapted an M–EC adhesion assay to investigate the roles of glycoRNAs in M–EC interactions by comparing the attachment ability of immune cells to that of RNase-treated cells54. We assessed the binding ability of THP-1, M0 macrophages and LPS-activated M0 macrophages to human umbilical vein ECs (HUVECs). As shown in Fig. 5e, RNase treatment reduced attachment abilities of THP-1, M0 macrophages and LPS-activated M0 macrophages to 84%, 74% and 78%, respectively, compared to untreated cells. Consistent with the higher ARPLA signals after LPS activation, LPS-activated M0 macrophages exhibited enhanced binding efficiency to HUVEC cells compared to M0 macrophages, which was reversed by RNase digestion (Extended Data Fig. 10). Similarly, HL-60 and dHL-60 cells also showed similar reductions after RNase digestion (Fig. 5f). These findings indicate that removal of glycoRNAs is associated with attenuation in immune cell attachment to ECs, suggesting a potential role of glycoRNAs in mediating M–EC interactions during inflammatory processes. Further studies are necessary to fully elucidate these roles.
Discussion
In this work, we developed an imaging method called ARPLA to visualize glycoRNAs on cell surfaces. ARPLA uses a sialic acid aptamer and an in situ hybridization probe for dual recognition of the glycan and RNA portions of glycoRNAs, respectively, followed by proximity ligation to generate intact circular DNA, which then serves as the template for RCA to produce ssDNA. The ssDNA can hybridize with numerous copies of fluorophore-labeled reporter DNA to visualize glycoRNAs with amplified signals. Consequently, ARPLA can reveal spatial distributions of glycoRNAs (Fig. 3) and indicate the relative abundance of glycoRNAs in different cells (Figs. 4 and 5). ARPLA has several advantages: (1) the fluorescent signals from RCA amplification are strong and discrete24, enabling the study of glycoRNA spatial distribution with high sensitivity, which other methods cannot provide; (2) ARPLA allows imaging of native, unlabeled glycoRNAs in various types of samples without pretreatment, such as metabolic labeling; (3) by using two affinity probes, ARPLA can achieve high specificity for glycoRNAs instead of the glycan alone, RNA alone or glycan and RNA that are far apart and (4) by replacing the RNA recognition sequence of the ARPLA probe to target different glycoRNAs, ARPLA is versatile and customizable to detect and image almost any glycoRNA.
After validating the performance of ARPLA in HeLa cells, we applied it to investigate the spatial distribution and intracellular trafficking of glycoRNAs. We revealed colocalization of glycoRNAs with lipid rafts on plasma membranes and observed the cellular tracking of glycoRNAs through SNARE-mediated secretory exocytosis. We further investigated glycoRNA abundance in breast cancer cell models and revealed surface glycoRNA differences in cancer progression. Specifically, compared to non-carcinomatous cells (MCF-10A), malignant breast cancer cells (MCF-7) have a much lower glycoRNA abundance, and metastatic breast cancer cells (MDA-MB-231) have the lowest glycoRNA signals. These results suggest an inverse association between cell surface glycoRNAs and breast tumor malignancy. Furthermore, we used ARPLA to monitor glycoRNA levels during innate immune cell differentiation and activation, uncovering a reduction during immune cell differentiation and an increase during LPS-induced inflammatory responses. This observation led us to discover the relationship between glycoRNAs and attenuation in immune cell attachment to ECs, indicating a potential role of glycoRNAs in mediating M–EC interactions during the inflammatory process.
This work demonstrates that ARPLA can visualize glycoRNAs with high sensitivity and selectivity. Together with other biological and bioinformatic tools55, ARPLA will facilitate investigation of the roles of glycoRNAs in various models. In the future, ARPLA can be adapted to detect other biomolecules, such as other modified RNAs, modified DNAs and glycoproteins, by replacing the recognition probes for glycoRNAs with corresponding probes for these biomolecules.
The present version of ARPLA has some limitations that could be improved through further optimization. For example, although the signals are clearly above the signals from the background and negative controls, overall intensity is still weak, probably due to low expression levels of target glycoRNAs. As a result, the effects of glycoRNAs we observed on breast cancer and immune cell models are modest and may not work well in other systems. To increase the sensitivity, fluorescent light-up aptamers can be incorporated into the RCA. Furthermore, ARPLA provides a semiquantitative analysis of spatial distributions and relative abundance of glycoRNAs. The resolution limitation of the current method using a Zeiss 710 confocal microscope was estimated to be ~300 nm (Supplementary Fig. 5). To perform a more quantitative analysis, such as determining copy numbers of glycoRNAs per cell, superresolution imaging technology combined with two-fluorophore-based fluorescence resonance energy transfer can be used. Finally, ARPLA uses an RNA hybridization step to recognize specific glycoRNAs, which requires the sequence information of glycoRNAs and is therefore not suitable for glycoRNAs with unknown sequences. There is a need to develop an imaging method for glycoRNAs with unknown sequences by using other general RNA recognition reagents56,57.
Methods
Materials
Sodium chloride, magnesium chloride, calcium chloride, ethylenediaminetetraacetic acid disodium salt dihydrate, 2-mercaptoethanol, glycerol, NGI-1, kifunensine, swainsonine, chloroform, dibenzocyclooctyne-PEG4-biotin (DBCO-biotin) and Tween-20 were purchased from Sigma-Aldrich. Acid Blue 9 (AB9) and a Minute plasma membrane-derived lipid raft isolation kit were purchased from Fisher Scientific. Ac4ManNAz was purchased from Click Chemistry Tools. Neu5Ac was purchased from Cayman Chemical. Bovine serum albumin (BSA), phi29 DNA polymerase, dNTP, T4 DNA ligase, ATP, proteinase K, α2-3,6,8,9-neuraminidase A, PNGase-F and O-glycosidase were purchased from New England BioLabs (NEB). TRIzol, RNase A, RNase T1, formamide, HBSS and CellTracker Orange CMRA were purchased from Thermo Fisher Scientific. RNA Clean and Concentrator 5 kits were purchased from Zymo Research. Intercept (PBS) blocking buffer and IRDye 800CW streptavidin were purchased from Li-Cor Biosciences. The 0.45-μm nitrocellulose (NC) membrane was purchased from Cytiva Life Sciences. All the oligonucleotide sequences were purchased from Integrated DNA Technologies and were purified by high-performance liquid chromatography or polyacrylamide gel electrophoresis and confirmed by mass spectrometry (Supplementary Table 1). All other reagents and solvents were obtained from the domestic suppliers and were used as received.
MD simulations of the structure of the ARPLA system
To computationally predict the structure of the ARPLA system, we did MD simulations with the coarse-grained model of nucleic acids using oxDNA. The simulation object consists of the glycan probe, the RNA-binding probe (here, the Y5 glycoRNA-binding probe) and connector 1 and connector 2 (Extended Data Fig. 1) to simulate the structure of the ARPLA system. The coarse-grained models with oxDNA were chosen to simulate the system under the consideration of accuracy and computational efficiency. Such a model has been used to simulate the structural, mechanical and thermodynamic properties of single- and double-stranded nucleic acids and has obtained good agreement with experimental data, and the method can accomplish a sufficient simulation time scale with approachable computational force58,59.
The model was designed in oxView60, while the secondary structure of the Neu5Ac aptamer was predicted via RNAfold and was converted to a three-dimensional structure via RNAComposer36, which was then converted to oxDNA topology and configuration files using tacoxDNA. The simulations were conducted in the oxDNA program using standard procedures at 37 °C and a 1.5-μs time scale. Mutual traps were applied to several sites in the Neu5Ac aptamer to maintain its predicted structure. A complementary strand of the RISH site was also added to maintain the hybrid configuration of the RISH site.
ITC
To study the Kd between Neu5Ac and its aptamer, ITC was performed using a VP-ITC microcalorimeter instrument (MicroCal). Neu5Ac and aptamer were dissolved in 1× aptamer binding buffer (50 mM Tris-HCl, 5 mM KCl, 100 mM NaCl and 1 mM MgCl2, pH 7.4), respectively. Before ITC analysis, the pH of Neu5Ac and aptamer solutions were carefully titrated to pH 7.4, which was very important for successful ITC analysis. The solution of Neu5Ac and its aptamer were degassed for 10 min before subjecting them to ITC. Neu5Ac aptamer (20 μM) was loaded in the cell, and 1 mM Neu5Ac in the same buffer was loaded into the syringe. After the first injection of 2 μl, the syringe injected 10 μl of Neu5Ac into the cell each time. Through measuring the heat changes and fitting the titration curves to a one-site binding model, thermodynamic data, including Kd, enthalpy change, entropy change, free energy change and binding stoichiometry, were obtained. The molar ratio was calculated from the ITC data based on the Neu5Ac/aptamer concentrations.
Cell culture
MDA-MB-231 cells were a gift from A. Baker (The University of Texas at Austin). The SH-SY5Y cell line was obtained from L. Mirica (University of Illinois Urbana–Champaign). The THP-1 cell line was obtained from J. Chan (University of Illinois Urbana–Champaign). All other cell lines were purchased from ATCC, the Cancer Center at Illinois (University of Illinois Urbana–Champaign) or PromoCell and were cultured at 37 °C in a humidified incubator with 5% CO2.
HeLa (CCL-2, ATCC), HEK293T (CRL-3216, ATCC) and PANC-1 (CRL-1469, ATCC) cell lines were cultured in DMEM supplemented with 10% fetal bovine serum (FBS; GeminiBio), 100 U ml−1 penicillin and 100 U ml−1 streptomycin. SH-SY5Y cells were cultured in a 1:1 mixture of EMEM and Ham’s F12 medium supplemented with 10% FBS and 100 U ml−1 penicillin and streptomycin.
The non-tumorigenic breast cell line MCF-10A was cultured in 1:1 DMEM/F12 supplemented with 5% horse serum, 20 ng ml−1 epidermal growth factor, 0.5 μg ml−1 hydrocortisone, 10 μg ml−1 insulin and 100 U ml−1 penicillin/streptomycin. Breast cancer cell lines (malignant MCF-7 cells and metastatic MDA-MB-231 cells) were cultured in DMEM with 100 U ml−1 penicillin, 100 U ml−1 streptomycin, 1× non-essential amino acids (NEAA) and 10% FBS.
The human monocyte cell line THP-1 was cultured in RPMI-1640 medium supplemented with 2.5 mM glutamine, 1× MEM NEAA and 10% heat-inactivated FBS. To differentiate THP-1 cells into macrophage-like cells, cells were treated with 250 nM PMA in 10% FBS culture medium for 24 h and treated with RPMI-1640 medium containing 5% FBS for another 2 d (ref. 61). To activate M0 macrophages, macrophages were incubated with 5% FBS RPMI-1640 medium containing 12.5 μg ml−1 LPS overnight.
The human promyelocytic leukemia cell line HL-60 was cultured in growth medium consisting of Iscove’s modified Dulbecco’s medium (Corning) supplemented with 20% FBS, 1× GlutaMAX and 1× MEM NEAA. The cells were differentiated into neutrophil-like cells (dHL-60) with a 5-d treatment of 1.3% DMSO (Sigma) in growth medium62,63.
HUVECs (C-12203 pooled donor) were purchased from PromoCell and cultured in endothelial cell media 2 (PromoCell). For the subculture of HUVECs, 2 μg cm−2 human plasma fibronectin (EMD Millipore) was applied to culture flasks and incubated for 2 h.
Blotting analysis of Ac4ManNAz-labeled RNA
GlycoRNAs of HeLa cells and other cell lines were verified by metabolic labeling with Ac4ManNAz, followed by RNA blotting to confirm the presence of glycoRNAs as described in a previous report2. Briefly, after metabolic labeling, the total RNA was extracted, stripped of protein contamination via proteinase K digestion and cleaned with silica columns. The purified RNA was then labeled with DBCO-biotin via biorthogonal click chemistry and subsequently analyzed by denaturing gel electrophoresis and RNA blotting. As shown in Extended Data Fig. 2c, the total RNA extracted from metabolically labeled HeLa cells possesses biotinylated species. By contrast, for HeLa cells without metabolic labeling treatment, total RNA was also extracted and incubated with Ac4ManNAz in a test tube, and no detectable signal was observed (Extended Data Fig. 2c). Therefore, Ac4ManNAz was metabolically incorporated into a glycan moiety of glycoRNA, demonstrating the presence of glycoRNAs in HeLa cells.
Metabolic labeling.
For the RNA blotting experiments and metabolic labeling, cells were seeded in Petri dishes, cultured for 24 h and treated with 100 μM Ac4ManNAz in cell culture medium for 48 h.
RNA extraction and purification.
RNA extraction and purification were performed according to a previously reported method2. Cells were first treated with 2 ml of TRIzol reagent and incubated at 37 °C to denature non-covalent interactions. Phase separation was then performed by adding 0.4 ml of chloroform, vortexing, incubating for 5 min and centrifuging at 12,000g at 4 °C for 15 min. The RNA in the aqueous phase was carefully transferred to a fresh tube and purified using a Zymo RNA Clean and Concentrator 5 kit from Zymo Research. Thereafter, to avoid protein contamination, the obtained RNA was subjected to protein digestion by adding 1 μg of proteinase K to 25 μg of purified RNA in 30 mM Tris-HCl (pH 8.0) and incubated at 37 °C for 45 min. To remove the proteinase K, the RNA was purified again with an RNA Clean and Concentrator 5 kit and stored at −80 °C for future use.
GlycoRNAs from the cytosol, crude membranes, lipid raft and non-lipid raft membranes were isolated by using a non-ionic detergent-containing kit, the Minute plasma membrane-derived lipid raft isolation kit. The cytosol, crude membranes, lipid raft and non-lipid raft membranes were isolated following the manufacturer’s instructions. Thereafter, the glycoRNAs from different cell fractions were isolated with TRIzol reagent and purified with a Zymo RNA Clean and Concentrator 5 kit.
Copper-free click conjugation to Ac4ManNAz-labeled RNA.
Ac4ManNAz-labeled RNA (50 μl) extracted from the cells was mixed with 47.5 μl of RNA denature buffer (95% formamide, 18 mM EDTA and 0.025% SDS) and 2.5 μl of 20 mM DBCO-biotin. Conjugation was performed at 55 °C for 10 min in a Thermomixer. Biotin-labeled RNA was then purified with a Zymo RNA Clean and Concentrator 5 kit.
RNA gel electrophoresis, blotting and imaging.
The blotting analysis of biotin-labeled RNA was performed according to a previously reported method2. Biotin-labeled RNA was lyophilized dry, subsequently resuspended in 15 μl of RNA denature buffer, incubated at 55 °C for 10 min and cooled down on ice. Thereafter, 10 μg of RNA was loaded into 1% agarose-formaldehyde denaturing gels, electrophoresed at 110 V for 1 h at 4 °C and visualized after SYBR Safe staining. The RNA sample was transferred to a 0.45-μm NC membrane at 20 V for 30 min at 4 °C. Afterward, the RNA sample was cross-linked to the NC membrane with UV cross-linker (Fisher Scientific) for 5 min. The NC membrane was then blocked with Intercept (PBS) blocking buffer at 25 °C for 45 min and stained with IRDye 800CW streptavidin in Intercept (PBS) blocking buffer (1:10,000 dilution) at 25 °C for 30 min. The NC membrane was then washed with 1× PBS containing 0.1% Tween-20 three times and 1× PBS once. The NC membrane was then scanned with an Odyssey Li-Cor CLx scanner (Li-Cor Biosciences) with the software set to autodetect the signal intensity for the 800 channels.
In situ imaging of glycoRNA with ARPLA
Surface RISH.
HeLa, HEK293T, SH-SY5Y, PANC-1, MCF-10A, MCF-7 and MDA-MB-231 cells were seeded on glass-bottom 35-mm imaging dishes (MetTek) at a density of 2 × 10⁵ cells per well. HL-60 cells, dHL-60 cells, THP-1 cells, M0 macrophages and activated M0 macrophages were seeded on the same day at a density of 1 × 10⁶ cells per well and allowed to attach in serum-free RPMI-1640 for 30 min before treatment.
All the cell samples were washed three times with PBS without Mg2+ and Ca2+ before each step. Cells were first fixed with 4% paraformaldehyde (PFA) at 37 °C for 15 min. To block nonspecific interactions, cells were blocked with 100 nM poly(T) oligonucleotides and 0.25 μg μl−1 BSA in 1× hybridization buffer (50 mM Tris-HCl buffer and 10 mM MgCl2, pH 7.4) at 37 °C for 30 min. Note that no permeabilization was performed. Thereafter, the cells were incubated with 1.5 μM RNA-binding probe, 0.25 μg μl−1 BSA, 250 mM NaCl and 1× hybridization buffer at 37 °C for 30 min. After surface RISH, the cells were subsequently washed three times in FISH washing buffer (2× SSC and 10% formamide) for 10 min each time, followed by three washes in PBS to remove residual formamide.
Aptamer recognition of Neu5Ac in glycoRNAs and proximity-assisted in situ ligation.
Cells were incubated with 100 μl of aptamer and connector solution containing 100 nM Neu5Ac aptamer, 0.25 μg μl−1 BSA, 100 nM poly(T) oligonucleotides, 125 nM connector 1, 125 nM connector 2 and 1× aptamer binding buffer (50 mM Tris-HCl, 5 mM KCl, 100 mM NaCl and 1 mM MgCl2, pH 7.4). The cells were incubated with this solution at 37 °C for 30 min, ensuring aptamer binding to Neu5Ac on glycoRNAs and assisting the hybridization of connectors 1 and 2.
Thereafter, the ligation mixture was added to the aptamer and connector solution in the cell dish and mixed well by pipetting. The final solution contained 1 U μl−1 T4 DNA ligase, 1 mM ATP and 1× T4 DNA ligase reaction buffer provided by NEB.
In situ RCA reaction.
The in situ RCA reaction was performed with RCA working solution at 37 °C for 90 min, which contains 2.5 U μl−1 phi29 DNA polymerase, 0.25 mM dNTP, 0.2 μg μl−1 BSA, 5% glycerol and 1× phi29 DNA polymerase reaction buffer provided by NEB. The single-stranded RCA products were detected by in situ hybridization with 100 nM reporter in 2× SSC buffer, 0.25 μg μl−1 BSA and 100 nM poly(T) oligonucleotides at 37 °C for 30 min. From this step onward, the slide was kept in the dark. The slides were mounted with mounting medium, and images were acquired with a confocal microscope.
Microscopy and image analysis.
Images in Figs. 2-5 and Extended Data Figs. 2, 3, 5, 7 and 8 were acquired on a Nikon W1 spinning-disk microscope. To accomplish the imaging, a ×60 water immersion objective was applied, and the fluorophore was excited with a 640-nm laser and Cy5 filter (emission of 672–712 nm). The images were taken with monochromatic Andor EMCCD cameras and were processed using ImageJ (Fiji). The images in Fig. 3 were acquired with a ×100 oil immersion objective to obtain the subcellular distribution of glycoRNAs. Amplicons with a bright fluorescent signal were distinguished from the background by adjusting the threshold. The average fluorescence intensity of all cells in each frame was calculated by ImageJ (Fiji). More than five frames of each imaging group were processed for further statistical analysis, and more than three biological replicates were performed and validated, showing similar trends. In Fig. 3, the relative fluorescence intensity was calculated by comparing the signal from each group to that of the group showing the highest signal. Supplementary Fig. 5 and z-stack images in Extended Data Fig. 4 were collected by CLSM on a Zeiss 710 (×63 oil immersion objective; laser line excitation/emission of 561 nm/566–651 nm and 633 nm/638–755 nm). Twenty-two slices (in total, 10.421 μm) were collected with Zen 3.2, and the images were processed with Zen 3.6 (blue edition). The images in Extended Data Figs. 6 and 9 were collected with a Zeiss Observer 7 (Zen 3.1 pro), and the data were processed with Zen 3.6 (blue edition).
Validation of the specificity of ARPLA
To validate the specificity of ARPLA, several treatments were applied to modulate the levels of RNA or glycan moiety of the glycoRNAs and test whether ARPLA can specifically detect glycoRNAs and differentiate them from other cell surface RNAs or glycans. To digest the RNA moiety of glycoRNAs and validate the sensor performance, live cells were incubated with 0.02 μg μl−1 RNase A or 1 U μl−1 RNase T1, respectively, in 100 μl of HBSS at 37 °C for 20 min and fixed and analyzed by ARPLA. As shown in Fig. 2c,d, after RNase A or RNase T1 treatment, the fluorescence signals were reduced to nearly 12% or 10% of that observed in cells without RNase treatment.
Moreover, to verify ARPLA’s response to the glycan moiety of glycoRNA, we used pharmacological and enzymatic methods, respectively, to remove the glycan moiety. In the pharmacological approach, cells were pretreated with (1) 8 μM NGI-1, which is a specific small-molecule inhibitor of oligosaccharyltransferase related to glycoRNA generation64; (2) 2 μM kifunensine, which can inhibit N-glycan processing65; or (3) 40 μM swainsonine, which can perturb N-glycan processing66,67. The stock solutions of glycan biosynthesis inhibitors NGI-1, kifunensine and swainsonine were all made in DMSO at concentrations of 10 mM and stored at −80 °C. Then, 8 μM NGI-1, 2 μM kifunensine or 40 μM swainsonine were incubated with HeLa cells, respectively, for 24 h before the glycoRNA imaging experiment. In the enzymatic method, to digest glycans on the cell surface of live cells, HeLa cells were incubated with PNGase-F, α2-3,6,8,9-neuraminidase A or O-glycosidase at a concentration of 10 U per 100 μl in HBSS at 37 °C for 30 min, respectively. Cells were then analyzed by ARPLA.
Lipid raft staining and immunofluorescence imaging
To label lipid rafts, two lipid raft-specific dyes were used, a Vybrant Alexa Fluor 555 lipid raft labeling kit (Invitrogen) and BODIPY FL C5-ganglioside GM1 (Invitrogen). We followed the product manuals to label lipid rafts before seeding the cells in imaging plates. Briefly, for the Vybrant Alexa Fluor 555 lipid raft labeling kit, we pelleted and washed the cells with prechilled RPMI supplemented with 10% FBS three times and resuspended the cells at the density of 4 × 10⁶ cells per ml. Two microliters of CT-B stock solution (1 mg ml−1) was added to 2 ml of cell solution. The cells were incubated on ice for 15 min and washed twice with prechilled PBS. Thereafter, cells were resuspended in serum-free RPMI and seeded into imaging dishes. After cell adhesion, the cells were fixed with 4% PFA without cell membrane permeabilization and stained with ARPLA. For BODIPY FL C5-ganglioside GM1 staining, cell pellets were washed with prechilled HBSS and resuspended in 2 × 10⁶ cells per 100 μl of 5 μM ganglioside GM1 working solution. The cells were incubated on ice for 30 min, washed with prechilled HBSS three times and resuspended in serum-free RPMI for seeding. After cell adhesion, the cells were fixed and analyzed with ARPLA.
The following antibodies were used to stain SNARE proteins: TSNARE1 polyclonal antibody (Invitrogen), VTI1B polyclonal antibody (Invitrogen) and donkey anti-rabbit IgG (H+L) highly cross-adsorbed secondary antibody (Invitrogen). HL-60 cells were washed twice with serum-free RPMI, resuspended in serum-free RPMI at a density of 1 × 10⁶ cells per ml and seeded into 35-mm glass-bottom confocal imaging dishes. Cells were then fixed with 4% PFA solution at 37 °C for 15 min and incubated with 0.2% Triton X-100 solution for 5 min at room temperature. After washing with PBS, the cells were stained by ARPLA with minor revisions. Before adding the reporter strand, solutions of primary antibody diluted 1:250 (prepared in 1% BSA) were applied to the cells and incubated at 4 °C overnight. After washing cells with PBS five times, we applied solutions of secondary antibody diluted 1:500 (prepared in 1% BSA) to cells and stained at room temperature for 1 h. We washed cells three times, added ARPLA reporter strand, incubated the cells at 37 °C for 30 min, washed them twice with PBS and mounted the cells in mounting solution.
Fluorescence images were taken with a W1 Nikon spinning-disk confocal microscope or a Zeiss 710 confocal microscope. The images were then processed with Nikon NIS Element viewer or Zen 3.6 (blue version). The colocalization assay was performed with Coloc2 and JACoP plug-ins of Fiji (ImageJ). The plot profiles were also analyzed by using Fiji.
Transmission-through-dye image of HeLa cells
The membrane-permeable dye CellTracker Orange CMRA and the membrane-impermeant quencher AB9 were applied to the same cells. Because AB9 cannot enter the cell with an intact membrane and thus cannot quench the dye, the cells with an intact membrane will have bright fluorescent signals from CellTracker Orange CMRA. However, a leaky or damaged membrane after permeabilization treatment allows for the quencher to enter the cell, resulting in reduced or diminished fluorescent signal.
HeLa cells were seeded on glass-bottom 35-mm imaging dishes 1 d before treatment at a density of 0.6 × 10⁶ cells per well. The cells were then stained with CellTracker Orange CMRA at a concentration of 5 μM for 30 min. Afterward, HeLa cells were treated with all the procedures of ARPLA, stained with AB9 at a concentration of 5 mg ml−1 for 30 min and imaged with a confocal microscope. The negative-control cells with broken cell membranes were prepared by permeabilization with 0.1% Triton X-100.
Cell attachment assay
THP-1 cells, M0 macrophages, LPS-activated M0 macrophages, HL-60 cells and dHL-60 cells were stained with CellTracker Orange CMRA (5 μM) for 30 min at 37 °C for live-cell fluorescence tracking. Afterward, cells were washed and resuspended in HBSS at 1 × 10⁶ cells per ml. To digest the RNA on the cell surface of live cells, cells were treated with 0.02 μg μl−1 RNase A and 1 U μl−1 RNase T1 in PBS at 37 °C for 30 min. After incubation, the cells were washed thoroughly in PBS three times and seeded onto a confluent layer of HUVECs in 96-well plates prepared 48–72 h before the experiment. After cell attachment, unattached cells were removed with HBSS washes. Attachment of the fluorescently labeled cells was quantified using a Zeiss Observer 7 fluorescence microscope. The number of attached cells was calculated using ImageJ, which counts cells with a bright fluorescent signal distinguished from the background by adjusting the threshold. The absolute cell number was quantified using particle analysis with parameters of 0.5–15 pixels (ref. 59).
Surface sialic acid imaging
Breast cell lines (MCF-10A, MCF-7 and MDA-MB-231) and THP-1-related cells lines (THP-1, M0 macrophages and LPS-activated M0 macrophages) were cultured as described earlier. To estimate the abundance of bulk sialic acid on the membrane, cells were seeded in Petri dishes and cultured in 100 μM Ac4ManNAz-containing culture medium for 24 h. Cells were washed with PBS once and fixed with 4% PFA solution for 15 min at 37 °C. After three washes with PBS, the cells were incubated in PBS containing 0.5 mM DBCO-PEG4-biotin for 2 h at 37 °C. Thereafter, cells were washed three times with PBS and blocked with 3% BSA solution (PBS) for 1 h at 37 °C. Cy5–streptavidin (Invitrogen, SA1011) and Hoechst 33258 (Invitrogen, H1398) were diluted (1,000×) in 1% BSA and applied to cells for 30 min at room temperature. After washing, images were taken with a Zeiss Observer 7 epifluorescence microscope with a ×40 (air) objective and filter sets (96 HE BFP; 50 Cy5). Cell fluorescence intensity was then quantified with ImageJ.
Data analysis
All experiments were performed with at least three biological replicates. For each individual biological replicate, three technical repeats were performed in cell imaging experiments, and six technical repeats were performed in cell attachment assays. The results of each test are displayed as the mean ± s.d. For comparison of two independent groups, a two-tailed unpaired Student’s t-test was performed. All the statistical calculations and graph making were performed with Origin-Pro 2021b or GraphPad Prism 8. Statistical significance was determined by t-test as not significant, P < 0.05 (*), P < 0.01 (**) and P < 0.001 (***). The schematics in Figs. 1, 2a and 5a and Extended Data Fig. 1a were created with BioRender.com. A BioRender academic license/proof for using these artworks for publication is in place.
Extended Data
Extended Data Fig. 1 ∣. MD simulation of the structure of the ARPLA system.
(a) A representation of the ARPLA system with different sites (site 1-6) chosen to analyze distances; (b) A representative structure from the simulation with oxDNA, including the glycan probe, the RNA binding probe, the connector 1, and the connector 2. The circle of the connector 1 and the connector 2 tends to form a triangle structure, with two sides formed by DNA helix and one side formed by the ssDNA region in the connector 1; (c) The distributions of the distance between interested sites. 3 sets of distances were calculated with oxDNA tool12, including the distances between the edges of the connector 1 ssDNA region (site 1 and site 2), between the ends of spacers of the Glycan probe and the RNA binding probe (site 3 and site 4), and between the predicted glycan binding site4 and the center of the RISH site (site 5 and site 6). The distance between site 1 and site 2 is in the range of 1-14 nm, with an average around 7 nm. The results agree with the B-form DNA length of the connector 1 ssDNA region (43 nt, around 14.3 nm), with the consideration of ssDNA bending and folding. The distance between site 3 and site 4 is in the range of 5-15 nm, with an average around 10 nm. The distance between site 5 and site 6 is in the range of 5-20 nm, with an average around 15 nm.
Extended Data Fig. 2 ∣. Verification of ARPLA method using HeLa as a model cell line.
(a) Thermogram for the ITC titration of 20 μM Neu5Ac aptamer titrated by 1 mM Neu5Ac in aptamer binding buffer; (b) Integrated heat of the ITC titration for Neu5Ac aptamer and Neu5Ac, the black line represents the binding curve fitted with the ‘one set of binding sites’ model; (c) Blotting of total RNA from HeLa cells after metabolic labeling with Ac4ManNAz, or HeLa cells without metabolic labeling; (d) ARPLA-mediated glycoRNA imaging on the surface of HeLa, HL-60, and THP-1 cells. Scale bar: 20 μm (HeLa), 10 μm (HL-60, THP-1); (e) Transmission-through dye microscopic image of HeLa cell. The membrane permeable dye (CellTracker Orange CMRA) and the membrane impermeant quencher acid blue 9 (AB9) were applied to the same cells. AB9 cannot enter the cell with intact membrane and thus cannot quench the membrane permeable dye, so the cells with intact membrane show bright fluorescence signals from CellTracker Orange CMRA. Leaky or damaged membrane after permeabilization treatment allows for the quencher to enter the cell, resulting in reduced or diminished fluorescence of the cell. Scale bar: 40 μm. All experiments were repeated independently three times with similar results.
Extended Data Fig. 3 ∣. Evaluation of the generality of ARPLA.
(a) CLSM images of glycoRNAs, utilizing ARPLA with Glycan probes with Neu5Ac aptamer, Tn antigen aptamer, and GalNAc aptamer; (b) Visualization of glycoRNAs with various RNA sequences, including U3, U8, U35a, and Y5; (c) CLSM images of U1 glycoRNA in different cell lines, such as SH-SY5Y, PANC-1, and HEK293T. Scale bars (b,c): 40 μm; (d) Blotting of total RNA from SH-SY5Y cells after metabolic labeling with Ac4ManNAz, or SH-SY5Y cells without metabolic labeling; (e) Blotting of total RNA from PANC-1 cells after metabolic labeling with Ac4ManNAz, or PANC-1 cells without metabolic labeling; (f) Blotting of total RNA from HEK293T cells after metabolic labeling with Ac4ManNAz, or HEK293T cells without metabolic labeling.
Extended Data Fig. 4 ∣. 3D visualization of the spatial distributions of U1 glycoRNA and CT-B in HL-60 cells.
Z-stack images were collected with the staining of U1 glycoRNA by ARPLA (green) and lipid raft by CT-B (red). The images were shown in z-slices format (a), orthographic projection (b), and maximum intensity projection (c). Scale bar: 2 μm. The z-stack colocalization was repeated independently three times with similar results.
Extended Data Fig. 5 ∣. Visualization of glycoRNAs in malignant transformation using ARPLA, related with Fig. 4.
(a,b) CLSM images of MCF-10A, MCF-7, MDA-MB-231 cells in control groups using DNA with scrambled sequences. (c) Agarose gel electrophoresis image of total RNA from MCF-10A, MCF-7, MDA-MB-231 cells. These cells were treated with Ac4ManNAz for 48 h before RNA extraction. All experiments were repeated independently 3 times with similar results.
Extended Data Fig. 6 ∣. Fluorescence imaging of bulk sialic acid on the cell surface of MCF-10A, MCF-7, and MDA-MB-231 cells.
(a) Representative cell fluorescent images of bulk sialic acid. These cells were metabolically labeled by Ac4ManNAz for 24 h, followed by incubation with DBCO-PEG4-biotin and Cy5-streptavidin for fluorescence imaging. Scale bars for cell image: 50 μm. (b) Bar plot of the mean fluorescent intensities, the data were calculated from 3 biological replicates. The plot is shown in mean ± SD. Unpaired two-tailed Student’s t-test determines the statistical significance as (*) p = 0.0352, (ns) p = 0.0793, n = 3 independent replicates.
Extended Data Fig. 7 ∣. Visualization of glycoRNA level during THP-1 differentiation and activation by LPS, related with Fig. 5.
(a, b) CLSM images of THP-1 monocyte, resting M0 macrophage, and activated M0 macrophage by LPS, which are treated with DNA probe with scrambled sequence to replace aptamer in ARPLA. (c) Blotting of total RNA from THP-1 cells after metabolic labeling with Ac4ManNAz or THP-1 cells without metabolic labeling. (d) Agarose gel electrophoresis image of total RNA from THP-1 monocyte, resting M0 macrophage, and activated M0 macrophage by LPS. These cells were treated with Ac4ManNAz for 48 h before RNA extraction. All experiments were repeated independently three times with similar results.
Extended Data Fig. 8 ∣. Investigation of glycoRNA levels during HL-60 differentiation.
(a) CLSM images of U1, U3, and U8 glycoRNA levels evaluated by ARPLA in HL-60 and dHL-60 cells; (b) CLSM images of HL-60, dHL-60 cells in control groups using DNA with scrambled sequences; (c) Quantitative analysis for relative fluorescence intensity of ARPLA in (a) and (b). Data in (c) are representative of three independent experiments, n = 5 frames. Data are mean ±S.D. The statistical significance is determined by unpaired two-tailed Student’s t-test as (ns) not significant, (*) P < 0.05, (**) P < 0.01, and (***) P < 0.001. P (U1 HL60 vs. dHL60) = 0.0159, P (U3 HL60 vs. dHL60) = 0.0079, P (U8 HL60 vs. dHL60) = 0.0002.
Extended Data Fig. 9 ∣. Fluorescence imaging of bulk sialic acid on the cell surface of THP-1 monocyte, resting M0 macrophage (M0), LPS activated M0 macrophage (M0 + LPS).
(a) Representative images of total sialic acid. These cells were metabolically labeled by Ac4ManNAz for 24 h, followed by incubation with DBCO-PEG4-biotin and Cy5-streptavidin for fluorescence imaging. Scale bars for cell image: 50 μm. (b) Quantification of the mean fluorescent intensity of the images, n = 3 biological replicates. Data are mean ±S.D. Unpaired two-tailed Student’s t-test determines the statistical significance. (**) p = 0.0013, (*) p = 0.0469.
Extended Data Fig. 10 ∣. Cell attachment assay.
The average cell attachment levels in resting M0 macrophage, activated M0 macrophage by LPS, activated M0 macrophage after RNase treatment. Data are representative of three independent experiments, n = 6 technical repeats. Data are mean ±S.D. The statistical significance is determined by unpaired two-tailed Student’s t-test, (***) P < 0.0001, (**) P = 0.0051. Cell attachment assay was performed three times independently with similar results.
Supplementary Material
Acknowledgements
This research was supported by the US National Institutes of Health (GM141931 to Y.L. and GM133658 to S.S.Y.) and the Susan G. Komen Foundation (CCR19609287 to S.S.Y.). Additionally, the Robert A. Welch Foundation (grant F-0020 to Y. L.) supported the Lu group research programs at The University of Texas at Austin. We thank L. M. Mirica and J. Chan at the Department of Chemistry at University of Illinois Urbana-Champaign for providing SH-SY5Y and THP-1 cell lines and A. B. Baker at the Department of Biomedical Engineering at The University of Texas at Austin for providing the MDA-MB-231 cell line. We especially thank B. Belardi at the Department of Chemical Engineering and B. Xhemalce at the Department of Molecular Biosciences at The University of Texas at Austin for manuscript suggestions. Confocal imaging was performed at the Center for Biomedical Research Support Microscopy and Imaging Facility at The University of Texas at Austin (RRID: SCR_021756). We thank A. Webb and P. Oliphint at The University of Texas at Austin for providing advice on confocal imaging. We would like to thank Y. Wu, M. Banik and R. Yang for providing suggestions on the manuscript and for proofreading.
Footnotes
Online content
Any methods, additional references, Nature Portfolio reporting summaries, source data, extended data, supplementary information, acknowledgements, peer review information; details of author contributions and competing interests; and statements of data and code availability are available at https://doi.org/10.1038/s41587-023-01801-z.
Reporting summary
Further information on research design is available in the Nature Portfolio Reporting Summary linked to this article.
Competing interests
The authors declare no competing interests.
Extended data is available for this paper at https://doi.org/10.1038/s41587-023-01801-z.
Supplementary information The online version contains supplementary material available at https://doi.org/10.1038/s41587-023-01801-z.
Data availability
The data generated and analyzed during the current study are available at https://figshare.com/projects/Spatial_Imaging_of_GlycoRNA_in_single_Cells_with_ARPLA/164113. Source data are provided with this paper.
Code availability
The code generated and used for data analysis during the current study are available at https://figshare.com/projects/Spatial_Imaging_of_GlycoRNA_in_single_Cells_with_ARPLA/164113.
References
- 1.Reily C, Stewart TJ, Renfrow MB & Novak J Glycosylation in health and disease. Nat. Rev. Nephrol 15, 346–366 (2019). [DOI] [PMC free article] [PubMed] [Google Scholar]
- 2.Flynn RA et al. Small RNAs are modified with N-glycans and displayed on the surface of living cells. Cell 184, 3109–3124 (2021). [DOI] [PMC free article] [PubMed] [Google Scholar]
- 3.Caldwell RM & Flynn RA Discovering glycoRNA: traditional and non-canonical approaches to studying RNA modifications. Isr. J. Chem 63, e202200059 (2022). [Google Scholar]
- 4.Suzuki T. The expanding world of tRNA modifications and their disease relevance. Nat. Rev. Mol. Cell Biol 22, 375–392 (2021). [DOI] [PubMed] [Google Scholar]
- 5.Tyagi W, Pandey V & Pokharel YR Membrane linked RNA glycosylation as new trend to envision epi-transcriptome epoch. Cancer Gene Ther. 10.1038/s41417-022-00430-z (2022). [DOI] [PubMed] [Google Scholar]
- 6.Helm M & Motorin Y Detecting RNA modifications in the epitranscriptome: predict and validate. Nat. Rev. Genet 18, 275–291 (2017). [DOI] [PubMed] [Google Scholar]
- 7.Li Y. et al. N6-Methyladenosine co-transcriptionally directs the demethylation of histone H3K9me2. Nat. Genet 52, 870–877 (2020). [DOI] [PubMed] [Google Scholar]
- 8.Yu S & Kim VN A tale of non-canonical tails: gene regulation by post-transcriptional RNA tailing. Nat. Rev. Mol. Cell Biol 21, 542–556 (2020). [DOI] [PubMed] [Google Scholar]
- 9.Dunn MR, Jimenez RM & Chaput JC Analysis of aptamer discovery and technology. Nat. Rev. Chem 1, 0076 (2017). [Google Scholar]
- 10.Sunbul M. et al. Super-resolution RNA imaging using a rhodamine-binding aptamer with fast exchange kinetics. Nat. Biotechnol 39, 686–690 (2021). [DOI] [PubMed] [Google Scholar]
- 11.Jou AF, Chou YT, Willner I & Ho JA Imaging of cancer cells and dictated cytotoxicity using aptamer-guided hybridization chain reaction (HCR)-generated G-quadruplex chains. Angew. Chem. Int. Ed. Engl 60, 21673–21678 (2021). [DOI] [PubMed] [Google Scholar]
- 12.Dey SK et al. Repurposing an adenine riboswitch into a fluorogenic imaging and sensing tag. Nat. Chem. Biol 18, 180–190 (2022). [DOI] [PMC free article] [PubMed] [Google Scholar]
- 13.Coonahan ES et al. Structure-switching aptamer sensors for the specific detection of piperaquine and mefloquine. Sci. Transl. Med 13, eabe1535 (2021). [DOI] [PubMed] [Google Scholar]
- 14.Peinetti AS et al. Direct detection of human adenovirus or SARS-CoV-2 with ability to inform infectivity using DNA aptamer-nanopore sensors. Sci. Adv 7, eabh2848 (2021). [DOI] [PMC free article] [PubMed] [Google Scholar]
- 15.Wu L. et al. Aptamer-based detection of circulating targets for precision medicine. Chem. Rev 121, 12035–12105 (2021). [DOI] [PubMed] [Google Scholar]
- 16.Arroyo-Curras N et al. Real-time measurement of small molecules directly in awake, ambulatory animals. Proc. Natl Acad. Sci. USA 114, 645–650 (2017). [DOI] [PMC free article] [PubMed] [Google Scholar]
- 17.Nakatsuka N. et al. Aptamer-field-effect transistors overcome Debye length limitations for small-molecule sensing. Science 362, 319–324 (2018). [DOI] [PMC free article] [PubMed] [Google Scholar]
- 18.Cheung YW et al. Evolution of abiotic cubane chemistries in a nucleic acid aptamer allows selective recognition of a malaria biomarker. Proc. Natl Acad. Sci. USA 117, 16790–16798 (2020). [DOI] [PMC free article] [PubMed] [Google Scholar]
- 19.Zhang Z. et al. High-affinity dimeric aptamers enable the rapid electrochemical detection of wild-type and B.1.1.7 SARS-CoV-2 in unprocessed saliva. Angew. Chem. Int. Ed. Engl 60, 24266–24274 (2021). [DOI] [PMC free article] [PubMed] [Google Scholar]
- 20.Gunaratne R. et al. Combination of aptamer and drug for reversible anticoagulation in cardiopulmonary bypass. Nat. Biotechnol 36, 606–613 (2018). [DOI] [PMC free article] [PubMed] [Google Scholar]
- 21.Valero J. et al. A serum-stable RNA aptamer specific for SARS-CoV-2 neutralizes viral entry. Proc. Natl Acad. Sci. USA 118, e2112942118 (2021). [DOI] [PMC free article] [PubMed] [Google Scholar]
- 22.Zhang Y. et al. Immunotherapy for breast cancer using EpCAM aptamer tumor-targeted gene knockdown. Proc. Natl Acad. Sci. USA 118, e2022830118 (2021). [DOI] [PMC free article] [PubMed] [Google Scholar]
- 23.Schmitz A. et al. A SARS-CoV-2 spike binding DNA aptamer that inhibits pseudovirus infection by an RBD-independent mechanism*. Angew. Chem. Int. Ed. Engl 60, 10279–10285 (2021). [DOI] [PMC free article] [PubMed] [Google Scholar]
- 24.Soderberg O. et al. Direct observation of individual endogenous protein complexes in situ by proximity ligation. Nat. Methods 3, 995–1000 (2006). [DOI] [PubMed] [Google Scholar]
- 25.Tavoosidana G. et al. Multiple recognition assay reveals prostasomes as promising plasma biomarkers for prostate cancer. Proc. Natl Acad. Sci. USA 108, 8809–8814 (2011). [DOI] [PMC free article] [PubMed] [Google Scholar]
- 26.Jalili R, Horecka J, Swartz JR, Davis RW & Persson HHJ Streamlined circular proximity ligation assay provides high stringency and compatibility with low-affinity antibodies. Proc. Natl Acad. Sci. USA 115, E925–E933 (2018). [DOI] [PMC free article] [PubMed] [Google Scholar]
- 27.Dore K. et al. SYNPLA, a method to identify synapses displaying plasticity after learning. Proc. Natl Acad. Sci. USA 117, 3214–3219 (2020). [DOI] [PMC free article] [PubMed] [Google Scholar]
- 28.Weibrecht I. et al. In situ detection of individual mRNA molecules and protein complexes or post-translational modifications using padlock probes combined with the in situ proximity ligation assay. Nat. Protoc 8, 355–372 (2013). [DOI] [PubMed] [Google Scholar]
- 29.Gao X & Hannoush RN Single-cell in situ imaging of palmitoylation in fatty-acylated proteins. Nat. Protoc 9, 2607–2623 (2014). [DOI] [PubMed] [Google Scholar]
- 30.tom Dieck S. et al. Direct visualization of newly synthesized target proteins in situ. Nat. Methods 12, 411–414 (2015). [DOI] [PMC free article] [PubMed] [Google Scholar]
- 31.Robinson PV, Tsai CT, de Groot AE, McKechnie JL & Bertozzi CR Glyco-seek: ultrasensitive detection of protein-specific glycosylation by proximity ligation polymerase chain reaction. J. Am. Chem. Soc 138, 10722–10725 (2016). [DOI] [PMC free article] [PubMed] [Google Scholar]
- 32.Frei AP et al. Highly multiplexed simultaneous detection of RNAs and proteins in single cells. Nat. Methods 13, 269–275 (2016). [DOI] [PMC free article] [PubMed] [Google Scholar]
- 33.Duckworth AD et al. Multiplexed profiling of RNA and protein expression signatures in individual cells using flow or mass cytometry. Nat. Protoc 14, 901–920 (2019). [DOI] [PMC free article] [PubMed] [Google Scholar]
- 34.Ohata J. et al. An activity-based methionine bioconjugation approach to developing proximity-activated imaging reporters. ACS Cent. Sci 6, 32–40 (2020). [DOI] [PMC free article] [PubMed] [Google Scholar]
- 35.Ren X. et al. Single-cell imaging of m6A modified RNA using m6A-specific in situ hybridization mediated proximity ligation assay (m6AISH-PLA). Angew. Chem. Int. Ed. Engl 60, 22646–22651 (2021). [DOI] [PubMed] [Google Scholar]
- 36.Yue H. et al. Systematic screening and optimization of single-stranded DNA aptamer specific for N-acetylneuraminic acid: a comparative study. Sens. Actuators B Chem 344, 130270 (2021). [Google Scholar]
- 37.Cummings RD & Etzler ME In Essentials of Glycobiology 2nd edn (eds Cummings VA et al. ) Ch 45 (Cold Spring Harbor Laboratory Press, 2009). [PubMed] [Google Scholar]
- 38.Tommasone S. et al. The challenges of glycan recognition with natural and artificial receptors. Chem. Soc. Rev 48, 5488–5505 (2019). [DOI] [PubMed] [Google Scholar]
- 39.Huang N. et al. Natural display of nuclear-encoded RNA on the cell surface and its impact on cell interaction. Genome Biol. 21, 225 (2020). [DOI] [PMC free article] [PubMed] [Google Scholar]
- 40.Sezgin E, Levental I, Mayor S & Eggeling C The mystery of membrane organization: composition, regulation and roles of lipid rafts. Nat. Rev. Mol. Cell Biol 18, 361–374 (2017). [DOI] [PMC free article] [PubMed] [Google Scholar]
- 41.Manders EMM, Verbeek FJ & Aten JA Measurement of co-localization of objects in dual-colour confocal images. J. Microsc 169, 375–382 (1993). [DOI] [PubMed] [Google Scholar]
- 42.Hong W. SNAREs and traffic. Biochim. Biophys. Acta 1744, 120–144 (2005). [DOI] [PubMed] [Google Scholar]
- 43.Potapenko IO et al. Glycan-related gene expression signatures in breast cancer subtypes; relation to survival. Mol. Oncol 9, 861–876 (2015). [DOI] [PMC free article] [PubMed] [Google Scholar]
- 44.Pinho SS & Reis CA Glycosylation in cancer: mechanisms and clinical implications. Nat. Rev. Cancer 15, 540–555 (2015). [DOI] [PubMed] [Google Scholar]
- 45.Munkley J & Elliott DJ Hallmarks of glycosylation in cancer. Oncotarget 7, 35478–35489 (2016). [DOI] [PMC free article] [PubMed] [Google Scholar]
- 46.Pearce OM & Laubli H Sialic acids in cancer biology and immunity. Glycobiology 26, 111–128 (2016). [DOI] [PubMed] [Google Scholar]
- 47.Reis CA, Osorio H, Silva L, Gomes C & David L Alterations in glycosylation as biomarkers for cancer detection. J. Clin. Pathol 63, 322–329 (2010). [DOI] [PubMed] [Google Scholar]
- 48.Ma X. et al. Functional roles of sialylation in breast cancer progression through miR-26a/26b targeting ST8SIA4. Cell Death Dis. 7, e2561 (2016). [DOI] [PMC free article] [PubMed] [Google Scholar]
- 49.Zhang T, de Waard AA, Wuhrer M & Spaapen RM The role of glycosphingolipids in immune cell functions. Front. Immunol 10, 90 (2019). [DOI] [PMC free article] [PubMed] [Google Scholar]
- 50.Dusoswa SA et al. Glioblastomas exploit truncated O-linked glycans for local and distant immune modulation via the macrophage galactose-type lectin. Proc. Natl Acad. Sci. USA 117, 3693–3703 (2020). [DOI] [PMC free article] [PubMed] [Google Scholar]
- 51.Bartish M, Del Rincon SV, Rudd CE & Saragovi HU Aiming for the sweet spot: glyco-immune checkpoints and γδ T cells in targeted immunotherapy. Front. Immunol 11, 564499 (2020). [DOI] [PMC free article] [PubMed] [Google Scholar]
- 52.Venkatakrishnan V. et al. Glycan analysis of human neutrophil granules implicates a maturation-dependent glycosylation machinery. J. Biol. Chem 295, 12648–12660 (2020). [DOI] [PMC free article] [PubMed] [Google Scholar]
- 53.Sewald X. et al. Retroviruses use CD169-mediated trans-infection of permissive lymphocytes to establish infection. Science 350, 563–567 (2015). [DOI] [PMC free article] [PubMed] [Google Scholar]
- 54.Man S. et al. CXCL12-induced monocyte-endothelial interactions promote lymphocyte transmigration across an in vitro blood–brain barrier. Sci. Transl. Med 4, 119ra114 (2012). [DOI] [PMC free article] [PubMed] [Google Scholar]
- 55.Ren X. et al. Reconstruction of cell spatial organization from single-cell RNA sequencing data based on ligand–receptor mediated self-assembly. Cell Res. 30, 763–778 (2020). [DOI] [PMC free article] [PubMed] [Google Scholar]
- 56.Li F. et al. A covalent approach for site-specific RNA labeling in mammalian cells. Angew. Chem. Int. Ed. Engl 54, 4597–4602 (2015). [DOI] [PubMed] [Google Scholar]
- 57.Rabani M. et al. Metabolic labeling of RNA uncovers principles of RNA production and degradation dynamics in mammalian cells. Nat. Biotechnol 29, 436–442 (2011). [DOI] [PMC free article] [PubMed] [Google Scholar]
- 58.Ouldridge TE, Louis AA & Doye JPK Structural, mechanical, and thermodynamic properties of a coarse-grained DNA model. J. Chem. Phys 134, 085101 (2011). [DOI] [PubMed] [Google Scholar]
- 59.Snodin BEK et al. Introducing improved structural properties and salt dependence into a coarse-grained model of DNA. J. Chem. Phys 142, 234901 (2015). [DOI] [PubMed] [Google Scholar]
- 60.Bohlin J. et al. Design and simulation of DNA, RNA and hybrid protein–nucleic acid nanostructures with oxView. Nat. Protoc 17, 1762–1788 (2022). [DOI] [PubMed] [Google Scholar]
- 61.Baxter EW et al. Standardized protocols for differentiation of THP-1 cells to macrophages with distinct M(IFNγ+LPS), M(IL-4) and M(IL-10) phenotypes. J. Immunol. Methods 478, 112721 (2020). [DOI] [PubMed] [Google Scholar]
- 62.Tarella C, Ferrero D, Gallo E, Pagliardi GL & Ruscetti FW Induction of differentiation of HL-60 cells by dimethyl sulfoxide: evidence for a stochastic model not linked to the cell division cycle 1. Cancer Res. 42, 445–449 (1982). [PubMed] [Google Scholar]
- 63.Millius A & Weiner OD in Live Cell Imaging: Methods and Protocols (ed Papkovsky DB) 147–158 (Humana Press, 2010). [Google Scholar]
- 64.Lopez-Sambrooks C et al. Oligosaccharyltransferase inhibition induces senescence in RTK-driven tumor cells. Nat. Chem. Biol 12, 1023–1030 (2016). [DOI] [PMC free article] [PubMed] [Google Scholar]
- 65.Elbein AD, Tropea JE, Mitchell M & Kaushal GP Kifunensine, a potent inhibitor of the glycoprotein processing mannosidase I. J. Biol. Chem 265, 15599–15605 (1990). [PubMed] [Google Scholar]
- 66.Tulsiani DR, Harris TM & Touster O Swainsonine inhibits the biosynthesis of complex glycoproteins by inhibition of Golgi mannosidase II. J. Biol. Chem 257, 7936–7939 (1982). [PubMed] [Google Scholar]
- 67.Poppleton E. et al. Design, optimization and analysis of large DNA and RNA nanostructures through interactive visualization, editing and molecular simulation. Nucleic Acids Res. 48, e72 (2020). [DOI] [PMC free article] [PubMed] [Google Scholar]
Associated Data
This section collects any data citations, data availability statements, or supplementary materials included in this article.
Supplementary Materials
Data Availability Statement
The data generated and analyzed during the current study are available at https://figshare.com/projects/Spatial_Imaging_of_GlycoRNA_in_single_Cells_with_ARPLA/164113. Source data are provided with this paper.
The code generated and used for data analysis during the current study are available at https://figshare.com/projects/Spatial_Imaging_of_GlycoRNA_in_single_Cells_with_ARPLA/164113.


